APhO 2000, Експеримент — Задача 1. Determination of the Density of Oil
1st ASIAN PHYSICS OLYMPIAD — KARAWACI, INDONESIA — EXPERIMENTAL COMPETITION — APRIL 27, 2000
Внимание: Бележка към темата
The official solutions refer to figures (Figures 1, 2 and 4 for Problem 1, Figure 1 for Problem 2) that are missing from the archived solutions file; only Figure 3 is printed.
READ THIS FIRST
- Use only the pen provided.
- Use only the marked side of the paper
- Each problem should be answered on separate sheets
- In your answers please user primarily symbols, equations, numbers, graphs, tables and as little text as possible.
- Write at the top of every sheet in your report:
- Your candidate number (APhO identification number).
- The problem number and section identification, e.g.2/a.
- Number each sheet consecutively.
- Write on the front page the total number of sheets in your report
This set of problems consists of .... pages
Условие
Listed below are the only apparatus and materials available for your experiment :
- Test tube with uniform cross-section over most of its length between its to ends.
- Vessel
- Ruler
- Eye dropper
- Graph papers
- Drying cloth/tissue papers
- Rubber band for level marking
- Distilled water with density 1.00 g/cm
- Oil in a plastic cup
In this experiment, you are to determine the density of the oil without measuring the dimensions of the tube. You should not put both oil and water in the tube at the same time.
Include the following in your report:
a. The theoretical basis for the analysis
b. A description of the method and procedure of the experiment
c. Final value for the density of oil
The errors and their sources
Отговори
0.8484 g/cm³
Official sample result: ρ0 = 0.8484 (printed without unit, relative to ρw = 1.00 g/cm³), Δρ0 = 0.04%. The grading scheme gives the real value as 0.84 g/cm³.
Решение
Determination of the density of oil
Experimental Configuration
This experiment is an application of Archimedes’ law. The basic experimental configuration is accordingly described by Figure 1. It is assumed in this figure that the tube is in an up-right position (perpendicular to water surface). It is also clear that the same reference point must be used for measuring the positions of water or oil surfaces.
Figure 1: Experimental configuration and experimental quantities to be measured.
In order to apply the law accurately to the experiment, one needs to express the precise volume occupied by the liquid inside the tube, and the volume of water displaced outside the tube. For that purpose, more detailed annotation must be introduced on the dimensional features of the test tube as shown in Figure 2.
Figure 2: Specification of test tube.
Theoretical formulation
The complete listing of notations to be used in the theoretical formulation along with their corresponding definitions are given below
Sc = internal cross-section of the tube above point A
Sz = external cross-section of the tube above point A
Vo = internal volume of the test tube below point A
Ve = external volume of the test tube below point A
= Vo volume of the glass below point A
lz = distance between point A and the water surface outside the tube
lc = distance between point A and the liquid surface inside the tube
rc = density of the liquid inside the tube
= ρw for water
= ρo for oil
M = mass of the empty test tube
At equilibrium, the buoyancy or the Archimedes force is equal to the total weight W of the test tube including the liquid inside it. Referring to Figure 1 and 2 as well as the Notations listed above, we are led to the following expressions:
The equilibrium condition specified by FA= W implies
This equation can be put into the form:
where
Since the coefficient D does not depend on the zero point of lz and lc, the reference point A in this experiment can be chosen at some convenient point on the tube within its length of uniform cross-section as implied by the above formulation.
Measurements
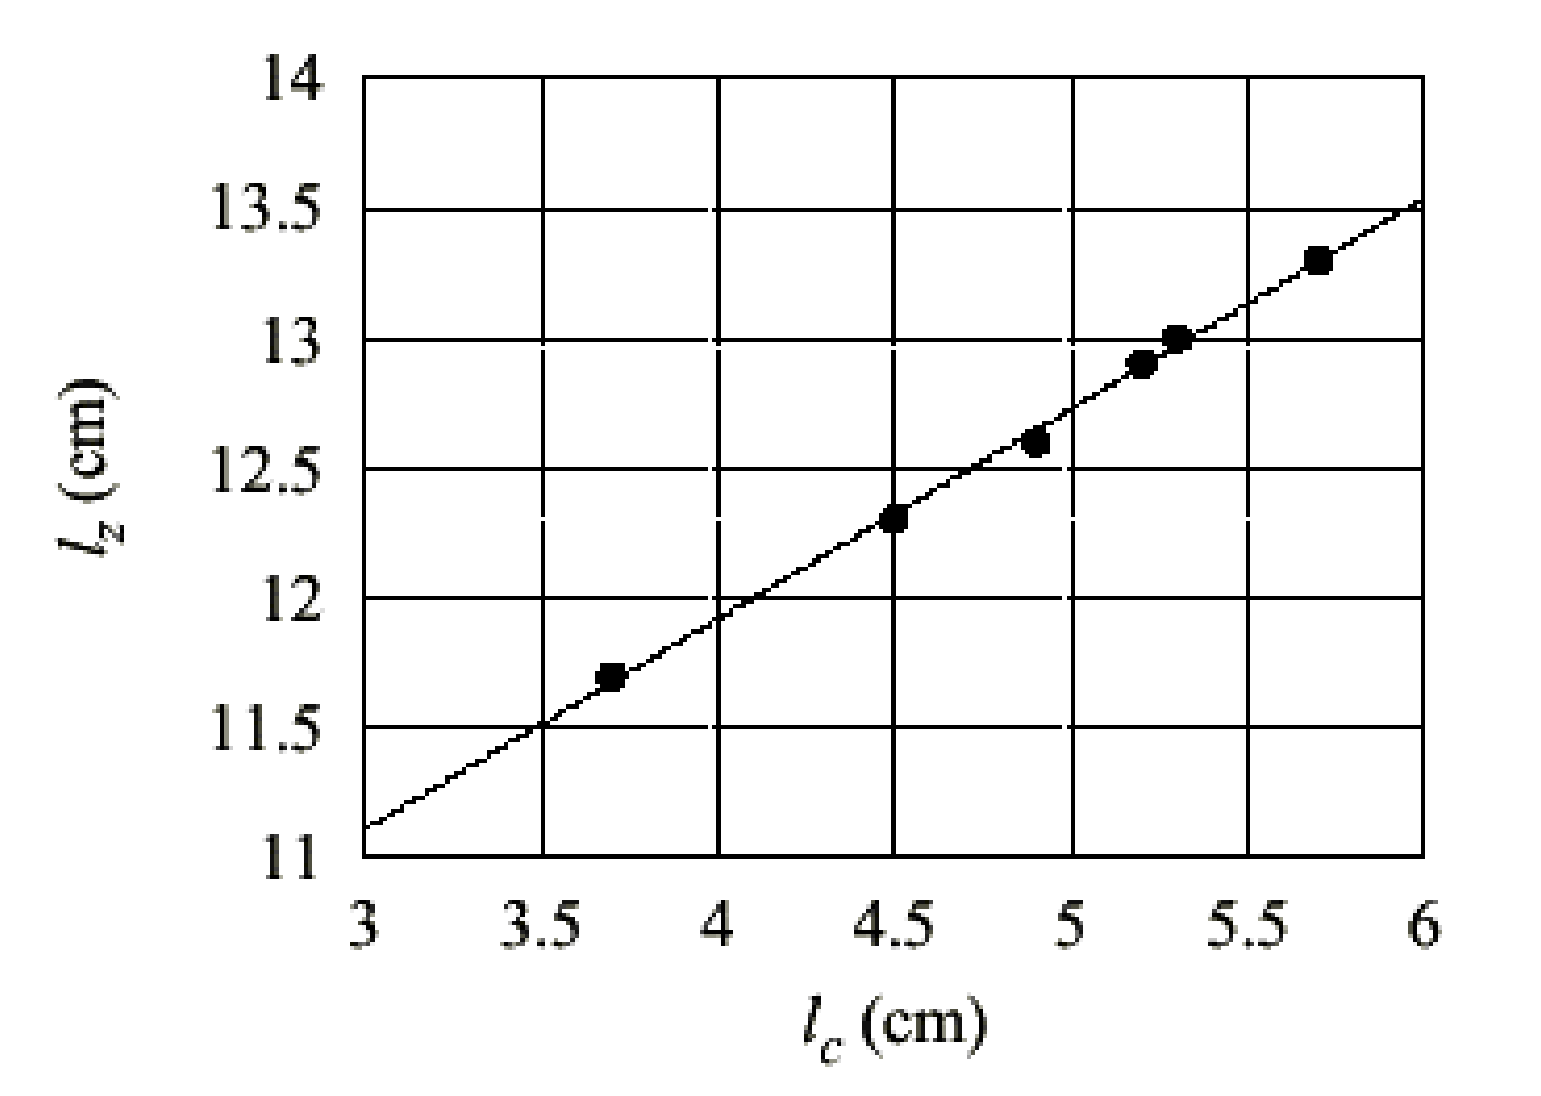
In the first part of the experiment, water is used as the liquid filling the test tube to various levels corresponding to different sets of values for the pair lz and lc. Plotting lz as a function of lc on the graph paper leads to the determination of ,
since in this case.
The same measurements are repeated in the second part, replacing water with oil for the liquid inside the tube. The result is the then given by
Equation Sc Sz from the two equations results in the relation
Experimental result
The experimental results consist of two parts. The results shown in Table 1 and 2 were obtained by using water and the oil as the filling liquids respectively.
Table 1: Data from experiment 1 (water).
| distance from the bottom | lc (cm) | lz (cm) |
|---|---|---|
| 2.5 | 3.7 | 11.7 |
| 2.0 | 4.5 | 12.3 |
| 1.7 | 4.9 | 12.6 |
| 1.4 | 5.2 | 12.9 |
| 1.3 | 5.3 | 13.0 |
| 1.0 | 5.7 | 13.3 |
The value of determined from the slope of the plot in Figure 3 is
Table 2: Data from experiment 2 (paraffin).
| distance from the bottom | lc (cm) | lz (cm) |
|---|---|---|
| 1.8 | 5.7 | 12.5 |
| 1.7 | 6.0 | 12.6 |
| 1.5 | 6.0 | 12.8 |
| 1.3 | 6.4 | 13.0 |
| 1.0 | 6.8 | 13.3 |
| 0.8 | 7.2 | 13.5 |
The value of determined from the slope of the plot in Figure 4 is
The final result for & are
Remarks
- For typical test tube, the ratio Sc/Sz is about 0.8 instead of 1.
- All water and liquid surface positions to be measured must lie within the length of the tube with uniform cross-section.
- For the determination of and , one should try to get more than 2 data points and draw the line with the best fit.
- The test tube should be dried before measurement with the oil.
- The most crucial problem in this experiment is how to get enough data (more than two data points) with the narrowly limited range of 2 - 2.5 cm available for lz variation.
Suggested Grading Scheme
Theoretical Part
- Statement of the equilibrium condition FA W (1.0 p)
- Expression for FA (1.0 p)
- Expression for W (1.0 p)
- Expression for lz as a function of lc including expression for C & D (1.5 p)
- Expression of the formula (1.5 p)
Experimental Part
- Description of experiment detailing (3.0 p)
- the experimental configuration (1.0 p)
- quantities to be measured (1.0 p)
- procedure of measurement (1.0 p)
- Measurement result of lz- lc for water (more than 2 data points) (2.0 p)
- Measurement result of lz- lc for oil (more than 2 data points) (2.0 p)
- Determination of and (1.0 p)
- Determination of (1.0 p)
- Accuracy of the value of ρo (max 3.0 p)
- within 5% of the real value 0.84 g/cm (3.0 p)
- between 5% and 10% of the real value (2.0 p)
- Estimation of uncertainties or errors (2.0 p)
Оригинал в Архива: exp_problems.pdf · официални решения: exp_solutions.pdf