APhO 2002, Експеримент — Задача 2. Experimental Competition PART B
3rd Asian Physics Olympiad — Singapore — Experimental Competition PART B · 10 т.
Внимание: Бележка към темата
In the source PDF a ½ sign is printed as “” (e.g. “2 hours”, “1_ marks”); these are kept as printed. The source text also breaks mid-sentence between pages 2 and 3 of the problem (“…the projection of the rotating” / “case, because…”).
Experimental Competition PART B
(The Experimental Competition consists of two parts, Part A and Part B. The following experiment represents Part B only)
Date: May 10, 2002
Time Available: 2_ hours for Part B
Read the following instructions carefully
- In this experiment, you are not expected to indicate uncertainties of your experimental results.
- Use only the pen provided.
- Use only the front side of the answer sheets and graph papers.
- In your answers please use as little text as possible; express yourself primarily in equations, numbers and figures. If the required result is a numerical number, underline your final result with a wavy line.
- Write on the blank sheets of paper the results of all your measurements and whatever else you consider is required for the solution of the question and that you wish to be marked.
- It is absolutely essential that you enter in the boxes at the top of each sheet of paper used, including graph paper, your Name, your Country, your student number (Student No.), the part number of the question (Question Part No.), the progressive number of each sheet (including graph sheets) (Page No.) and the total number of sheets that you have used and wish to be marked for each question (Total pages). If you use some sheets of paper for notes that you do not wish to be marked, put a large cross through the whole sheet and do not include them in your numbering. Do not write anything on the right column which is reserved for Examiners’ use only.
- At the end of 2_ hours for this half of the examination, please staple your answer and graph sheets in the order of their page numbers, before proceeding to the other half of the examination.
Условие
Objective
To study how the frequency of vibration of a tuning fork varies with an equal mass clamped on each of its prongs (at a definite point near the prong tip), and hence to determine the pair of unknown masses similarly attached to the prongs.
The Stroboscope
The experiment will make use of a stroboscope (strobe) which is a simple electronic device consisting of a discharge lamp which can be made to flash for a short duration with a high intensity at highly regular intervals. The strobe enables the frequency of a rotating or vibrating object to be measured without the need for any direct physical contact with the moving object.
Caution: The strobe has a finite life time, specified in maximum number of flashes obtainable. Do not leave it running idly when you are not using it.
Consider a particle rotating with uniform circular motion being illuminated by a strobe. If the flash frequency is a multiple or sub-multiple of that of the motion, the particle will appear stationary. It follows that the periodicity of the circular motion of the particle can be determined by tuning the frequency of the light flash.
Suppose the frequency of rotation of the particle is Hz, and that of flashing is Hz. Then, in the time interval of s between two successive flashes the particle would have moved through an angle .
If is an irrational number so that it cannot be expressed as a ratio of two integers, then the particle would not appear stationary but would appear to rotate slowly in the forward or backward direction depending on whether is just slightly smaller or larger than some rational number nearby.
If where and are integers, then the strobe would flash times for every complete cycles. Furthermore, if and have no common factors between them (assumed throughout this write-up), then each flash would show a different position of the particle. Thus the particle will exhibit stationary positions under the strobe flashlight.
If becomes too large it might be difficult to count the number of stationary positions displayed by the rotating particle.
The above theory applied to the rotating particle can be similarly applied to that of a tuning fork vibrating in simple harmonic motion if we regard the vibrational motion as equivalent to the motion of the projection of the rotating case, because the vibrating object retraces the same path in the opposite direction every half cycle, there is a chance, though very remote, that an image in one half of a vibration cycle coincides with that in the next half cycle. It would result in only one image (but of double the intensity) being recorded, instead of two. This freak coincidence should be guarded against in an experimental observation.
Identification of Fundamental Synchronism
Fundamental synchronism is obtained when the lamp flashes once for every cycle of rotation or vibration of the mechanism under observation, so that the object appears to stop at one stationary position. However, it will be appreciated that a similar and indistinguishable result will also occur when the flash frequency is a sub-multiple (1/2, 1/3, 1/4, etc) of the object movement frequency. Thus if the object movement frequency is totally unknown, when adjusting for fundamental synchronism, a safe procedure is to start at a high flash frequency, when multiple images are obtained, and then slowly reduce the flash frequency until the first single image appears. This procedure should be adopted in all measurements to check for fundamental synchronism.
Multiples of Fundamental Frequency
Multiples of fundamental frequency occur when the strobe is flashing at a higher rate than the cyclical frequency of the object under observation. The converse when the strobe flashing rate is lower than that of the moving object is referred to as sub-multiples of fundamental frequency.
If the lamp is flashed at a frequency times the rotational frequency of the particle, multiple images can be seen. In such a situation, a rotating particle will appear as several stationary images spaced equally around the circumference. Twice this frequency, or , will produce two such images at radians apart, and three times this frequency, or , will yield three images at radians spacing, etc. The particle rotational frequency is then given by the flash frequency divided by the number of images seen. In general, if , then the strobe would flash times for every cycles of the particle motion, and so there will still be stationary positions.
Sub-multiples of Fundamental Frequency
Here, is less than one. If the strobe frequency is exactly times that of the object movement, where , then the object would have moved through cycles for every flash, and only one stationary image is seen. If , then the strobe would have flashed times for every full cycles of the object movement, and the number of stationary images seen would be .
The Tuning Fork
A tuning fork is designed to vibrate at a fundamental frequency with no harmonics after it is struck. The two prongs of the fork are symmetrical in every respect so that they move in perfect anti-phase and exert, at any instant, equal and opposite forces on the central holder. The net force on the holder is therefore always zero so that the holder does not vibrate, and hence holding it firmly will not cause any undesirable damping. For the same reason the prongs of a tuning fork cannot vibrate in like phase as this will result in a finite oscillatory force on its holder which would cause the vibration to dampen away very quickly.
It is possible to lower the fundamental frequency of the tuning fork by loading an equal weight on each arm. The loading on the arms has to be symmetrical in order to minimise damping of vibration.
For such a loaded tuning fork, the period of vibration is given by:
where is a constant depending on the size, shape and mechanical properties of the tuning fork material and a constant depending on the effective mass of each vibrating arm.
Items of Apparatus provided:
- A stroboscope with digital readout.
- A mini-torch light.
- A tuning fork with a 31.6g weight loaded symmetrically on each prong and with the centre-of-mass of the weight coinciding with the point P marked clearly on each prong.
- Two paper clamps with two detachable levers. The levers are used only to open the clamps, and they should be removed when you are doing the experiment.
- A pair of equal unknown masses .
- A series of the following known masses (in pairs): 5g, 10g, 15g, 20g, 25g.
- Regular graph papers (5 sheets).
Experimental Steps
Step 1: Fundamental synchronism and measurements of multiple frequencies (2.7 marks)
Step 1 (a) Obtain fundamental synchronism between the strobe flash and the vibrating tuning fork loaded with the original 31.6g mass on each prong. By dislodging the mass temporarily, check to make sure that the mass is pre-clamped with its centre-of-mass located at the point P (which is marked on the prong but hidden by the mass). Record its fundamental flash frequency. [0,5 т.]
Step 1 (b) Keeping the flash frequency above the fundamental frequency, try to discover as many readings of flash frequencies as possible which yield observable stationary images of the (31.6g-loaded) tuning fork frequency. Identify their different values. [1,3 т.]
Step 1 (c) Tabulate your data (in the order of increasing ) as follow, keeping as a rational fraction:
| Strobe Reading | Number of Stationary Images | value |
|---|---|---|
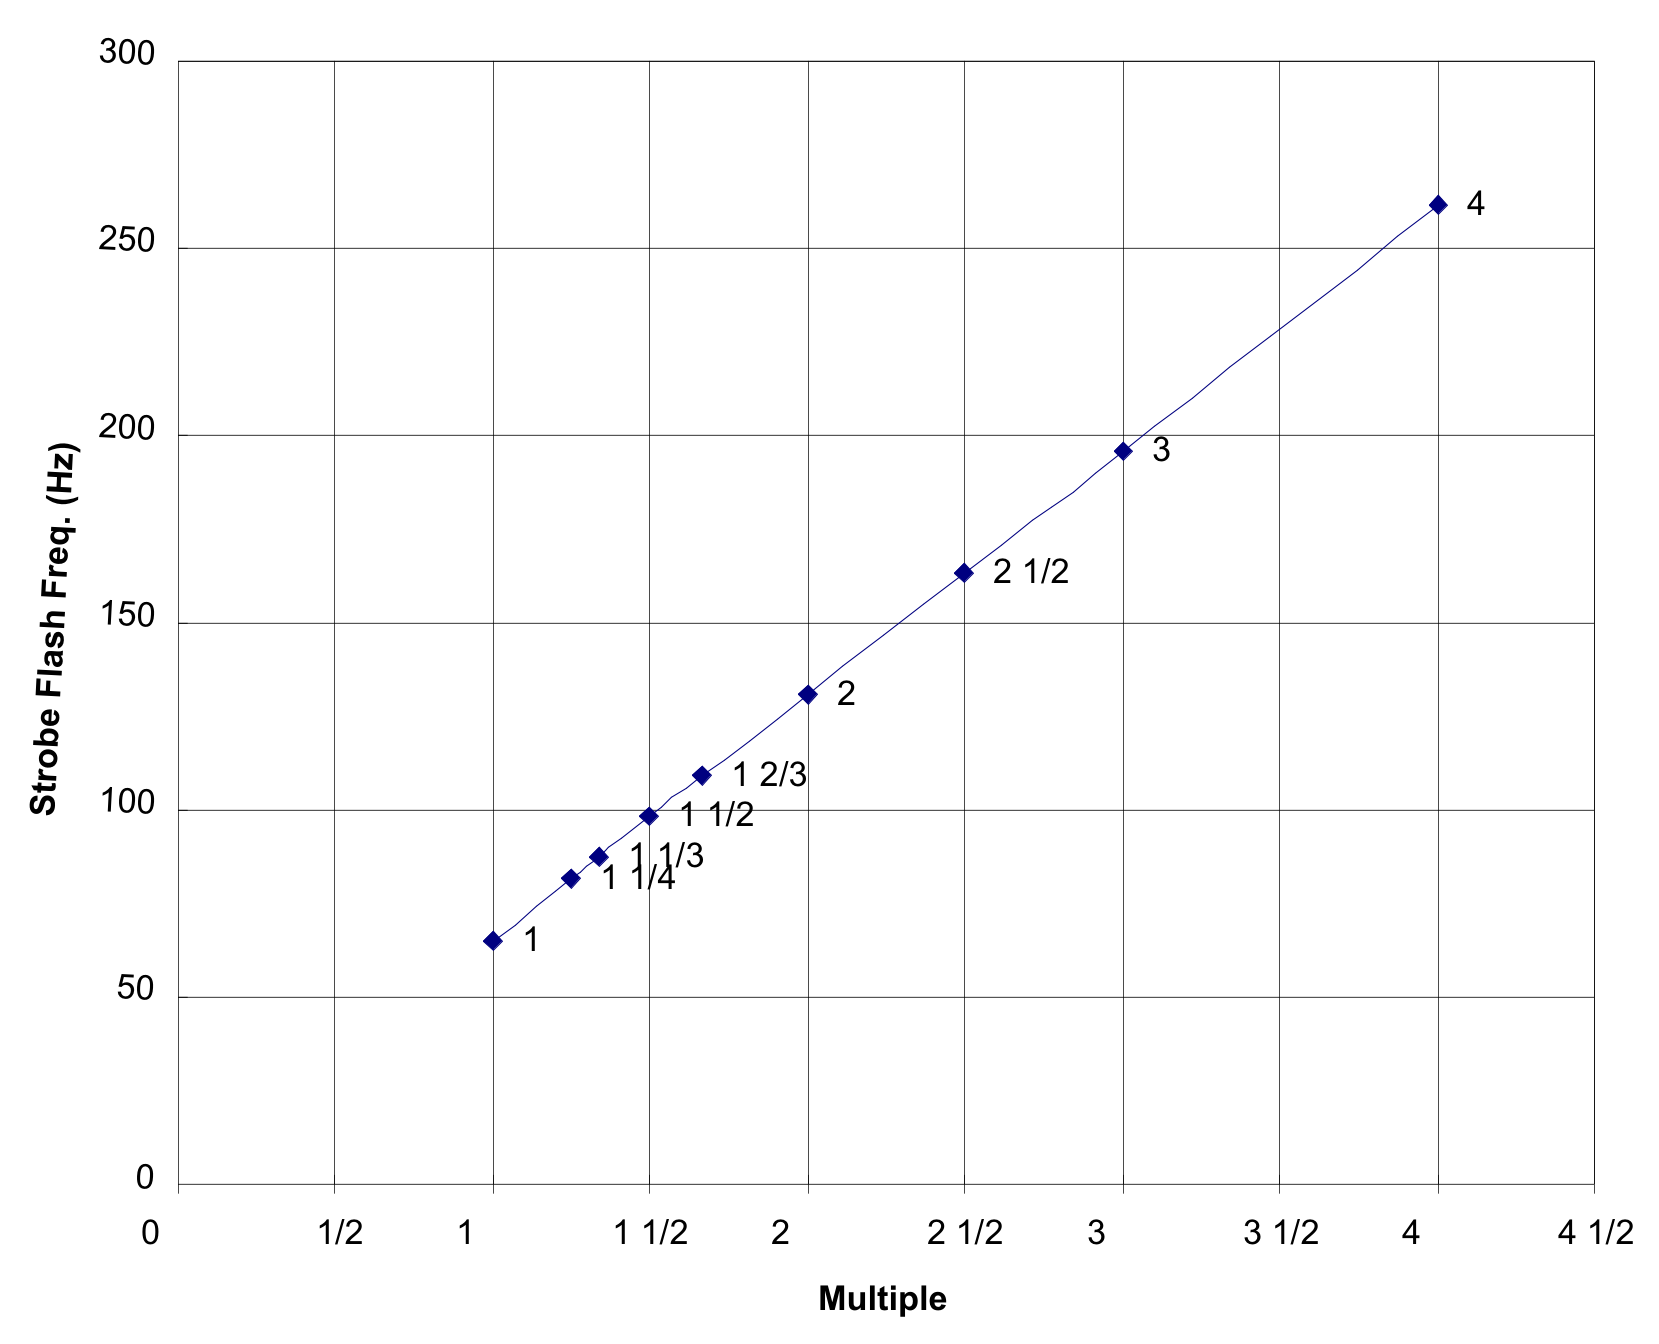
Plot a straight-line graph of all the observed strobe flash frequencies against the corresponding multiple of the tuning fork frequency. Identify each data point on the graph with its value. [0,9 т.]
Step 2: Measurements of sub-multiple frequencies (2.3 marks)
Step 2 (a) Keeping the strobe frequency below the fundamental frequency of the (31.6g-loaded) tuning fork, obtain readings of all observable strobe frequencies which yield stationary images. [1,4 т.]
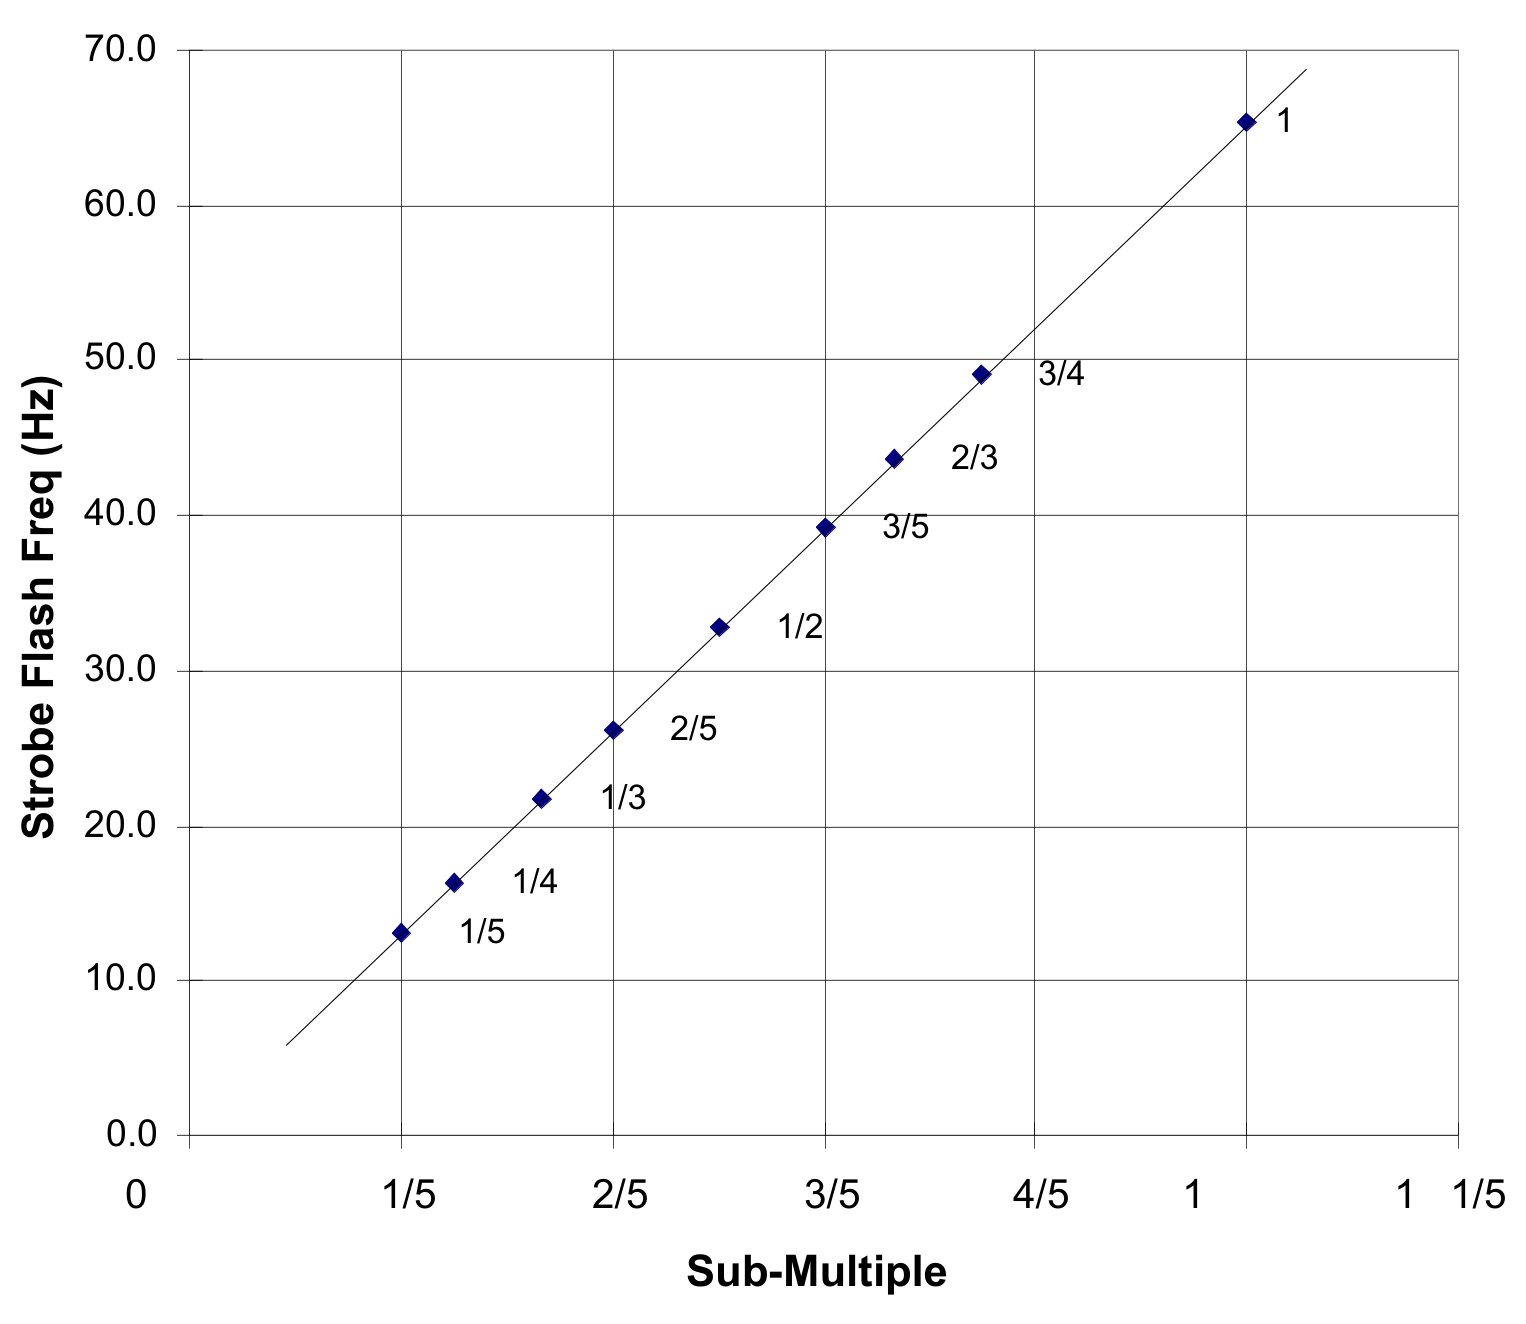
Step 2 (b) Tabulate your readings as in question 1, but in the order of decreasing , and plot a straight-line graph of all the observed strobe frequencies against the corresponding sub-multiple of the (31.6g-loaded) tuning fork frequency. Identify each data point on the graph with its value. [0,9 т.]
Step 3: Determination of the pair of unknown masses (5 marks)
Step 3 (a) Remove the 31.6g loading mass from each prong (which would also reveal the point P marked on the prong) and obtain the resulting vibrational frequency of the unloaded tuning fork. [0,5 т.]
Step 3 (b) Next, obtain the vibrational frequencies of the tuning fork with each prong loaded with known masses of 5g, 10g, 15g, 20g and 25g respectively. Ensure that in each case the centre-of-mass of the load coincides with the point P. Note that the value of as labelled on the mass is the total mass of both the mass itself and that of the given paper clamp (with both its levers removed) used to clamp it. [1,5 т.]
Step 3 (c) Tabulate your results using your data obtained in (b) and plot a graph of against . Obtain the slope, and the intercept on the -axis. [2,2 т.]
Step 3 (d) Replace the known loading masses with the unknown masses , and obtain the vibrational frequency under this loading. Deduce . Again, note that also includes the mass of the paper clamp (with both its levers removed). [0,8 т.]
Отговори
Step 1 (a) 65.1 Hz
Fundamental flash frequency of the 31.6g-loaded fork in the official solution table (q/p = 1).
Step 3 (a) 128.3 Hz
Frequency for weight 0 in the official Expt 3 table (printed “128.3_”).
Step 3 (d) 12.8 g
Official value; the marking scheme gives full marks for 12-14g.
Решение
SOLUTION to Part B of Experimental Competition, APhO 2002
Step 1. Fundamental Synchronism and Multiple Frequencies
| Strobe reading (Hz) | No. of stationary images | q/p value |
|---|---|---|
| _ | _ | _ |
| 65.1 | 1 | 1 |
| 81.7 | 5 | 1 1/4 |
| 87.2 | 4 | 1 1/3 |
| 98.1 | 3 | 1 1/2 |
| 109.0 | 5 | 1 2/3 |
| 130.8 | 2 | 2 |
| 163.5 | 5 | 2 1/2 |
| 196.2 | 3 | 3 |
| 261.4 | 4 | 4 |
Expt 2 : Sub-multiple frequencies
| Strobe reading (Hz) | No. of stationary images | q/p value |
|---|---|---|
| 65.1 | 1 | 1 |
| 49.0 | 3 | 3/4 |
| 43.6 | 2 | 2/3 |
| 39.2 | 3 | 3/5 |
| 32.7 | 1 | 1/2 |
| 26.2 | 2 | 2/5 |
| 21.8 | 1 | 1/3 |
| 16.3 | 1 | 1/4 |
| 13.0 | 1 | 1/5 |
Expt 3 : Determination of X
| Weight (g) | Frequency (Hz) | Period (T) (ms) | () |
|---|---|---|---|
| 0_ | 128.3_ | 7.794_ | 60.8_ |
| 5 | 106.6 | 9.381 | 88.0 |
| 10 | 94.0 | 10.64 | 113 |
| 12.8 | 87.5 | 11.43 | 131 |
| 15 | 83.2 | 12.02 | 144 |
| 20 | 76.0 | 13.16 | 173 |
| 25 | 70.1 | 14.27 | 204 |
| 31.6 | 65.1 | 15.36 | 236 |
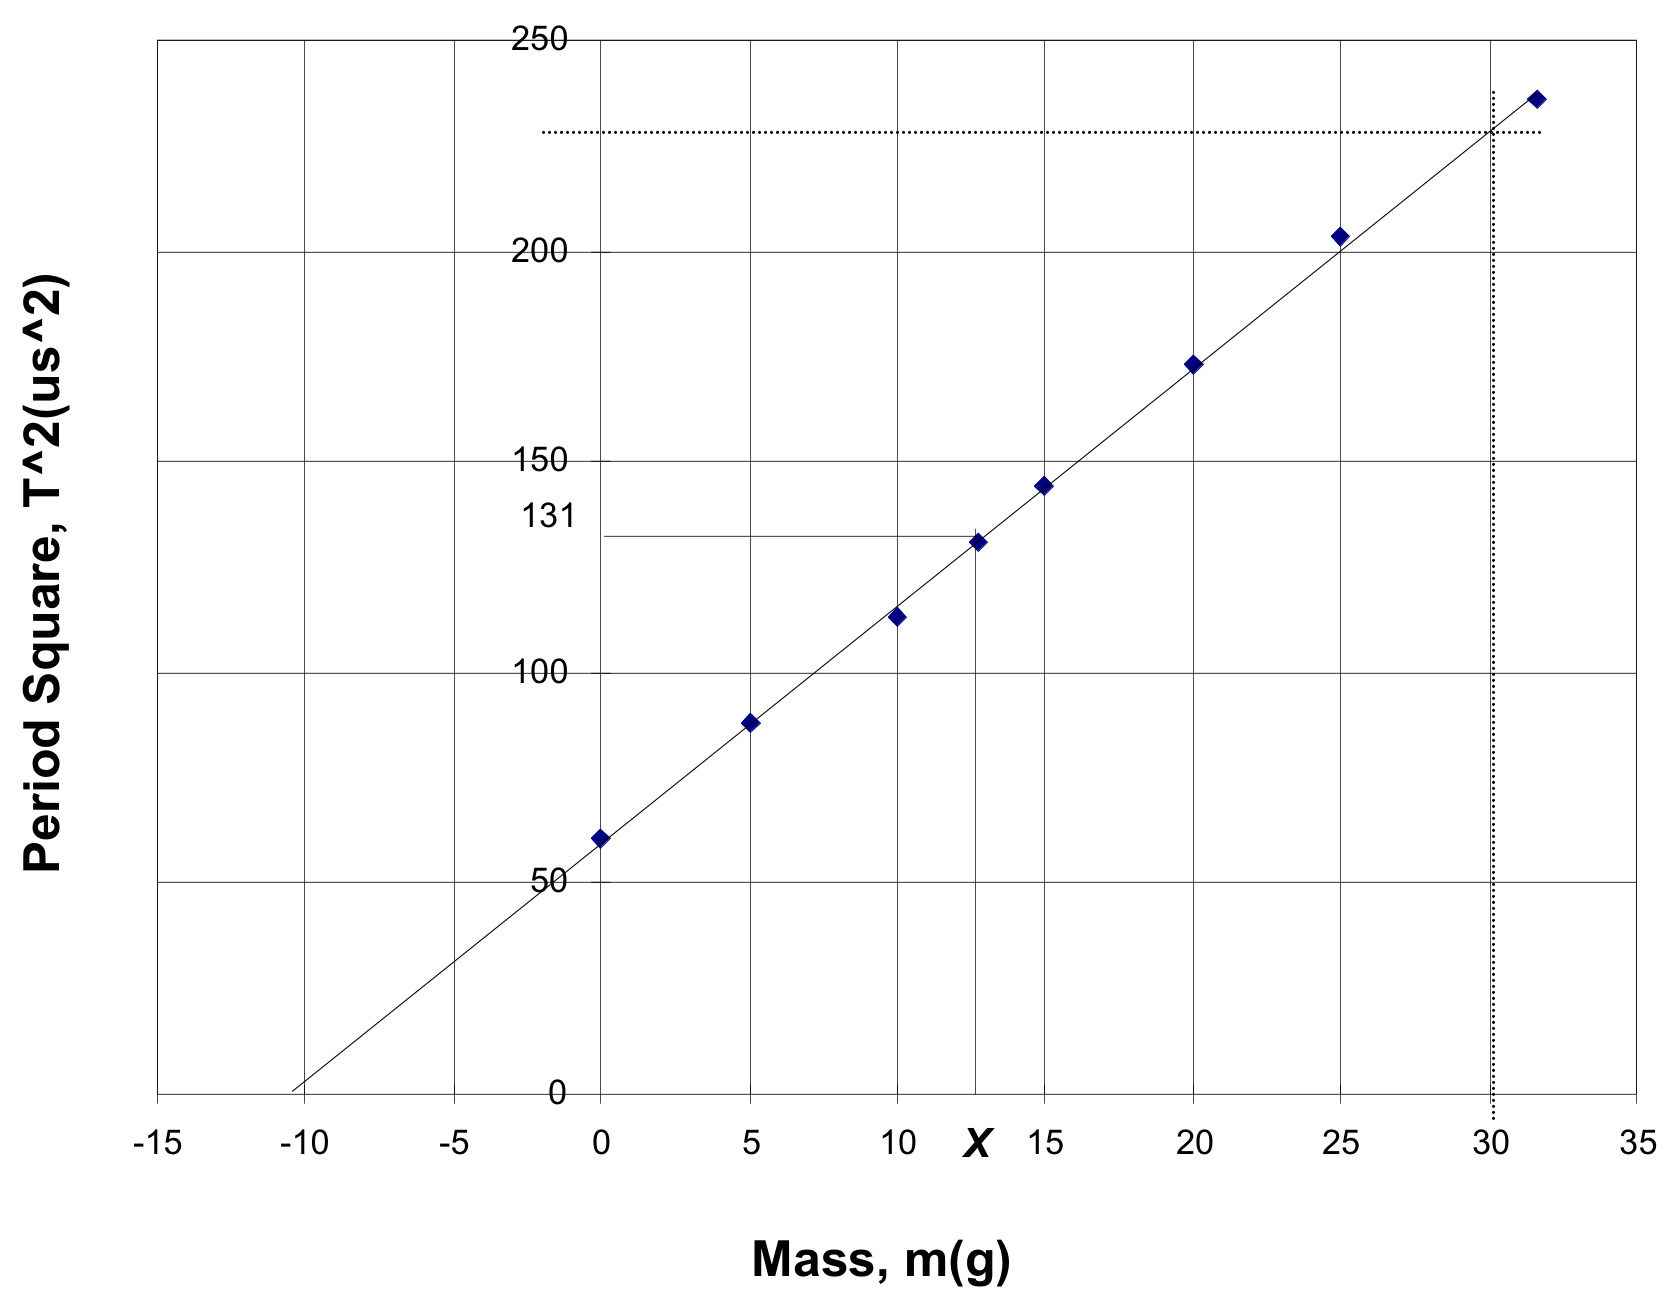
Intercept on m-axis = –10.5 g
Best fit slope = 230/40.5 = 5.7 /g
Value of = 12.8 g
Evaluation Guidelines
Step 1:
(a) Fundamental synchronism frequency (0.5 mark)
(b) Accuracy and adequacy of other data points (1.3 marks)
(c) Proper tabulation and plot of flash frequency against multiples of tuning fork frequency (0.9 mark)
Step 2:
(a) Accuracy and adequacy of data pts (1.4 marks)
(b) Proper tabulation and plot of flash frequency against sub-multiples of tuning fork frequency (0.9 mark)
Step 3:
(a) Frequency of unloaded fork (0.5 mark)
(b) Accuracy of data points (1.5 marks)
(c) Tabulation, graph and good values for slope and intercept (2.2 marks)
(d) Determination of (0.8 mark)
APhO 2002 Part B Mark Sheet: The Stroboscope
Country – Student No. – Ttl No. of Pages
| Expt. No. & | Part Number and Description | Max. Mark | Scored Mark | References |
|---|---|---|---|---|
| 1: Fundamental and multiple frequency | (a) Fundamental frequency | 5 | 64-66 Hz: 5 marks, else 63-67 Hz: 4 marks, else 61-69 Hz; 2_ marks, else 0 | |
| (b) Tabulation, Accuracy & adequacy of data points | 13 | 1 mark for tabulation. 1_ marks per pt. up to 8 pts. excluding fund. freq. pt. | ||
| (c) Graph with identification | 9 | 2 marks for proper straight-line graph. 2 marks for proper axes. _ mark per identification up to 3 marks. 2 marks for inclusion of fundamental freq. pt. | ||
| 2: Sub-multiple frequency | (a) Tabulation, Accuracy & adequacy of data points | 14 | 2 marks for tabulation. 1_ marks per pt. up to 8 pts excluding fund. freq. pt. | |
| (b) Graph with identification | 9 | as in part 1(c). | ||
| 3: Variation of with | (a) Freq of unloaded fork | 5 | 127-129 Hz: 5 marks, else 126-130 Hz: 4_ marks, else 125-131 Hz: 4 marks, else 122-134 Hz: 2_ marks, else 0 | |
| (b) Accuracy of other data points | 15 | 3 marks per pt. excluding those for no and full load. | ||
| (c) Tabulation and Graph | 10 | 2 marks for tabulation. 2 marks each for no- and full-load pts. 2 marks for proper straight-line graph. 2 marks for proper axes. | ||
| Slope | 7 | 5-6.5 /g: 7 marks, else 4-7.5 /g: 5_ marks, else 3-8.5 /g: 3 marks, else 0 | ||
| Intercept | 5 | –8 to –12g: 5 marks, else –6 to –14g: 3_ marks, else 0 | ||
| (d) Determination of | 8 | 12-14g: 8 marks, else 10-16g: 6 marks, else 8-18g: 3 marks, else 0 | ||
| TOTAL | 50 | Normalised = |
Оригинал в Архива: exp2.pdf · официални решения: exp2_sol.pdf