APhO 2003, Експеримент — Задача 1. Determination of Capacitance
4th Asian Physics Olympiad — Experimental Competition — 25 April 2003. I. Determination of Capacitance · 10 т.
Условие
Background
It is known that capacitors play a significant role in the electrical circuits. There are several methods of measurements of the capacitance of a capacitor. In this experiment you are required to perform the experiment in order to determine the capacitance of an AC capacitor using a simple electrical circuitry.
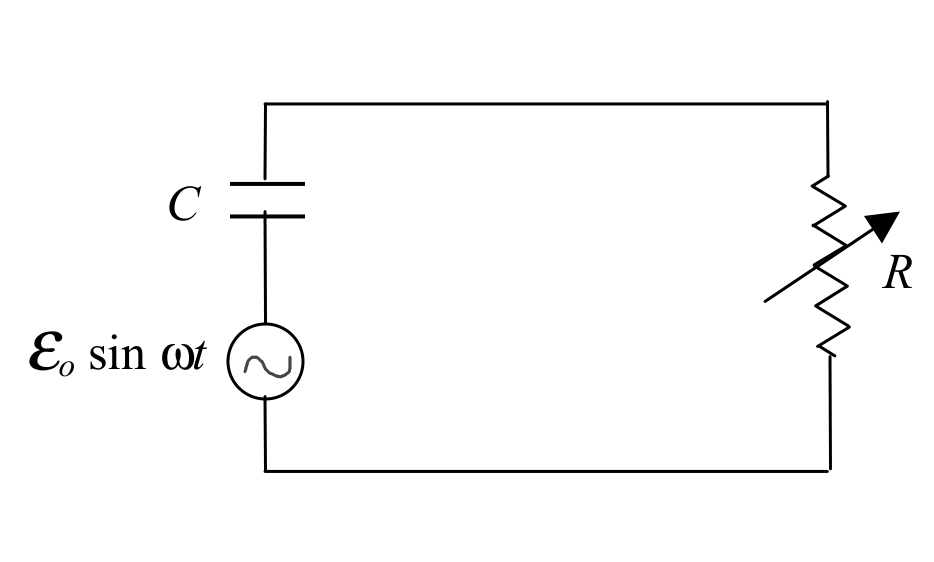
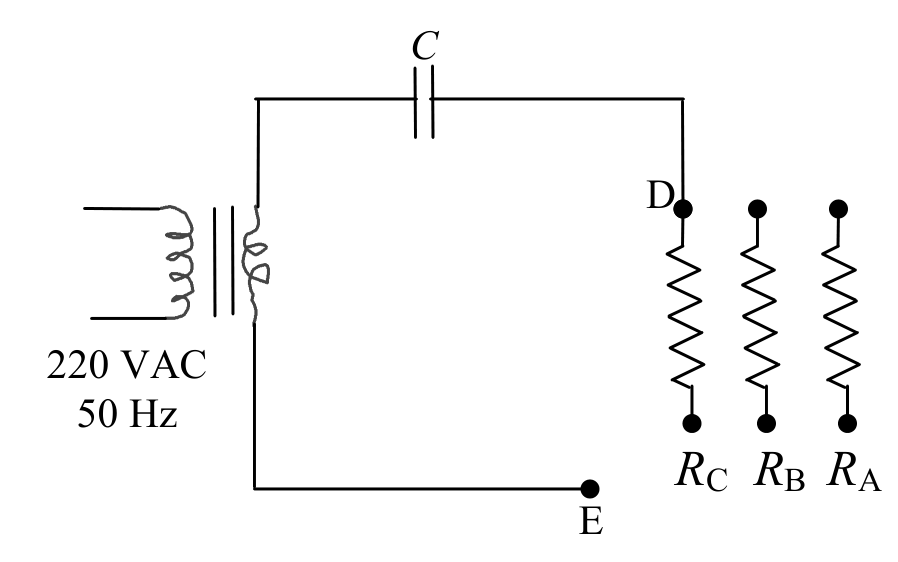
In Fig. 1.1 (a), a capacitor of capacitance and a resistor of resistance are connected in series to the alternating voltage source of mains frequency. The electrical power which is dissipated at the resistor depends on the values of , , and frequency of the mains . Graphical analysis of this relationship can be used to determine .
Materials and apparatus
- capacitor
- three resistors of known values with ±5% errors ( , and ) as shown in figure 1.1 (b).
- step-down isolation transformer for alternating voltage source of
- digital voltmeter
- electrical connectors
- linear graph papers
Warning: The digital multimeter in this experiment will be used for measuring the rms voltage () across only. Do not use it to measure in other modes.
Instructions
a) Derive the expression for the average power dissipation in resistor in terms of , , and . [1 т.]
b) Deduce the condition for which is a maximum. [1 т.]
c) Convert the dependence found in a) into a linear dependence of certain quantities and . [1 т.]
d) Measure the root mean square (effective) voltage across for each of all possible combinations of , and . [2,5 т.]
e) Plot versus and from this graph compute the value of capacitance . [2 т.]
f) From c), draw the graph of versus and determine capacitance . [2 т.]
g) Estimate the uncertainties in the values of obtained in e) and f). [0,5 т.]
Отговори
0.0000019 F
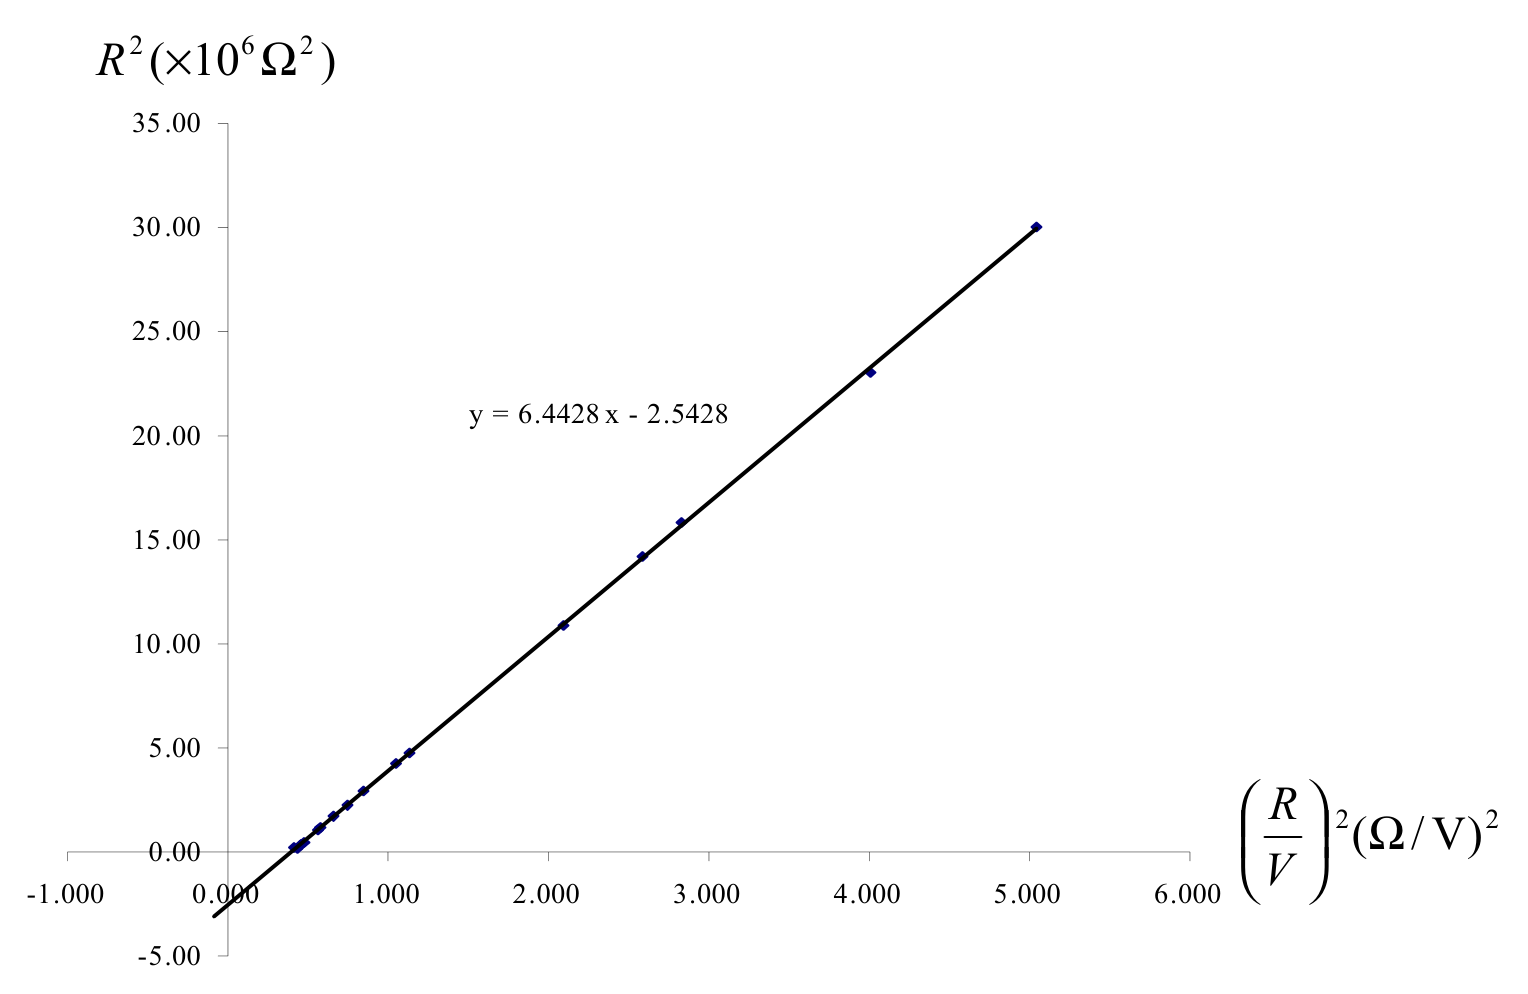
Official sample results: 1.9 µF from the maximum of P versus R (e), 1.95 µF from the 1/(RP) versus 1/R² graph and 1.99 µF from the alternative R² versus (R/V)² graph (f).
Решение
a)
b)
condition for :
c. ( 1 point)
Note: The linear graph will be or versus . If is the slope and is the intercept with the Y axis, then
An alternative method:
Note: The graph will be versus and is determined from the Y-intercept.
d)
| No. | Resistor(s) | (Ω) | (V) | (W) |
|---|---|---|---|---|
| 1 | 680 | 9.86 | 0.144 | |
| 2 | 1500 | 17.36 | 0.202 | |
| 3 | 3300 | 22.81 | 0.159 | |
| 4 | 2180 | 20.49 | 0.193 | |
| 5 | // | 468 | 7.28 | 0.111 |
| 6 | 4800 | 23.98 | 0.122 | |
| 7 | // | 1032 | 13.78 | 0.186 |
| 8 | 3980 | 23.66 | 0.141 | |
| 9 | // | 564 | 8.42 | 0.126 |
| 10 | 5480 | 24.40 | 0.109 | |
| 11 | ( // )+ | 3768 | 23.43 | 0.147 |
| 12 | ( // )+ | 1712 | 18.63 | 0.202 |
| 13 | ( // )+ | 2064 | 20.15 | 0.195 |
| 14 | ( // )// | 410 | 6.22 | 0.094 |
| 15 | (+ )// | 1313 | 16.18 | 0.200 |
| 16 | ( + )// | 596 | 8.82 | 0.131 |
| 17 | ( + )// | 1089 | 14.36 | 0.190 |
(2.5 points):(data points = 17; 2.5, ; 2.0, ; 1.5; ; 1.0, ; 0.5)
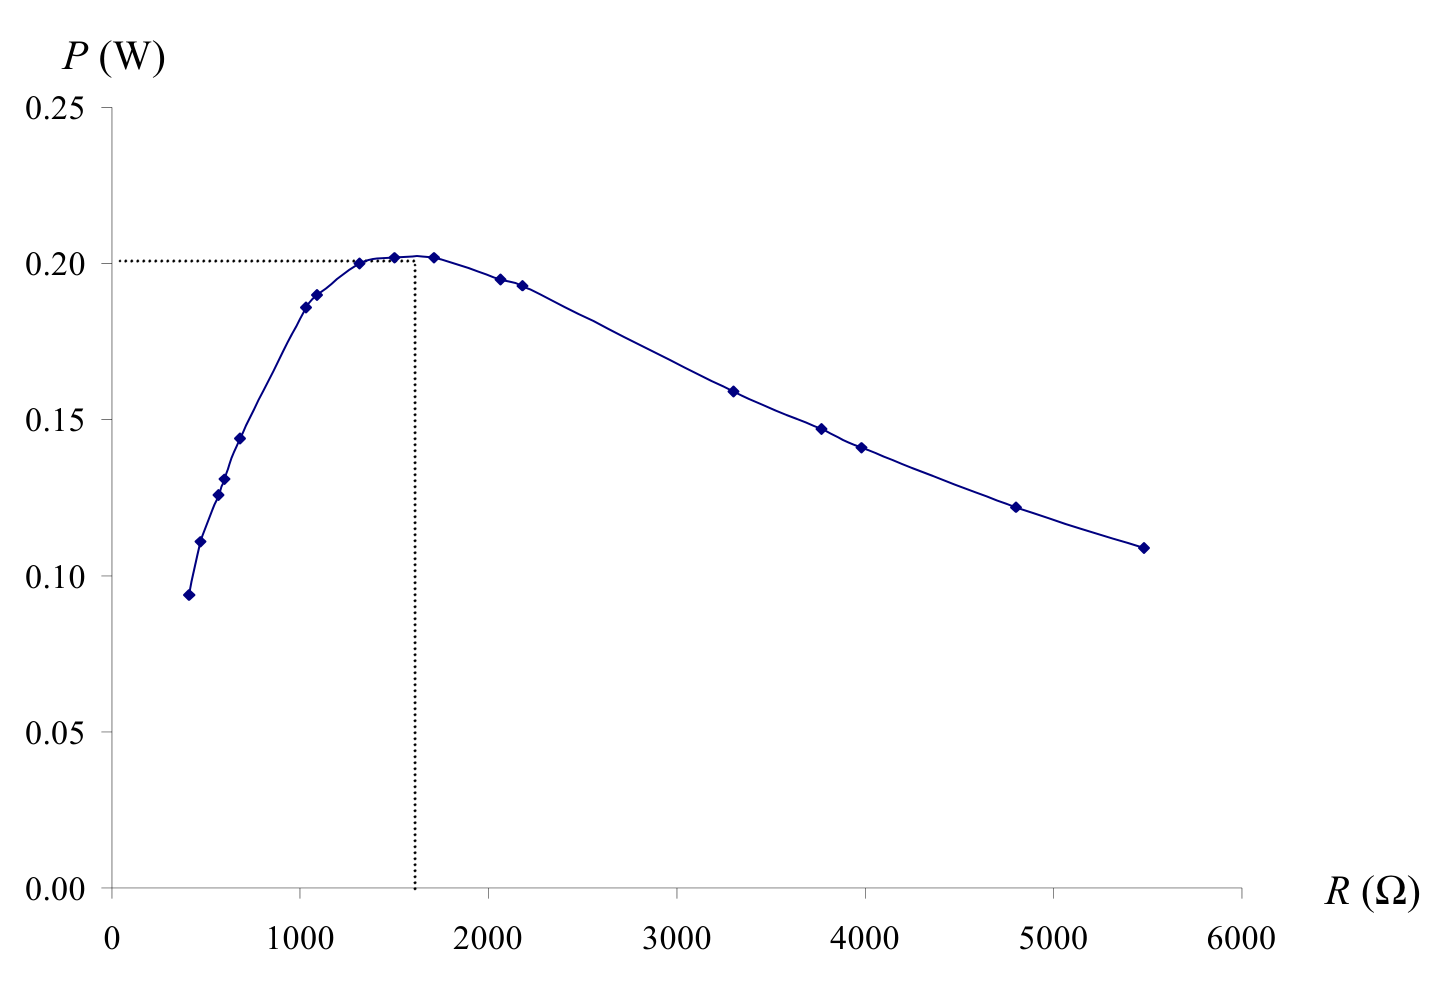
e) (1.5 points):good graph (0.5 point): correct value
f) Linear graph.
| (Ω) | (V) | (W) | (ΩW) | (×10 Ω) |
|---|---|---|---|---|
| 410 | 6.22 | 0.094 | 0.0259 | 5.948 |
| 468 | 7.28 | 0.111 | 0.0193 | 4.565 |
| 564 | 8.42 | 0.126 | 0.0141 | 3.143 |
| 596 | 8.82 | 0.131 | 0.0128 | 2.815 |
| 680 | 9.86 | 0.144 | 0.0102 | 2.162 |
| 1032 | 13.78 | 0.186 | 0.0052 | 0.938 |
| 1089 | 14.36 | 0.190 | 0.0048 | 0.843 |
| 1313 | 16.18 | 0.200 | 0.0038 | 0.580 |
| 1500 | 17.36 | 0.202 | 0.0033 | 0.444 |
| 1712 | 18.63 | 0.202 | 0.0029 | 0.341 |
| 2064 | 20.15 | 0.195 | 0.0025 | 0.234 |
| 2180 | 20.49 | 0.193 | 0.0024 | 0.210 |
| 3300 | 22.81 | 0.159 | 0.0019 | 0.091 |
| 3768 | 23.43 | 0.147 | 0.0018 | 0.070 |
| 3980 | 23.66 | 0.141 | 0.0018 | 0.0631 |
| 4800 | 23.98 | 0.122 | 0.0017 | 0.0434 |
| 5480 | 24.40 | 0.109 | 0.0017 | 0.0333 |
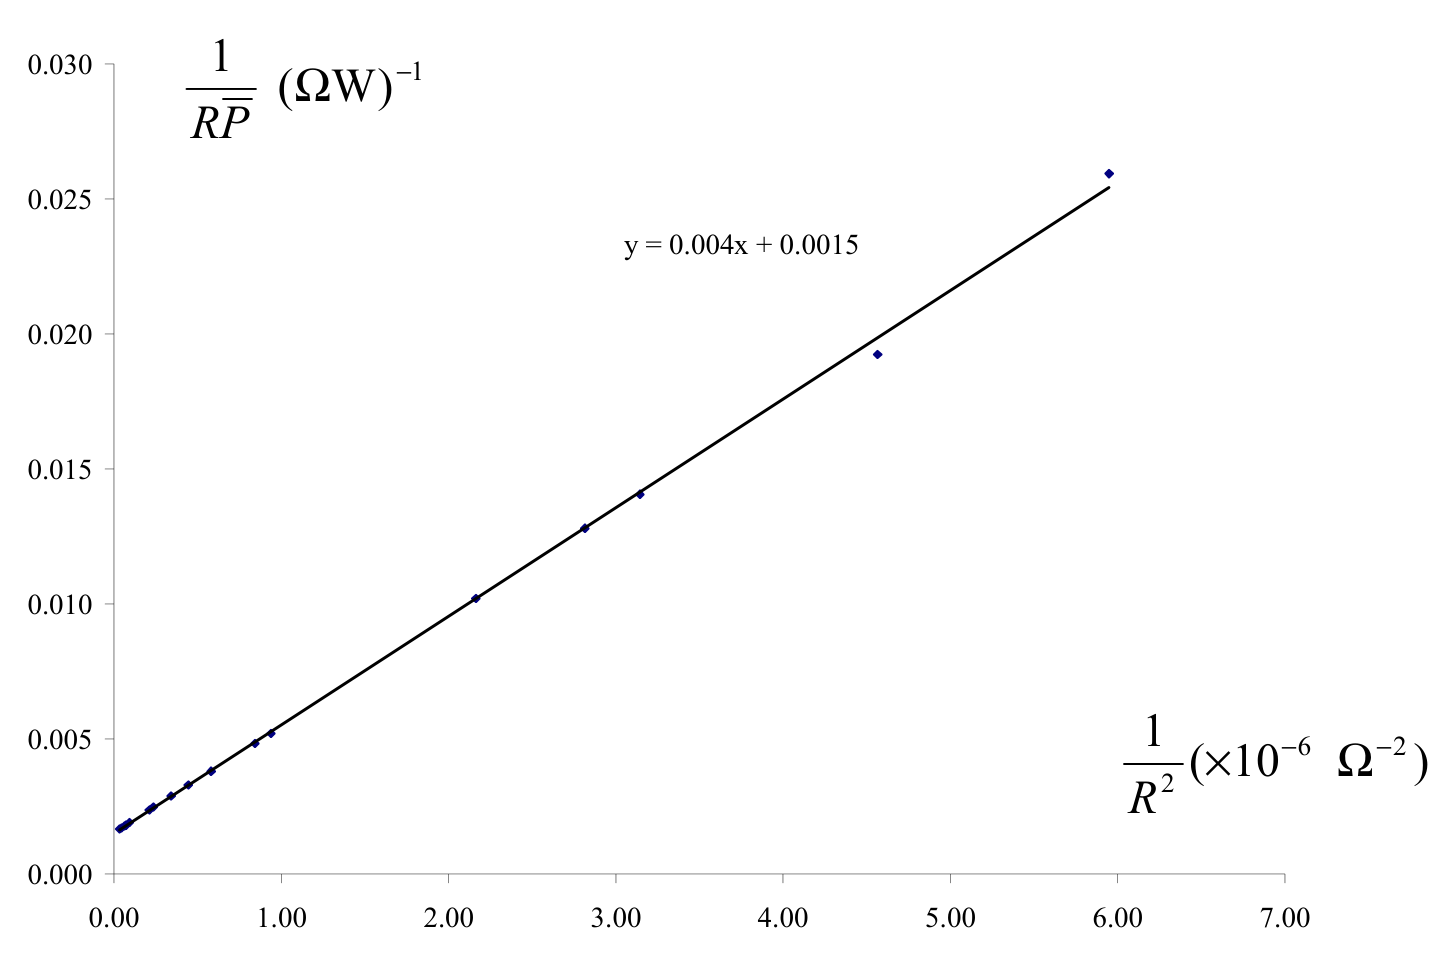
slope = = 0.004 × 10 Ω/W , Y-intercept = = 0.0015 (ΩW) :
An alternative method of linear graph
| (Ω) | (V) | (W) | (Ω /V) | (×10 Ω) |
|---|---|---|---|---|
| 410 | 6.22 | 0.094 | 4345 | 0.17 |
| 468 | 7.28 | 0.111 | 4133 | 0.22 |
| 564 | 8.42 | 0.126 | 4487 | 0.32 |
| 596 | 8.82 | 0.131 | 4566 | 0.36 |
| 680 | 9.86 | 0.144 | 4756 | 0.46 |
| 1032 | 13.78 | 0.186 | 5609 | 1.07 |
| 1089 | 14.36 | 0.190 | 5751 | 1.19 |
| 1313 | 16.18 | 0.200 | 6585 | 1.72 |
| 1500 | 17.36 | 0.202 | 7466 | 2.25 |
| 1712 | 18.63 | 0.202 | 8445 | 2.93 |
| 2064 | 20.15 | 0.195 | 10492 | 4.26 |
| 2180 | 20.49 | 0.193 | 11320 | 4.75 |
| 3300 | 22.81 | 0.159 | 20930 | 10.89 |
| 3768 | 23.43 | 0.147 | 25863 | 14.20 |
| 3980 | 23.66 | 0.141 | 28297 | 15.84 |
| 4800 | 23.98 | 0.122 | 40067 | 23.04 |
| 5480 | 24.40 | 0.109 | 50441 | 30.03 |
Graphical analysis:
(1.5 points): good graph
(0.5 point): correct value
a) Estimation of the uncertainty in the values of obtained in e) (0.25 point)
Estimation of the uncertainty in the values of obtained in f) (0.25 point)
Оригинал в Архива: exp1.pdf · официални решения: exp1_sol.pdf