APhO 2006, Експеримент — Задача 1. Experimental Problem
7th Asian Physics Olympiad — Experimental Problem · 20 т.
Условие
This experimental problem consists of two related parts.
Part 1
Measurement of the specific heat of aluminum in the C – C temperature range. (10 points)
In this part, you can use the following equipment ONLY:
- A plastic cup with a cap which has a hole for the thermometer;
- A digital thermometer with accuracy of 0.1C; The temperature of the sensor (10) is shown on the top display, and bottom display shows the temperature of the room. Do not press max/min button: pressing max/min button changes the readings between current, maximal and minimal values. If water temperature exceeds 70°C, the thermometer shows “H” denoting it is out of its range. WARNING: DO NOT USE THE THERMOMETER TO MEASURE THE TEMPERATURE OF LIQUID NITROGEN! THERMOMETER CAN BE USED ONLY IN PART 1.
- An aluminum cylinder with a hole;
- Electronic scales with accuracy of 1g; Make sure that the scales are situated on the flat surface. The button Tare/Zero serves as On/Off and sets the zero reading of the scales. Do not press any other buttons. Note: the scales automatically turn OFF after some time; you have to turn them ON back and reset the zero reading of the scales. Press the top of the scales approximately every 50 seconds in order to prevent automatic switch off of the scales.
- A digital timer; Pressing left button shifts the timer from Clock mode to Stopwatch mode. In Stopwatch mode the middle button serves as Stop/Start, and the right button serves as Reset.
- Dewar flask with hot water;
- A jar for the used water;
- Plotting (graphing) paper (2 pages);
- Pieces of thread.
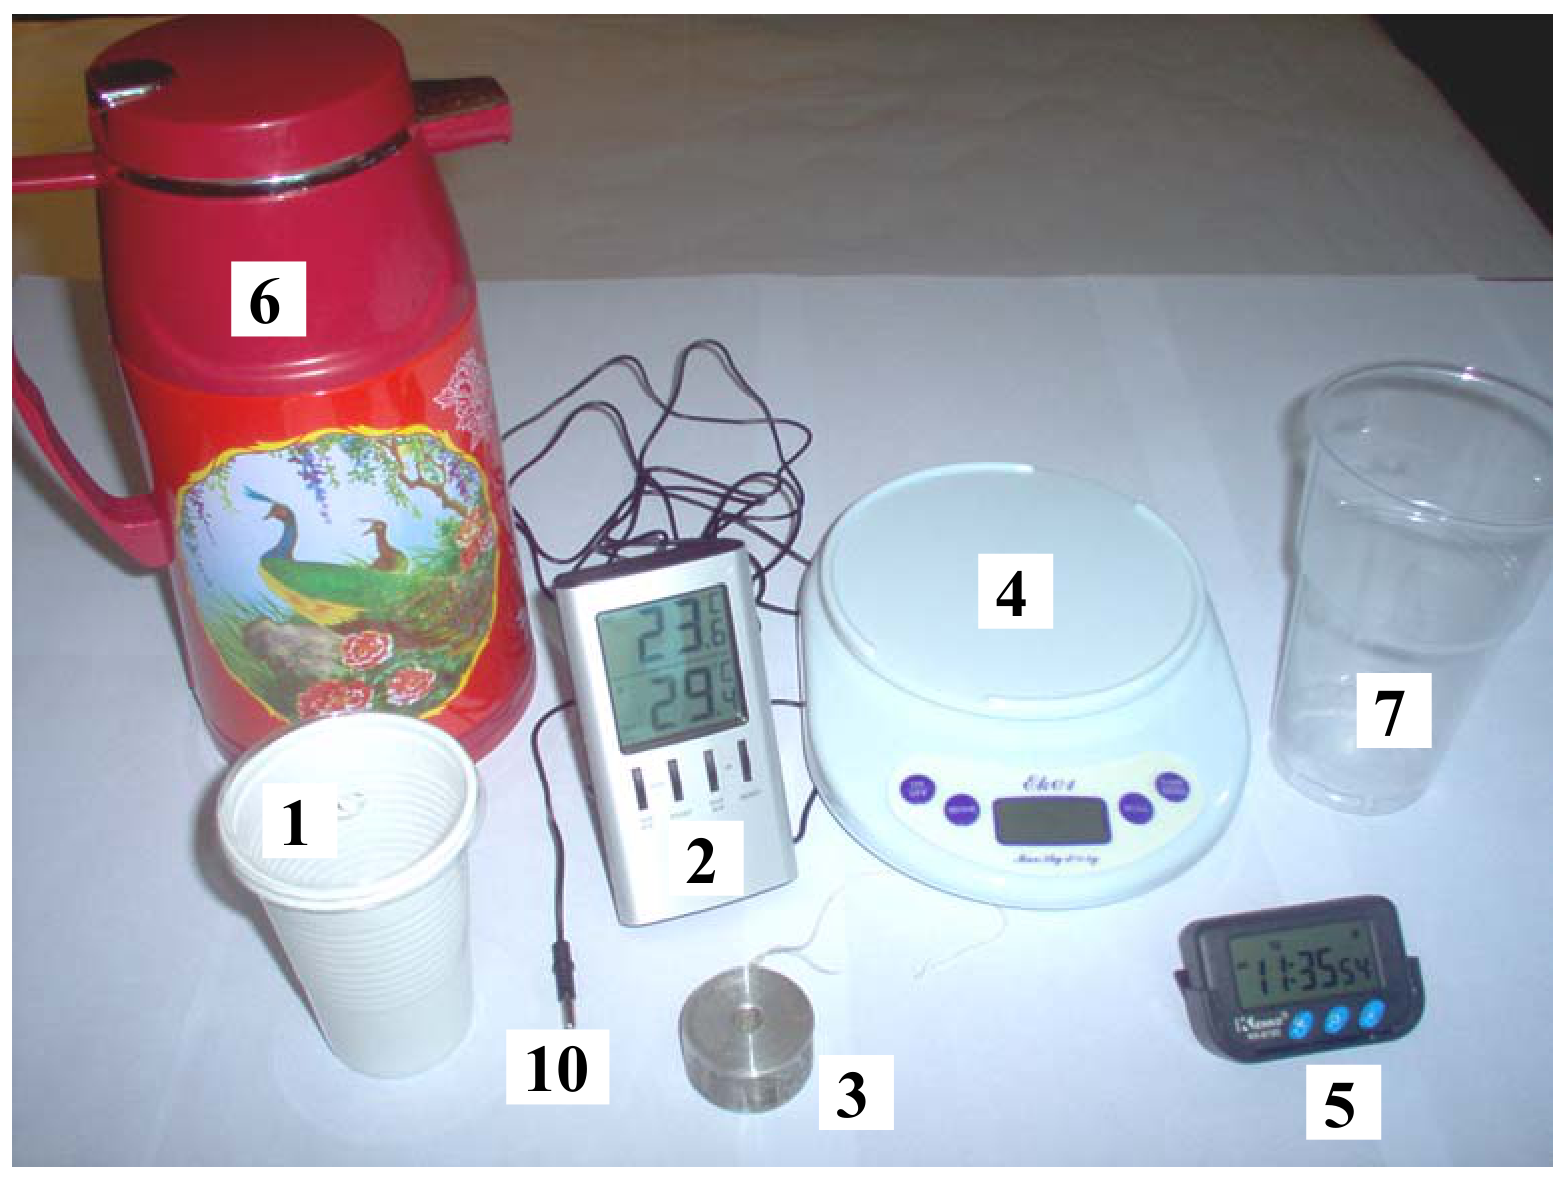
The results of the measurement of specific heat of aluminum will be used in Part 2 of the experimental problem.
The specific heat of aluminum should be determined from the comparison of two experimental curves:
- the cooling curve of hot water in a plastic cup without the aluminum cylinder (the first experiment);
- the cooling curve of hot water in a plastic cup with aluminum cylinder immersed (the second experiment);
The specific heat of water is given = 4.20kJ/(kg K).
Density of water .
Density of aluminum .
Warning: Be very careful with hot water. Remember that water at temperature T>50 C can cause burns. DO NOT USE LIQUID NITROGEN IN THIS PART!
The task
1a) [1 point] Derive theoretically an expression for aluminum specific heat in terms of experimentally measured quantities : mass of hot water in the first experiment, mass of hot water in the second experiment, mass of aluminum cylinder and the ratio of heat capacities , where is the heat capacity of water in the first experiment, is the combined heat capacity of water and aluminum cylinder in the second experiment.
In parts 1b) and 1c) you will perform measurements to determine K. Parts 1b) and 1c) should be performed with closed caps. Assume that in this case heat exchange of the contents of the cup with the environment depends linearly on the difference in their temperatures. The linearity coefficient depends only on the level of the water in the cup. Make sure that the aluminum cylinder is fully immersed into water in part 1c). You can neglect the heat capacity of the cup.
1b) [1.5 points] Perform the first experiment – investigate the relationship between the temperature of water and time in the range of temperatures from 45C to 65C. Provide a table of measurements. Write the value of on the answer sheet.
1c) [1.5 points] Perform the second experiment – investigate the relationship between the temperature of water with aluminum cylinder and time in the range of temperatures from 45C to 65C. Provide a table of measurements. Write the values of and on the answer sheet.
1d) [4 points] Use graphs to determine the ratio of the heat capacities and the uncertainty . Write the values of and on the answer sheet.
1e) [2 points] Determine the numerical value of and estimate the uncertainty of measurement . Write the values of and on the answer sheet.
Part 2
Measurement of the specific latent heat of evaporation of liquid nitrogen. (10 points)
In this part you can use the following equipment:
- A Styrofoam cup with a cap;
- Dewar flask with liquid nitrogen;
- An aluminum cylinder with a hole (item 3, Part 1);
- Electronic scales with accuracy of 1g (item 4, Part 1);
- A digital timer (item 5, Part 1);
- Plotting (graphing) paper (2 pages);
- Pieces of thread.
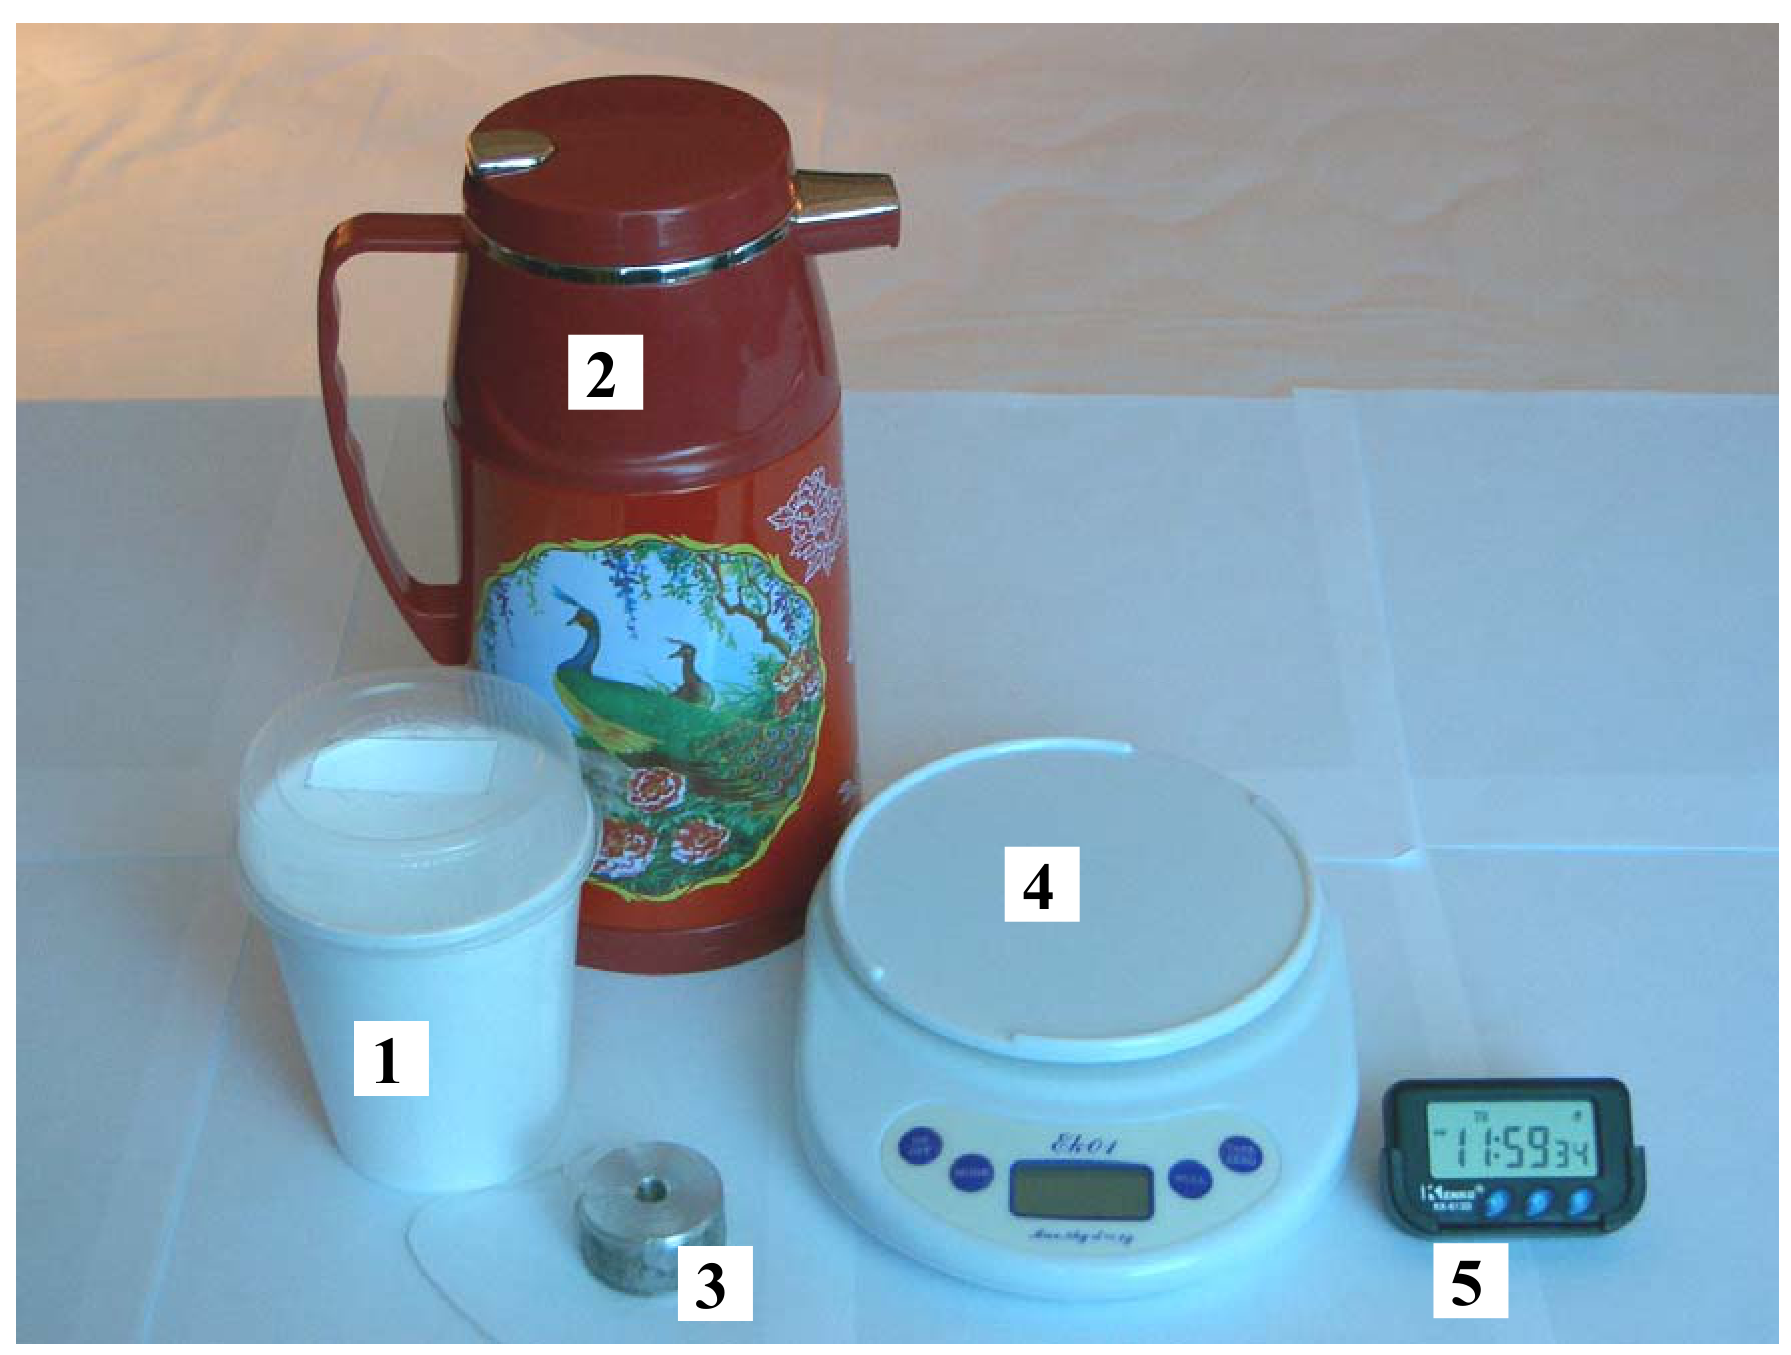
The specific latent heat of evaporation of water is well known, while rarely we have to deal with one the main atmospheric gases, nitrogen, in its liquid form. The boiling temperature of liquid nitrogen under normal atmospheric pressure is very low, .
In this experiment you are asked to measure the specific latent heat of evaporation of nitrogen. Because of heat exchange with the environment nitrogen in a Styrofoam cup evaporates and its mass decreases at some rate. When an aluminum cylinder initially at room temperature is immersed into nitrogen, nitrogen will boil violently until the temperature of the aluminum sample reaches the temperature of liquid nitrogen. The final brief ejection of some amount of vaporized nitrogen from the cup indicates that aluminum has stopped cooling-- this ejection is caused by the disappearance of the vapor layer between aluminum and nitrogen. After aluminum reaches the temperature of nitrogen, the evaporation of nitrogen will continue.
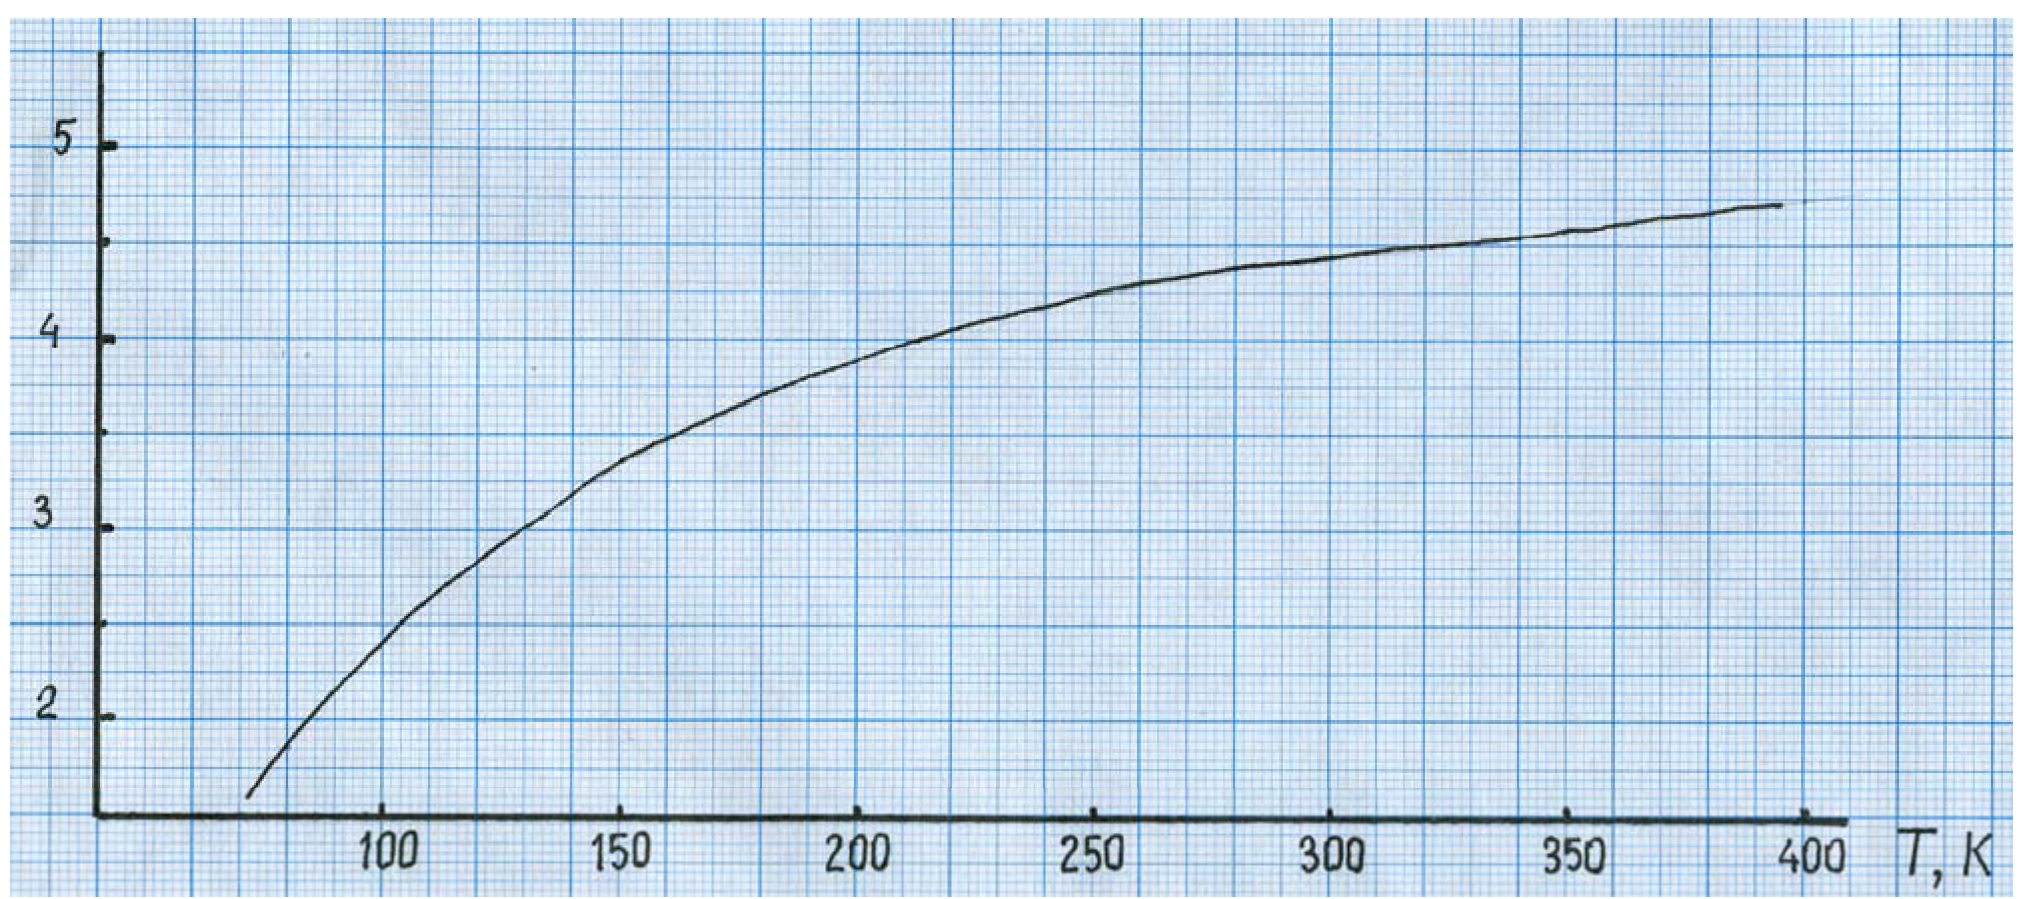
When considering a wide range of temperatures, one can observe that the specific heat of aluminum depends on absolute temperature. The graph of aluminum’s specific heat in arbitrary units versus temperature is shown in Fig. 1. Use the result of specific heat measurement in 45C-65C temperature range in Part 1 to normalize this curve in absolute units.
Warnings:
- Liquid nitrogen has temperature = - 196C. To prevent frostbite do not touch nitrogen or items which were in contact with nitrogen. Make sure to keep away your personal metal belongings such as jewelry, wrist watch, etc.
- Do not put any irrelevant items into nitrogen;
- Be careful while putting the aluminum cylinder into the liquid nitrogen to prevent spurts or spilling.
The task
2a) [3 points] Measure the evaporation rate of nitrogen in a Styrofoam cup with a closed cap, and measure the mass of nitrogen evaporated during the cooling of the aluminum cylinder (aluminum cylinder is loaded through a hole in the cup).
Proceed in the following manner. Set up the Styrofoam on the scales, pour about 250g of liquid nitrogen in it, wait about 5 minutes and then start taking measurements. After some amount of nitrogen evaporates, immerse the aluminum cylinder into the cup – this will result in a violent boiling. After aluminum cylinder cools down to the temperature of nitrogen, evaporation calms down. You should continue taking measurements in this regime for about 5 minutes until some additional amount of nitrogen evaporates. During the whole process record the readings of the scales as a function of time.
IN NO CASE SHOULD YOU TOUCH THE ALUMINUM CYLINDER AFTER IT WAS SUBMERGED INTO LIQUID NITROGEN.
In your report provide a table of and , where is the mass of the evaporated nitrogen.
2b) [1 point] Using the results of the measurements of in 2a), plot the graph of the mass of evaporated nitrogen versus time . The graph should illustrate all the three stages of the process– the calm periods before and after immersion of aluminum, and the violent boiling of nitrogen.
2c) [3.0 points] Determine from the graph the mass of nitrogen evaporated only due to heat exchange with the aluminum cylinder, as it is cooled down from room temperature to the temperature of liquid nitrogen. In order to do this you have to take into account the heat exchange with the environment through the cup before, during and after the cooling of aluminum. Write the value of and its uncertainty on the answer sheet.
2d) [0.5 points] Using the result of measurement of aluminum’s specific heat in the temperature range of 45C – 65C (Part 1), normalize the graph of the relationship between aluminum’s specific heat and temperature from arbitrary to absolute units. On the answer sheet write the value of the coefficient of conversion from arbitrary units to absolute units:
2e) [2.5 points] Using the results of measurement of the mass of nitrogen evaporated due to cooling of the aluminum cylinder and the normalized graph of the relationship between specific heat and temperature, determine nitrogen’s specific latent heat of evaporation . Write the value of and its uncertainty on the answer sheet.
Good Luck and Look Good!
Отговори
1a)
1d) 1.196
Value from the official solution's measurements: K = 1.196, ΔK = 0.026 (εK = 2%); an experimental result, not a unique answer.
1e) 0.9 kJ/(kg·K)
Value from the official solution's measurements: cAl = 0.90 kJ/(kg·K), ΔcAl = 0.18 kJ/(kg·K).
2c) 52.3 g
Value from the official solution's measurements: mN^Al = (52.3 ± 2.4) g.
2d) 0.2 kJ/(kg·K·arb.units)
Value from the official solution: β = 0,90/4,5 = 0,2 kJ/(kg·K·arb.units).
2e) 205 J/g
Value from the official solution: λ = 205 J/g, Δλ = 60 J/g. The solution prints Q = 69×155.5 = 10.73 kJ but then divides 10.3kJ by 52.3g; kept as printed.
Решение
Part 1
Measurement of the specific heat of aluminum in the C– C temperature range (10 points).
1a) [1.0 point] The heat capacity of water in the first experiment is
where = 4,2 kJ/(kg K) is the specific heat of water and is the mass of water in the experiment. The heat capacity of water with the aluminum cylinder immersed in it:
where is the mass of water in the experiment, is the specific heat of aluminum and is the mass of aluminum cylinder. The ratio of heat capacities is . Then, specific heat capacity of aluminum is determined by the formula
The ratio of heat capacities K can be determined from the experiment in 1b) and 1c). To be able to extract K from these two experiments, one should perform the measurements in the regime such that the level of water is the same for both experiments. This can be done by marking the level of the water on the side of the cup by usual pen, or by choosing the masses of water such that the equation
is closely satisfied. Since (1.3) have the difference in the numerator, best results are obtained when is chosen to be close to m.
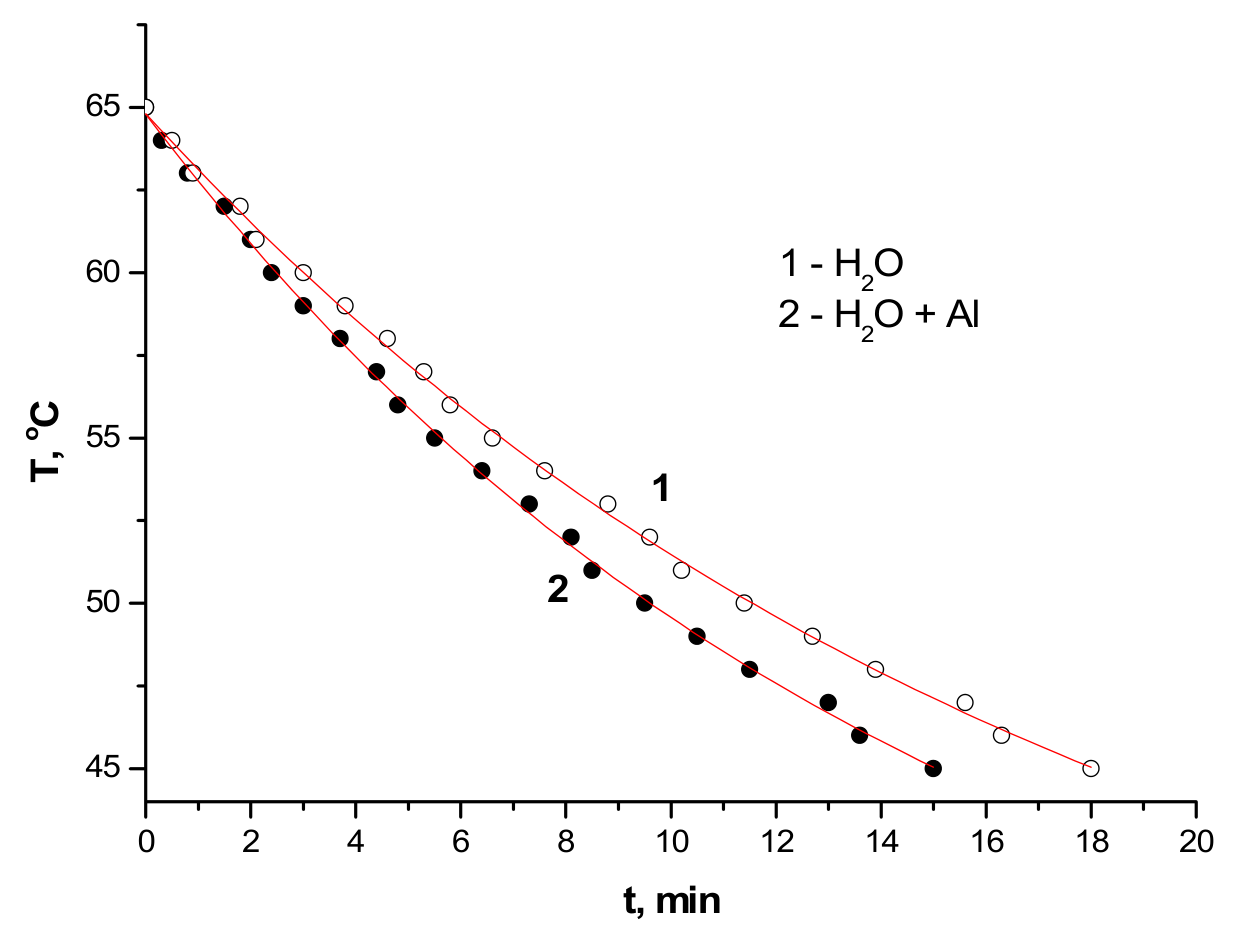
1b) [1.5 points] The following table shows the ,--the temperature of hot water as it cools down, as a function of time in the 45C - 65C temperature range:
| N | , C | t, min.sec | t, min | ln(-) |
|---|---|---|---|---|
| 1 | 65 | 0.00 | 0,0 | 3,72 |
| 2 | 64 | 0.27 | 0,5 | 3,69 |
| 3 | 63 | 0.56 | 0,9 | 3,67 |
| 4 | 62 | 1.49 | 1,8 | 3,64 |
| 5 | 61 | 2.08 | 2,1 | 3,62 |
| 6 | 60 | 3.02 | 3,0 | 3,59 |
| 7 | 59 | 3.48 | 3,8 | 3,56 |
| 8 | 58 | 4.34 | 4,6 | 3,53 |
| 9 | 57 | 5.20 | 5,3 | 3,51 |
| 10 | 56 | 5.48 | 5,8 | 3,47 |
| 11 | 55 | 6.33 | 6,6 | 3,44 |
| 12 | 54 | 7.37 | 7,6 | 3,41 |
| 13 | 53 | 8.50 | 8,8 | 3,38 |
| 14 | 52 | 9.37 | 9,6 | 3,34 |
| 15 | 51 | 10.13 | 10,2 | 3,31 |
| 16 | 50 | 11.26 | 11,4 | 3,27 |
| 17 | 49 | 12.39 | 12,7 | 3,23 |
| 18 | 48 | 13.52 | 13,9 | 3,19 |
| 19 | 47 | 15.33 | 15,6 | 3,15 |
| 20 | 46 | 16.17 | 16,3 | 3,11 |
| 21 | 45 | 18.00 | 18,0 | 3,06 |
The mass of water is = (50±1) g and the room temperature is =(23,4±0,2)C
1c) [1.5 points] The following table shows the temperature of hot water with aluminum cylinder immersed as the water cools down as a function of time in the 45C - 65C temperature range:
| N | , C | t, min.sec | t, min | ln(-) |
|---|---|---|---|---|
| 1 | 65 | 0.00 | 0,0 | 3,72 |
| 2 | 64 | 0.18 | 0,3 | 3,69 |
| 3 | 63 | 0.46 | 0,8 | 3,67 |
| 4 | 62 | 1.32 | 1,5 | 3,64 |
| 5 | 61 | 2.00 | 2,0 | 3,62 |
| 6 | 60 | 2.26 | 2,4 | 3,59 |
| 7 | 59 | 3.03 | 3,0 | 3,56 |
| 8 | 58 | 3.39 | 3,7 | 3,53 |
| 9 | 57 | 4.25 | 4,4 | 3,51 |
| 10 | 56 | 4.45 | 4,8 | 3,47 |
| 11 | 55 | 5.29 | 5,5 | 3,44 |
| 12 | 54 | 6.24 | 6,4 | 3,41 |
| 13 | 53 | 7.19 | 7,3 | 3,38 |
| 14 | 52 | 8.05 | 8,1 | 3,34 |
| 15 | 51 | 8.33 | 8,5 | 3,31 |
| 16 | 50 | 9.27 | 9,5 | 3,27 |
| 17 | 49 | 10.31 | 10,5 | 3,23 |
| 18 | 48 | 11.35 | 11,5 | 3,19 |
| 19 | 47 | 12.58 | 13,0 | 3,15 |
| 20 | 46 | 13.35 | 13,6 | 3,11 |
| 21 | 45 | 14.57 | 15,0 | 3,06 |
The mass of aluminum cylinder is m = (69±1) g, the mass of water is = (27±1) g, and the room temperature is = (23,4±0,2)C )
The graphs and are shown below:
1d) [4.0 points] Water in the first experiment and water with aluminum cylinder immersed in the second experiment cool down because of heat exchange with the air in the room according to the following linear law:
where is a constant and C is heat capacity ( or ). If we integrate the expression (1.4) , we get
where ( is the initial temperature of water in the experiment from the experimental data).
Various methods can be used to obtain the ratio of heat capacities but the most precise result can be obtained from the following linear relation:
The graphs and appear to be approximately linear and are shown below:
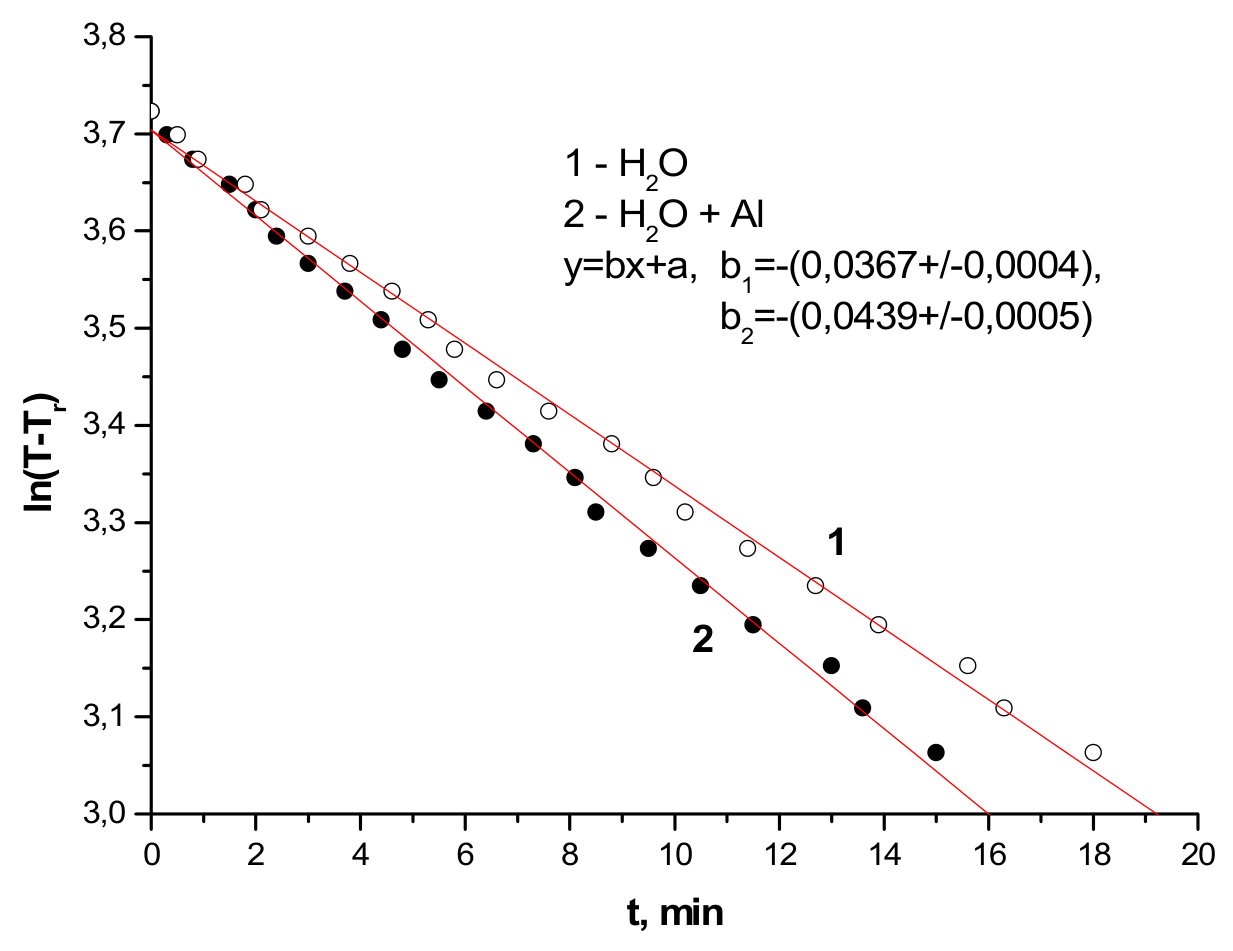
We can obtain the ratio by comparing the slopes of the graphs derived from the first and second experiments. The value of K obtained in terms of the slopes of the two linear relationships is as follows:
And the uncertainty is:
1e) [2.0 points] At the specific heat of aluminum obtained from formula (1.3) is:
And the uncertainty is:
Part 2
Measurement of the specific latent heat of evaporation of the liquid nitrogen
2a) [3.0 points] Below is the table showing the the mass of evaporated nitrogen versus time:
| N | M, gr | t, min.sec | t, min | , gr |
|---|---|---|---|---|
| 1 | 250 | 0.0 | 0 | 0 |
| 2 | 248 | 0.19 | 0,3 | 2 |
| 3 | 246 | 0.39 | 0,6 | 4 |
| 4 | 244 | 0.59 | 1 | 6 |
| 5 | 242 | 1.19 | 1,3 | 8 |
| 6 | 240 | 1.38 | 1,6 | 10 |
| 7 | 238 | 2.00 | 2 | 12 |
| 8 | 236 | 2.19 | 2,3 | 14 |
| 9 | 234 | 2.41 | 2,7 | 16 |
| 10 | 232 | 3.02 | 3 | 18 |
| 11 | 230 | 3.22 | 3,4 | 20 |
| 12 | 228 | 3.44 | 3,7 | 22 |
| 13 | 226 | 4.06 | 4,1 | 24 |
| 14 | 224 | 4.28 | 4,5 | 26 |
| 15 | 222 | 4.50 | 4,8 | 28 |
| 16 | 220 | 5.13 | 5,2 | 30 |
| 17 | 274 | 5.52 | 5,9 | 45 |
| 18 | 269 | 6.00 | 6 | 50 |
| 19 | 264 | 6.07 | 6,1 | 55 |
| 20 | 259 | 6.18 | 6,3 | 60 |
| 21 | 254 | 6.30 | 6,5 | 65 |
| 22 | 249 | 6.41 | 6,7 | 70 |
| 23 | 244 | 6.54 | 6,9 | 75 |
| 24 | 239 | 7.09 | 7,1 | 80 |
| 25 | 234 | 7.25 | 7,4 | 85 |
| 26 | 229 | 7.40 | 7,7 | 90 |
| 27 | 224 | 7.48 | 7,8 | 95 |
| 28 | 222 | 8.06 | 8,1 | 97 |
| 29 | 219 | 8.49 | 8,8 | 100 |
| 30 | 217 | 9.16 | 9,3 | 102 |
| 31 | 215 | 9.44 | 9,7 | 104 |
| 32 | 213 | 10.14 | 10,2 | 106 |
| 33 | 211 | 10.44 | 10,7 | 108 |
| 34 | 209 | 11.14 | 11,2 | 110 |
| 35 | 207 | 11.45 | 11,7 | 112 |
| 36 | 205 | 12.13 | 12,2 | 114 |
| 37 | 203 | 12.43 | 12,7 | 116 |
| 38 | 201 | 13.14 | 13,2 | 118 |
| 39 | 199 | 13.46 | 13,7 | 120 |
| 40 | 197 | 14.16 | 14,3 | 122 |
| 41 | 195 | 14.50 | 14,8 | 124 |
2b) [1 point] Below is the graph of the mass of evaporated nitrogen versus time (all the three stages of the experiment are shown):
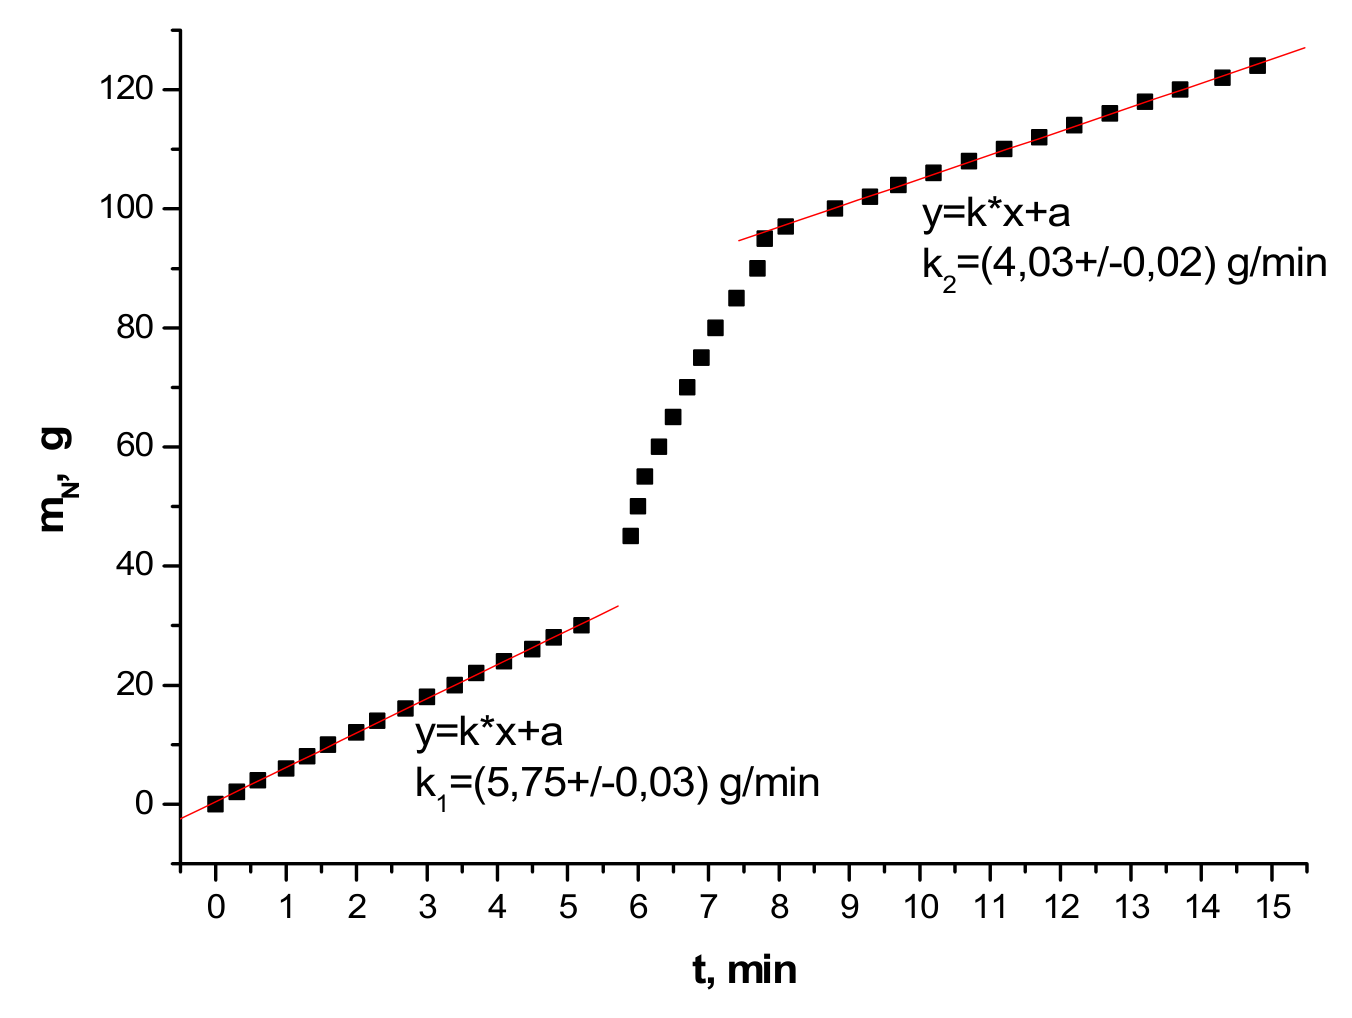
2c) [3.0 points] Applying the ordinary least squares method to graph 2b), we can determine nitrogen’s evaporation rates and , before the immersion of aluminum and after violent boiling, respectively. Nitrogen’s evaporation rate before the immersion of aluminum is:
And the evaporation rate after violent boiling ends is:
It is obvious from these rates that evaporation rate depends on the amount of nitrogen in the cup. Therefore the evaporation rate during violent boiling due to heat exchange with the environment can be estimated as the average of the evaporation rate before and after violent boiling:
To determine the mass consider the time period from to . is set by the moment of immersion, is determined as described in the introduction, or by analyzing the dependence. Then
It should be noted that any other mean, for instance geometric mean, can be used as an estimate of nitrogen’s average evaporation rate due to heat exchange with the environment. The difference between the arithmetic mean and geometric mean will be used as an estimate of the error of average evaporation rate: .
The uncertainty is
Then
2d) [0.5 points] In the 45C – 65C temperature range the specific heat of aluminum is approximately constant and equal to the measurement performed in Part 1:
In this temperature range, the value of specific heat in arbitrary units is
Consequently the coefficient of conversion of specific heat from arbitrary units to absolute units, , is
2e) [2.5 points] The amount of heat transferred from the aluminum cylinder to the liquid nitrogen as the cylinder is cooled down to the temperature , is equal to
The value of this integral can be found using numerical integration. It can be approximated as the area under the curve. In our experiment, the number of cells under the curve is and each cell represents 0.5 J/(g·K), then
Then the amount of heat released is
Q = 69×155.5 = 10.73 kJ.
The value of specific latent heat of nitrogen’s evaporation can be found from the heat balance equation,
Thus we finally get
Marking Scheme
Part 1
| No | Total Pt | Partial Pt | Contents |
|---|---|---|---|
| 1a) | 1.0 | 1.0 | Expression for |
| 1b) | 1.5 | 1.0 | Experimental data, at least 8 points in the specified range. If less than 8 points are present, (0.1*Number of used points) is given. |
| 0.3 | Correct units of measurements | ||
| 0.2 | Estimation of errors | ||
| 1c) | 1.5 | 1.0 | Experimental data, at least 8 points in the specified range. If less than 8 points are present, (0.1*Number of used points) is given. |
| 0.3 | Correct units of measurements | ||
| 0.2 | Estimation of errors | ||
| 1d) | 4.0 | 1.0 | Correct choice of masses to satisfy within 10% accuracy. |
| 1.0 | Some method to determine K with theoretical formulas | ||
| 1.0 | Usage of proper coordinates to do a linear fit | ||
| 0.5 | Determination of K. | ||
| 0.3 | Correct units of measurements | ||
| 0.2 | Estimation of errors | ||
| 1e) | 2.0 | 1.5 | Final result for within 20% of the correct value. If within 30%, 1.0points. If within 50%, 0.5 points. |
| 0.5 | Estimation of |
Part 2
| No | Total Pt | Partial Pt | Contents |
|---|---|---|---|
| 2a) | 3.0 | 2.0 | Raw data . At least 5 points in 1 and 3 regimes, and at least 3 points during 2 regime |
| 0.5 | Correct conversion to | ||
| 0.3 | Correct units of measurements | ||
| 0.2 | Estimation of errors | ||
| 2b) | 1.0 | 0.8 | plot with all three periods shown. |
| 0.2 | Correct units of measurements | ||
| 2c) | 3.0 | 0.5 | Determination of and . |
| 0.5 | and consistent with the graph . | ||
| 0.8 | Subtraction of heat losses to environment to determine | ||
| 1.0 | within 10% of the correct value | ||
| 0.2 | Estimation of errors | ||
| d) | 0.5 | 0.5 | The value of consistent with the Part 1. |
| e) | 2.5 | 1.0 | Determination of Q from numerical integration |
| 0.5 | Equation of heat balance | ||
| 0.8 | Final value of with within 10% of the correct value | ||
| 0.2 | Estimation of |
Оригинал в Архива: exp.pdf · официални решения: exp_sol.pdf