APhO 2008, Експеримент — Задача 1. THE PHYSICS OF SOUND WAVE
EXPERIMENTAL COMPETITION — Problems and tasks — 9th Asian Physics Olympiad — Ulaanbaatar, Mongolia (April 24, 2008 ) · 24 април 2008 г. · 20 т.
Условие
Our environment is filled with sound and sound effects. This experimental problem related to the ultrasonic and sonic effects and consists of four parts. In part 1 the characteristics of the ultrasonic microphone system should be acquired. Afterwards we will observe and explain interference phenomena, then will study the Doppler Effect, and finally will determine the threshold of human hearing and resolving power.
List of Apparatus and materials
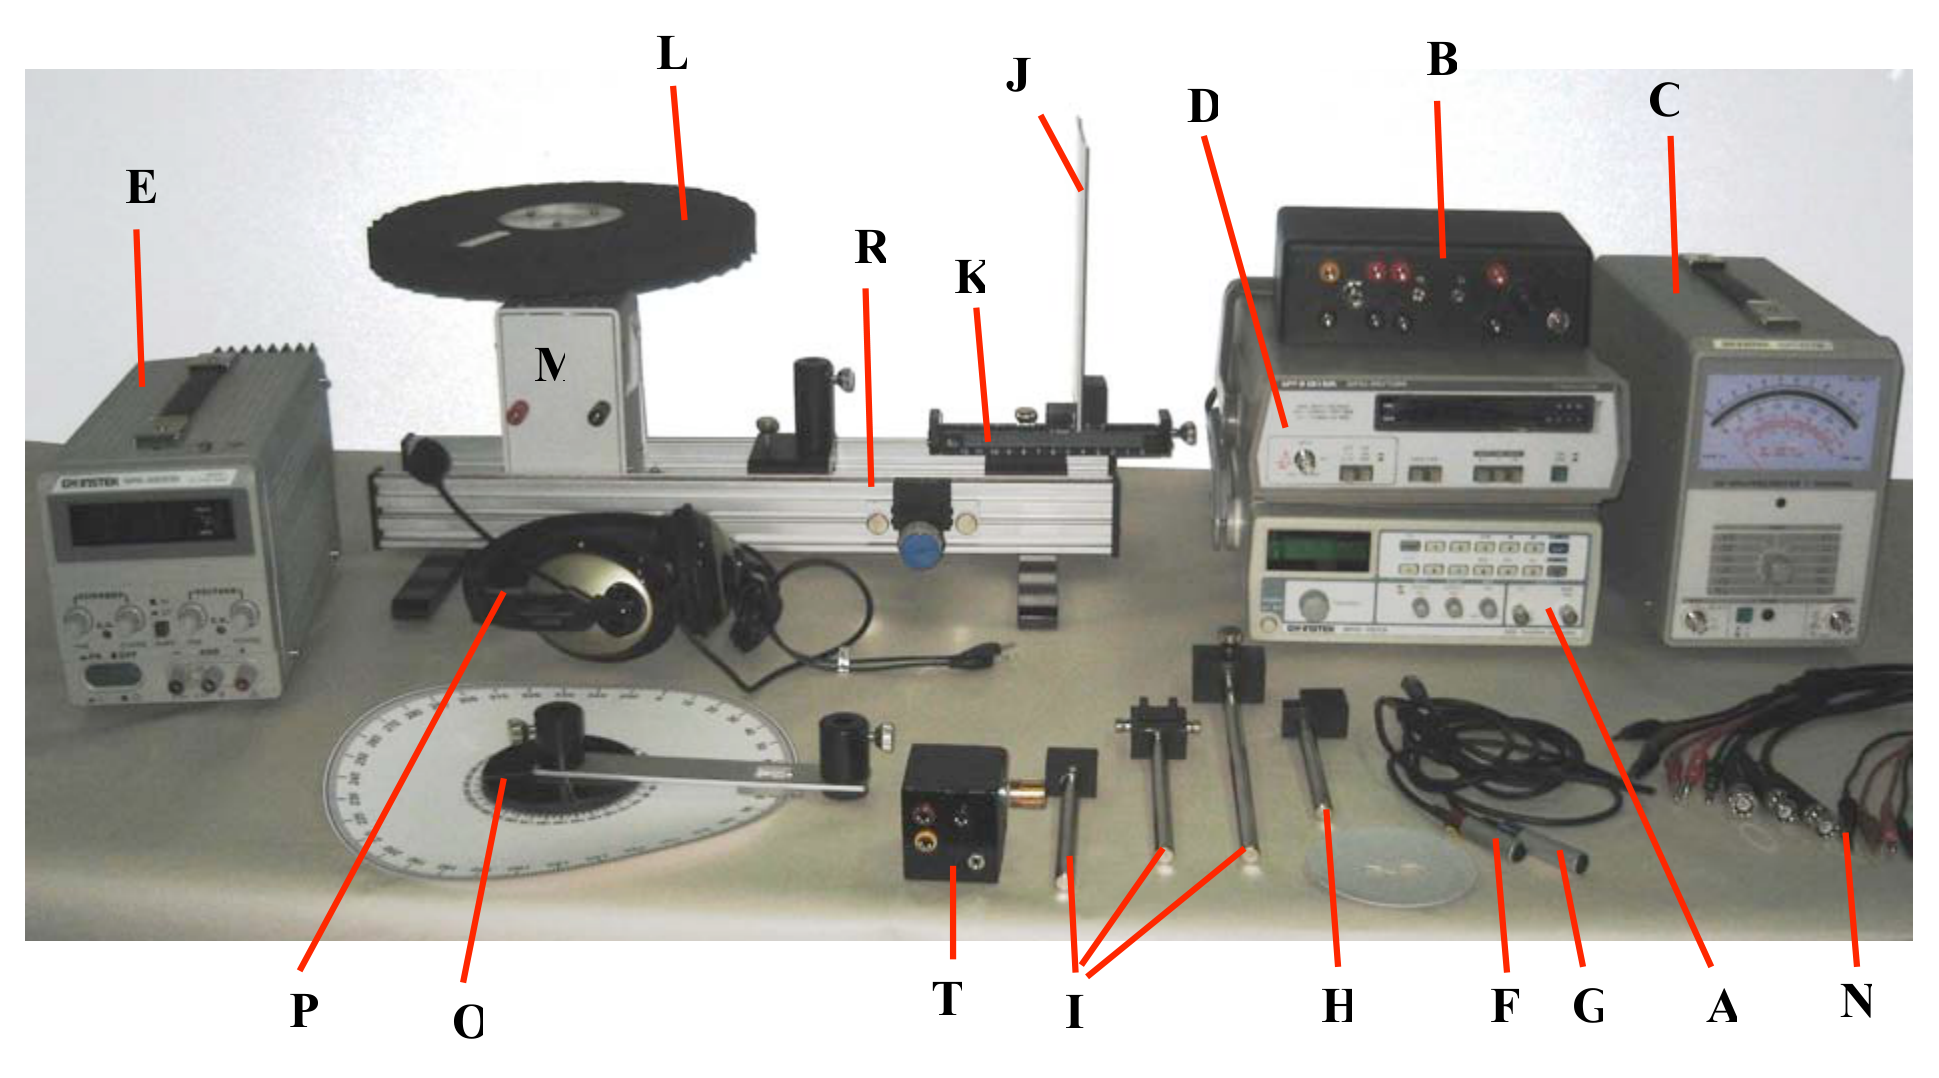
| label | Component | Q’ty | label | Component | Q’ty |
|---|---|---|---|---|---|
| A | Function Generator | 1 | K | Mirror magnetic holder with ruler | 1 |
| B | Ultrasonic Amplifier | 1 | L | Rotating disc | |
| C | AC Millivoltmeter | 1 | M | A motor attached to the optical bench | 1 |
| D | Frequency counter | 1 | N | Connection coaxial cables | 4 |
| E | variable DC Power Supply | 1 | O | Rotating holder with angle meter | 1 |
| F | Ultrasonic transducer for Source (Red labeled) | 1 | P | Stereo Headphones | 1 |
| G | Ultrasonic microphone for Detector ( Blue labeled) | 1 | R | Optical bench | 1 |
| H | Source holder | 1 | T | Variable resistor (rheostat) | 1 |
| I | Detector holders | 1 | Ruler | ||
| J | Metal mirror/ Reflector | 1 |
1. Instructions for Synthesized Function Generator (Item A)
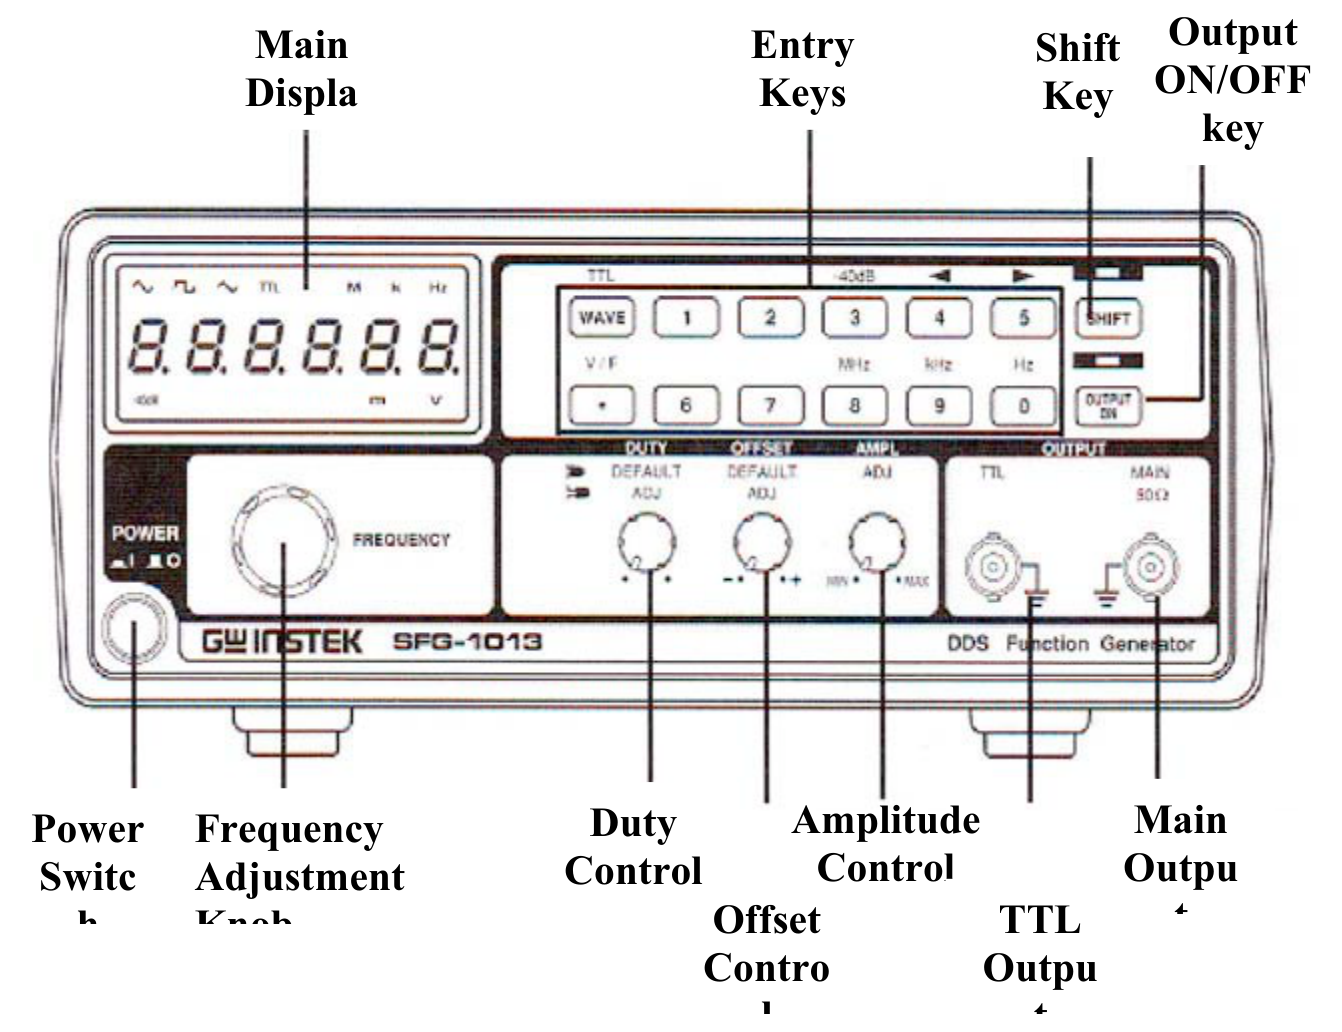
- The power button may be pressed for “ON” and pressed again for “OFF”.
- Select the frequency range and use proper button: to move the cursor in the main display (frequency editing point) use key “4” or “5” after pressing SHIFT key; to specify the frequency unit use key “9” for kHz with SHIFT key.
- The frequency will be displayed in the main display. To see voltage of the signal produced by the generator, use V/F button with SHIFT key.
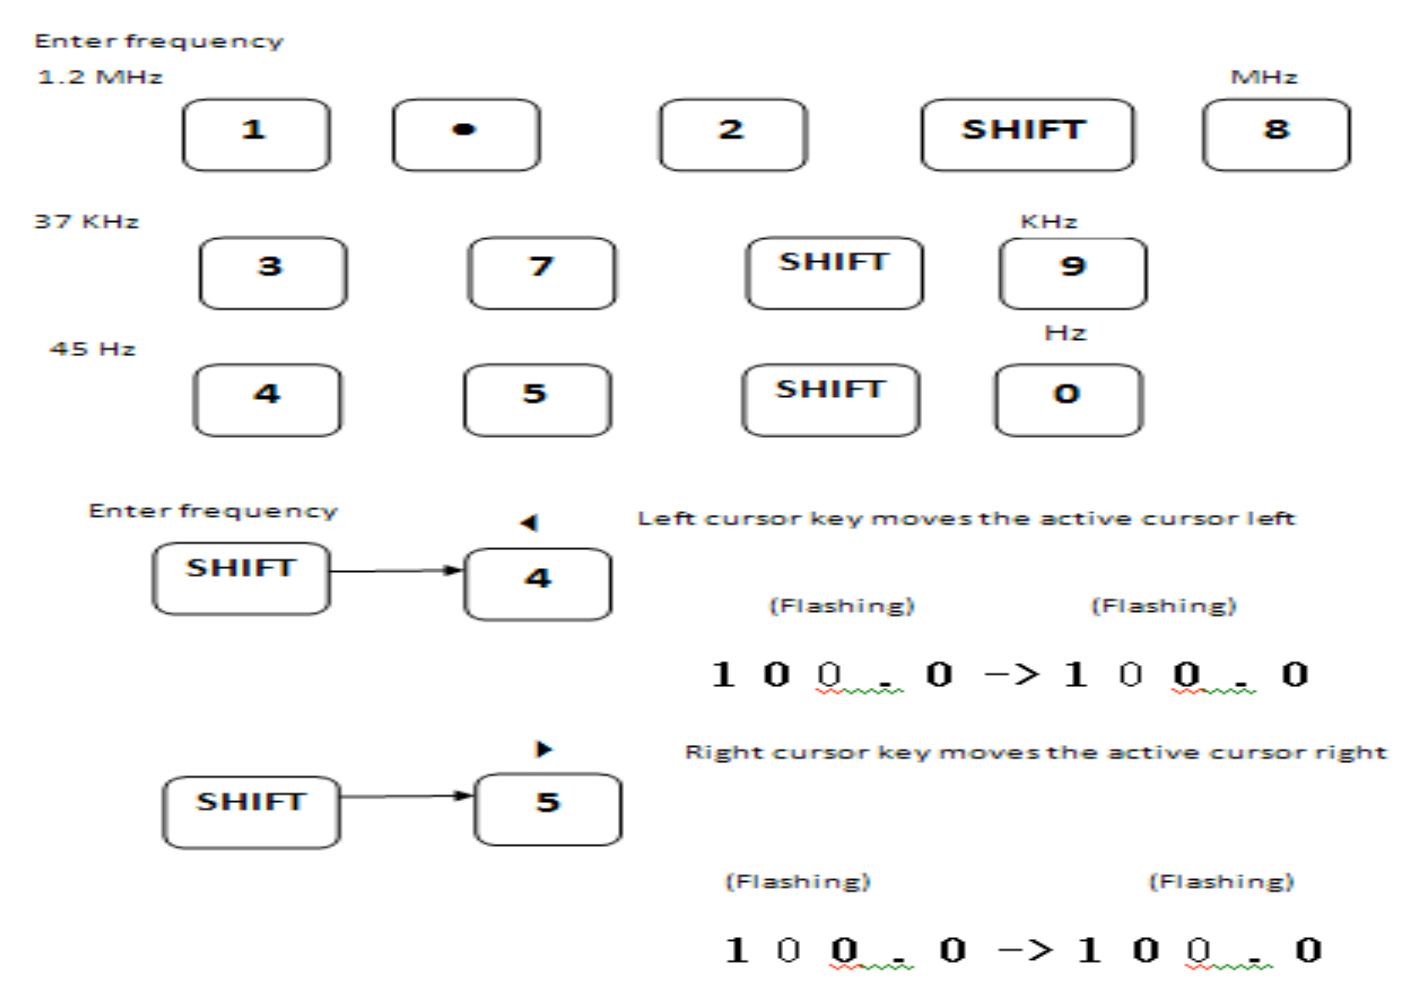
- Use the frequency adjustment knob to tune proper frequency.
- To change the amplitude of the signal, you can use amplitude control knob.
- You should switch on “Output control ON/OFF key”, otherwise the generator will not send the signal to the microphone.
- Do not use the “Duty control” in sine wave situation.
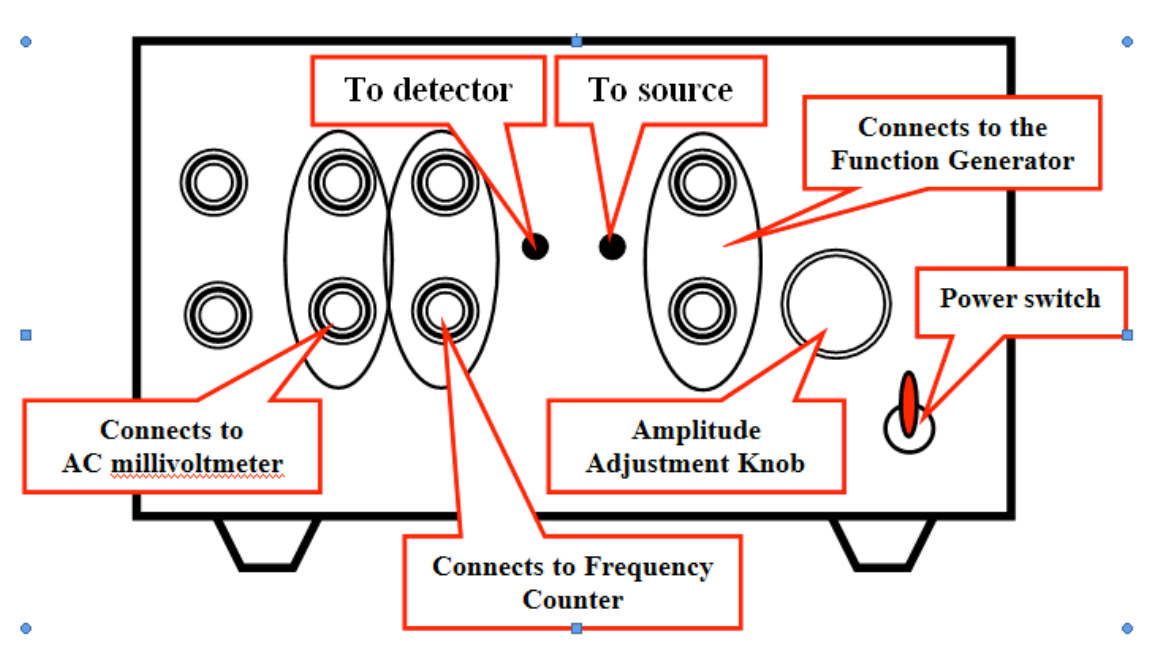
2. Amplifier Adaptor (item B)
The amplifier itself does not do anything, it serves merely as an adaptor for connecting plugs which otherwise would not match.
3. AC Millivoltmeter (Item C)
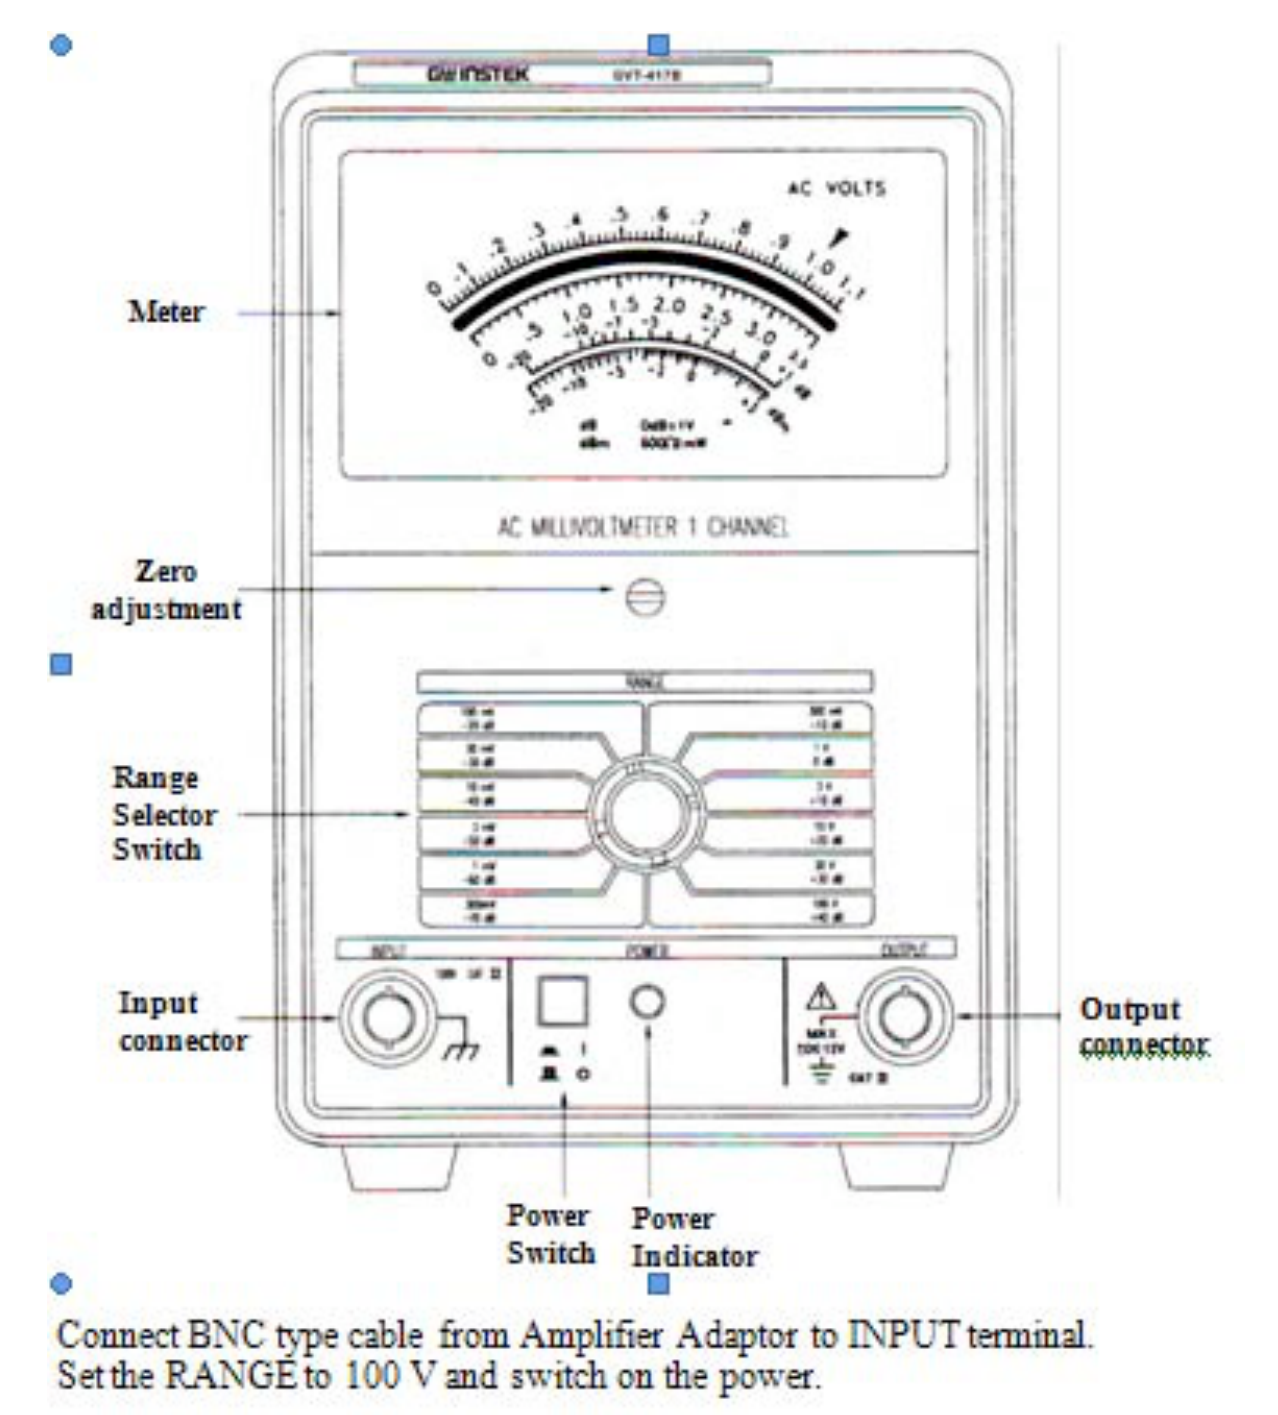
- Connect BNC type cable from Amplifier Adaptor to INPUT terminal.
- Set the RANGE to 100 V and switch on the power.
- Alter the RANGE selector switch until the pointer is at a position which located at of the full scale, the reading can be taken easily. The number written in the selector switch indicates the maximum measurable value in that range.
4. Frequency counter (Item D)
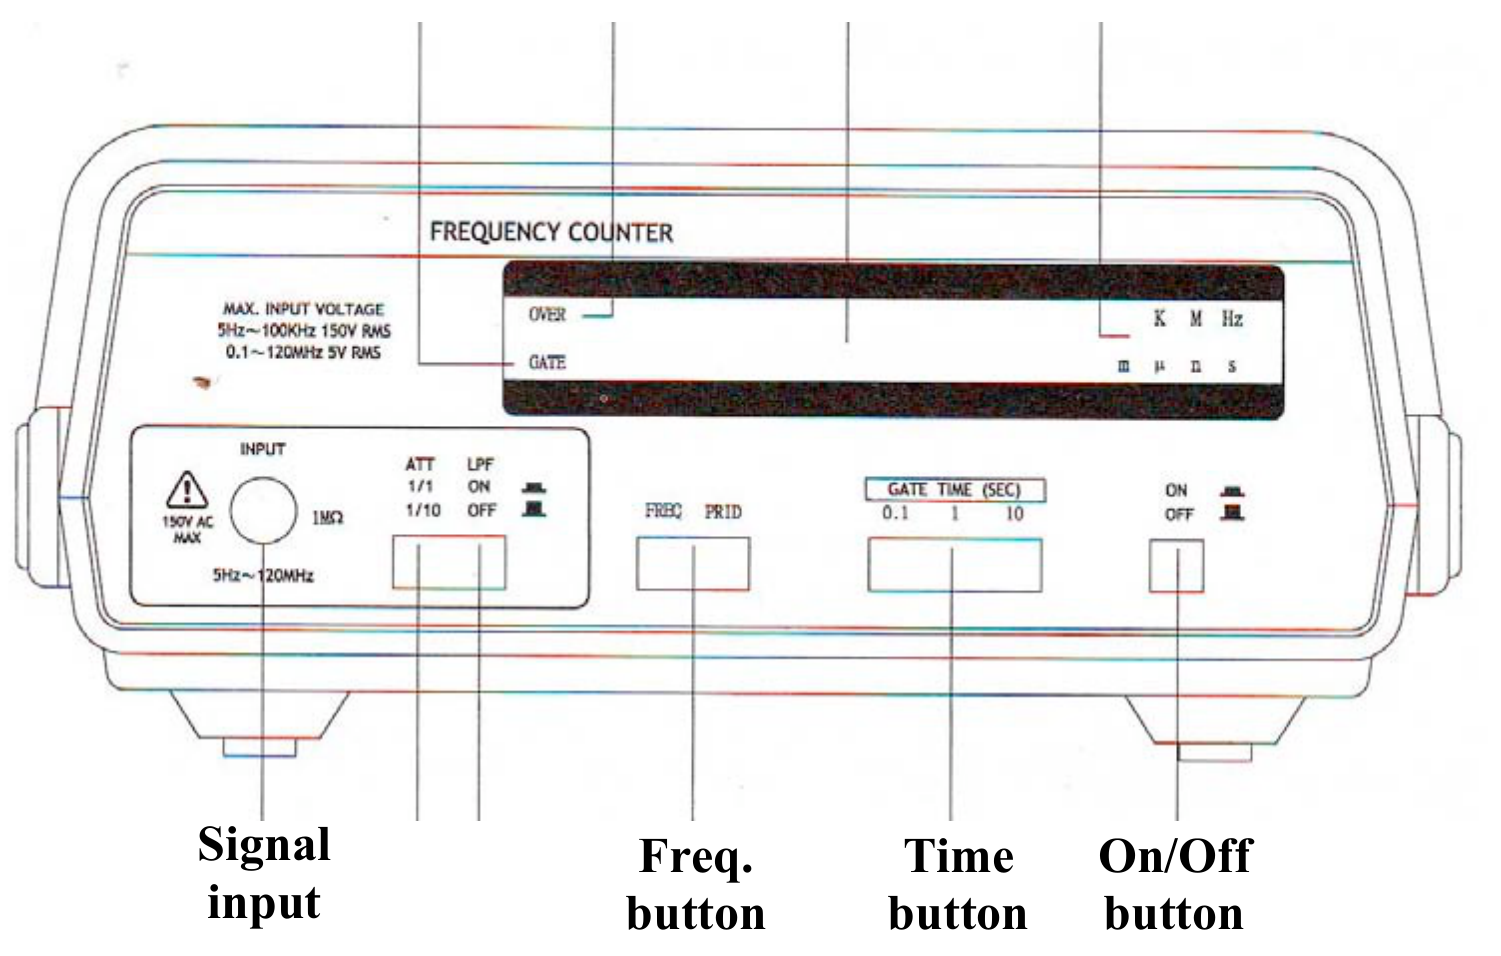
- Connect the Signal cable to the “Signal input” connector
- Turn ON the frequency counter
- Press “Freq. button” and “Time button”
Frequency counter will be ready for measurement.
Caution: Be sure switch off the power of equipments before plug in/out all connections, otherwise damage of equipments or sensors will be occurred.
PART 1. Characteristics of the microphone system (3 т.)
Introduction
The property, called piezoelectricity, provides a convenient coupling between mechanical oscillations of crystal, which occur at a very sharply defined frequency, and the electrical properties of a circuit of which the crystal is a part. Piezoelectric materials are used to convert electric and sound signals into each other. But they are distinguished by having a well specified working frequency range. Therefore, in this experimental part, we have to determine physical properties of the microphone which is made of piezoelectric material, before using it.
List of components
| 1. | Function Generator (FG) | 5. | Ultrasonic transducer for Source (S) with holder |
|---|---|---|---|
| 2. | Ultrasonic Amplifier | 6. | Ultrasonic microphone for Detector (D) with holder |
| 3. | AC Millivoltmeter (MV) | 7. | Two connection coaxial cables |
| 4. | Rotating holder with angle meter | 8. | Calculator |
Experiments and procedures
We will use two ultrasonic microphones, one of them will be used as signal source (red labeled) and the other will be used as a signal receiver (blue labeled). The source receives the signal from the function generator (FG) through the amplifier and converts the signal into a sound wave. The signal receiver (it can be called as detector) that connected to a preamplifier, receives the sound wave emitted from the source, and converts it to electrical signal. The voltage of the output signal will be measured by AC Millivoltmeter.
Hints: The voltage of the signal given to the source (S) should be adjusted around 1V. If it is more than this the ultrasonic wave will be saturated and it will affect your result.
The microphones are placed in the rotating holder and connected to an electrical cycle with ultrasonic amplifier scheme. The distance between the source and the detector should not be changed during the experiment. And please, make sure that the microphones are placed parallel to holder base and the axes of the microphones are laid on the same line.
1a. By changing the frequency of the signal from the FG, measure the voltage of the output signal that converted by the detector. Measure in the range of input frequency from 30 kHz to 50 kHz, and make sure the frequency range of the signal sent to the source in a given range. Otherwise, the microphone will be damaged or out of order. Set the voltage of the signal from the FG around 1V. Measured data will be filled into table 1A. Plot the graph using measured data. Plot a measured rms signal voltage vs. frequency, determine the cut-off frequencies , where the measured rms signal voltage drops ) of the maximum measured value. Hence, determine the bandwidth . Determine the working frequency (at which the voltage of the signal from the detector will be at maximum) from the obtained results. [1,5 т.]
1b. Set the frequency from the FG to the working frequency. Determine the angular dependence of the intensity of the output signal on the position of the detector relative to the source. Write the measured data in a Table 1B. Plot a graph of the dependence of the voltage ratio on an angle , where and are voltages of the output signal at an angle and 0°, respectively. The direction has maximal detection, and is called the axis of the source. Find angular values at which the voltage of the detected signal decreases 2 and 3 times. [1,5 т.]
PART 2. Interference of Waves (6 т.)
Introduction
A standing wave pattern is a vibrational pattern created within a medium when the reflected waves from mirror to interfere with incident waves from the source. The waves are interfering in such a manner that there are points of no displacement produced at the same positions along the medium. These points along the medium are known as nodes. There are other points along the medium which undergo vibrations between a large positive and large negative displacement. These points are known as antinodes.
List of components
| 1. | Function Generator (A) | 6. | Metal mirror (J) and magnetic holder with ruler (K) |
|---|---|---|---|
| 2. | Ultrasonic Amplifier (B) | 7. | Optical bench (R) |
| 3. | AC Millivoltmeter (C) | 8. | Two connection coaxial cables (N) |
| 4. | Ultrasonic transducer for Source (F) with holder (H) | 9. | Calculator (X) |
| 5. | Ultrasonic microphone for Detector (G) with holder (I) |
Description of the Experiments
2a. Study of the Wave Interference
Using the instruments 1-8 shown in the above list, assemble the experimental set up shown in Fig. 2.1 and study the interference of the wave. To reduce possible undesirable interference be cautious and place other instruments away from detector. Connect the functional generator to the Source and set the frequency at 40kHz.
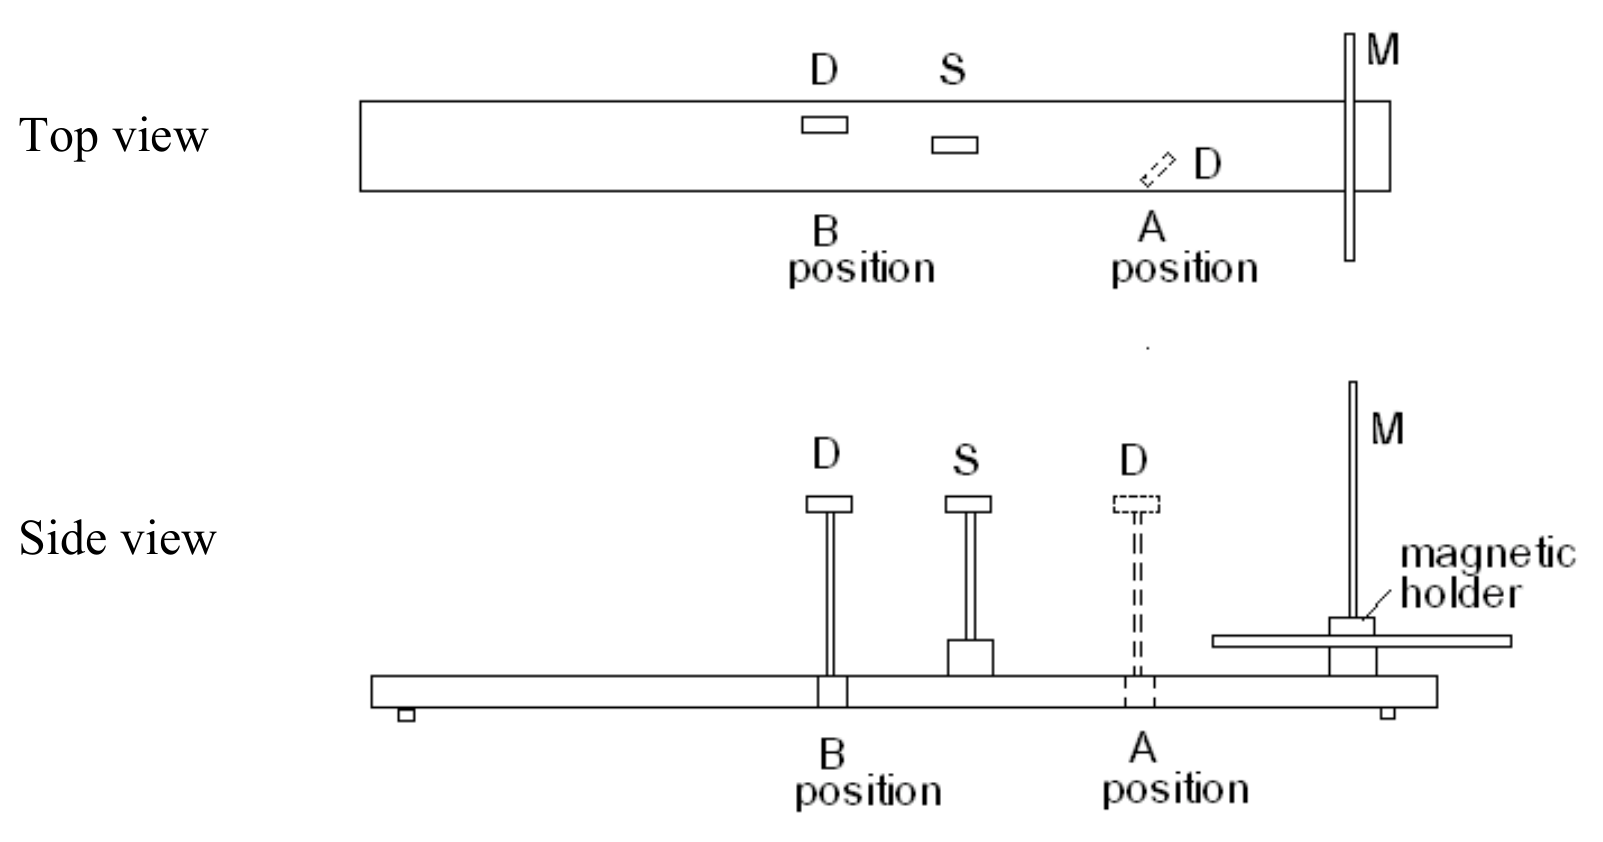
2a.1. Place the detector in Position A which is shown in Figure 2.1 and observe the dependence of the detected signal level on the positions of S, M and D. When the detector is too close to the source there will occur unclear effects, therefore do not measure in close distance to the source. Remember the detector has angular sensitivity. The detector should be placed for optimum measurement.
2a.2. Place the detector in Position B which is shown in Figure 2.1 and observe the dependence of the detected signal level on the positions of M and D. The position of S should be fixed.
2a.3. Measurement of Wavelength.
As you did in the experiment 2a.1 fixing the positions of S and D and by moving M, experimentally determine the wavelength λ of the ultrasonic wave. [1,6 т.]
2b. Find experimentally the correct answers to the following statements.
Write down “√” for correct answers or “X” for incorrect answers below the label of the chosen statements in your Answer sheet.
a. The standing wave will be observed between the S and M (Fig. 2.1). This standing wave will occur for any values of the distance between S and M.
b. The standing wave will be observed between the S and M. This standing wave will occur only when the distance between S and M equal to nλ/2. Where n is integer.
c. In the both positions A and B the detector will detect nodes and antinodes of the standing waves. It can be proved by moving the positions of S and M.
d. The standing wave will occur for any values of the distance between S and M. It can be observed experimentally by moving the position of D. In position B detector will detect the high level of signal when the distance between S and M is SM=nλ/4. Where n is odd integer.
e. The positions of the nodes and antinodes are immovable with respect to the lab frame (bench) when the S and M are moved.
f. When the distance between S and M increased the level of the reflected wave in position B will be periodic with decreasing amplitude.
g. The standing wave will occur only between S and M, but behind the Source the reflected waves will be observed. [2,8 т.]
2c. Study of the Standing Wave
In position B if the M is moved detector will detect the maximum minimum values of signal level. In these cases identify either node or antinode occurred on the surface of the Mirror and Source. If you identify the node write down “N” and if you identify antinode write down “A” in the table.
| Condition | On the surface of Mirror | On the surface of Source |
|---|---|---|
| When D detects maximum | ||
| When D detects minimum |
[1,6 т.]
PART 3. The Doppler effect (8 т.)
The observed and measured frequency of a signal changes by virtue of relative motion between the source and the observer. This is known as the Doppler effect.
The observed frequency is given by the formulas
where
frequency of the wave emitted by the Source
speed of sound in air
velocity of the Detector
velocity of the Source
List of components
| 1. | Function Generator (FG) | 7. | Motor |
|---|---|---|---|
| 2. | Ultrasonic Amplifier | 8. | Rotating disc |
| 3. | AC Millivoltmeter (MV) | 9. | DC Power Supply |
| 4. | Frequency counter (FC) | 10. | Optical bench |
| 5. | Ultrasonic transducer for Source (S) with holder | 11. | Connection coaxial cables |
| 6. | Ultrasonic microphone for Detector (D) with holder |
Description of the Experiment
The source (S) is placed so that the ultrasound strikes the tilts of the rotating disc from the side, and the Detector is placed so that reflected ultrasound is detected more effectively. The source is connected to the output of the Function Generator, and the Detector is to the millivoltmeter to measure which will detect the sound intensity level, as explained in Part 1. Before beginning the experiment, you should check changes in the sound intensity level by moving the disk forward and back manually. If changes in the sound intensity level are small then you should adjust the position of the sound source and the receiver properly. If the apparatus is not adjusted properly there may occur an error in the measurements of the sound intensity level and frequency.
- Switch on the motor of the rotating disk
- Observe the changes in the sound frequency by gently increasing the voltage on the motor of the rotating disk
- It is necessary to prepare the instruments to the measurement for Part 3, it is advised to use results from Part 1 and Part 2. For example, to set the working frequency etc. If you could not determine the working frequency use 40 kHz as a working frequency. Make sure, the voltage of the signal from FG is not saturated.
3a. Formulas for the Doppler shift of sound from the rotating disk.
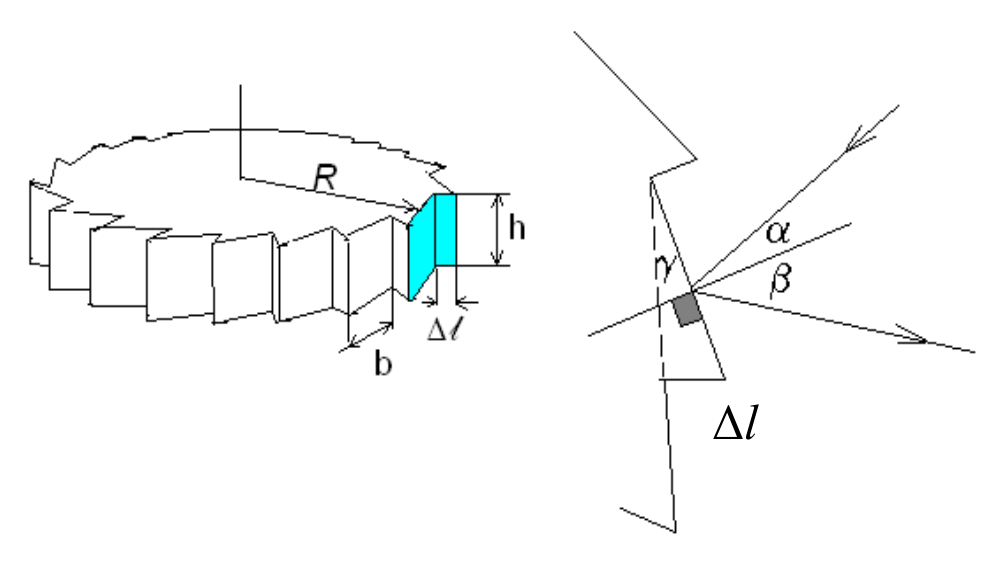
- A sound wave from the Source reflects to saw tooth of the rotating disk (Figure 1) and the Doppler effect will occur. If we denote as the velocity of motion of the saw tooth in R direction, obtain a formula for in terms of , and , for this case. Make it sure in the experimental setup, an angle dependence is negligible, or an incident and a reflected angles should be less than 5º.
- From obtained expression, write a simplified formulae for in function of using the abbreviation , for the case , where is the working frequency. Whole derivation procedure should be written on the Answer sheet.
[1,5 т.]
3b. Calculations for the Doppler effect from the rotating disk
Derive the expression for the radial velocity of the middle point of saw tooth in terms of angular velocity of rotating disk and . (The saw tooth’s height is , for further calculation). [1,4 т.]
3c. The Doppler effect in dependence on the motor voltage
Measure frequency of the ultrasonic signal detected by the detector as a function of the motor voltage up to 16V. Plot a graph vs . From the graph at large U, determine the value of threshold voltage from which the exploration of the goes to zero, and the slope of the graph with an measurement error. [2,8 т.]
Hints: Make the rotating disk to rotate in Clockwise (CW) direction and don’t change it further. Choose the detector position that it measures more stable and more effective. To save your time you can measure electric current for Task 3d, simultaneously with the measurement of motor voltage.
Make sure equipments that you use in Experimental part, are calibrated and measured very well before using them. Each system has own specification which is given on special sheet. For example, at 10V voltage, the frequency shift of the Doppler effect is given in the specification sheet. Using these experimental results, you should calibrate your system. Otherwise, the measurement will be incorrect.
3d. Linear dependence of U
From the specification sheet, find angular velocity , voltage and electric current with its measurement errors (for CW direction) and calculate numerical coefficients and errors for the linear dependence of U. Assume that at high voltages, is approximately proportional to the voltage. You should write the obtained values from the specification on Answer Sheet. [0,8 т.]
3e. Speed of sound in air from the Doppler effect
Put together the functional dependences and and find from here the speed of sound in air with a measurement error. Using experimental and theoretical values of the speed of sound in air find the relative error of your experiment: .
where = 343 m/s speed of sound in air in audible range at 20 C. You can use this value only in this part [1,5 т.]
PART 4: Threshold and Resolving Power of Hearing (3 т.)
The threshold of hearing is the sound intensity in W/m at which our ear can barely hear it. This threshold depends on sound frequency. The threshold of hearing at about 2000 Hz is equal to W/m. The ratio is called as sound intensity level and is measured in units of Bell, abbreviated as B. In the practice it is more convenient to use the ratio (in dB) = 10 . The human ear can hear sounds from about 20 Hz to about 20,000 Hz. It called that the audible range.
List of Apparatuses and Accessories
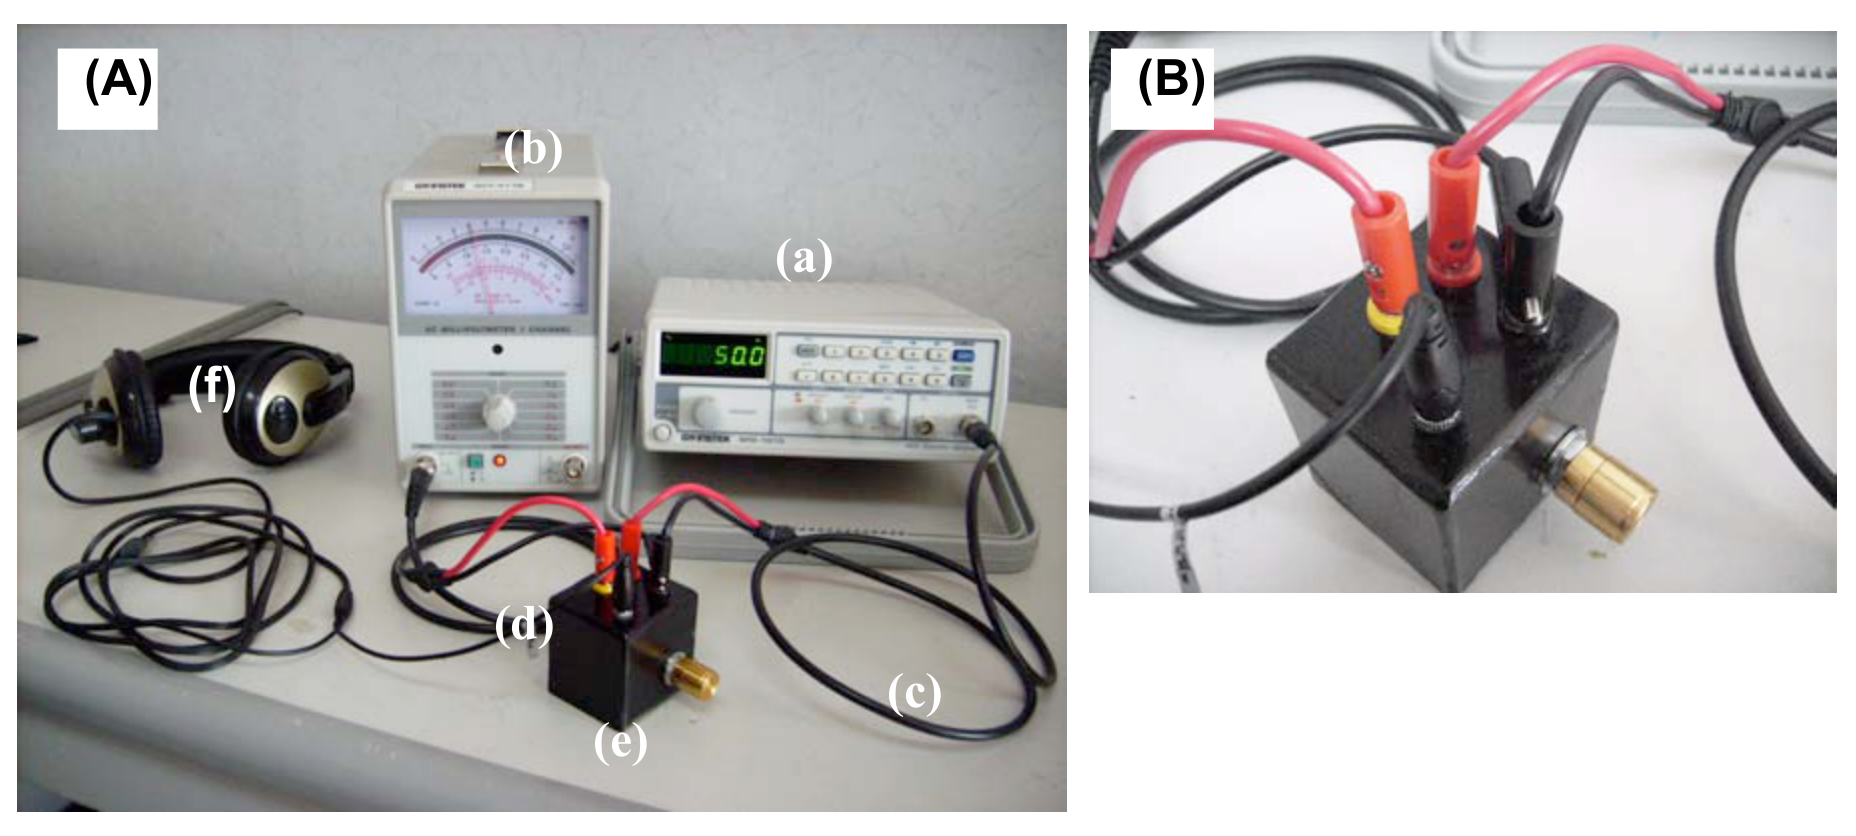
The following items are required for this experiment (Figure. 4.1)
- Function generator (a)
- AC Millivoltmeter (b)
- Cable connectors (c, d)
- Variable resistor (rheostat) (e)
- Headphone (f)
Preparation
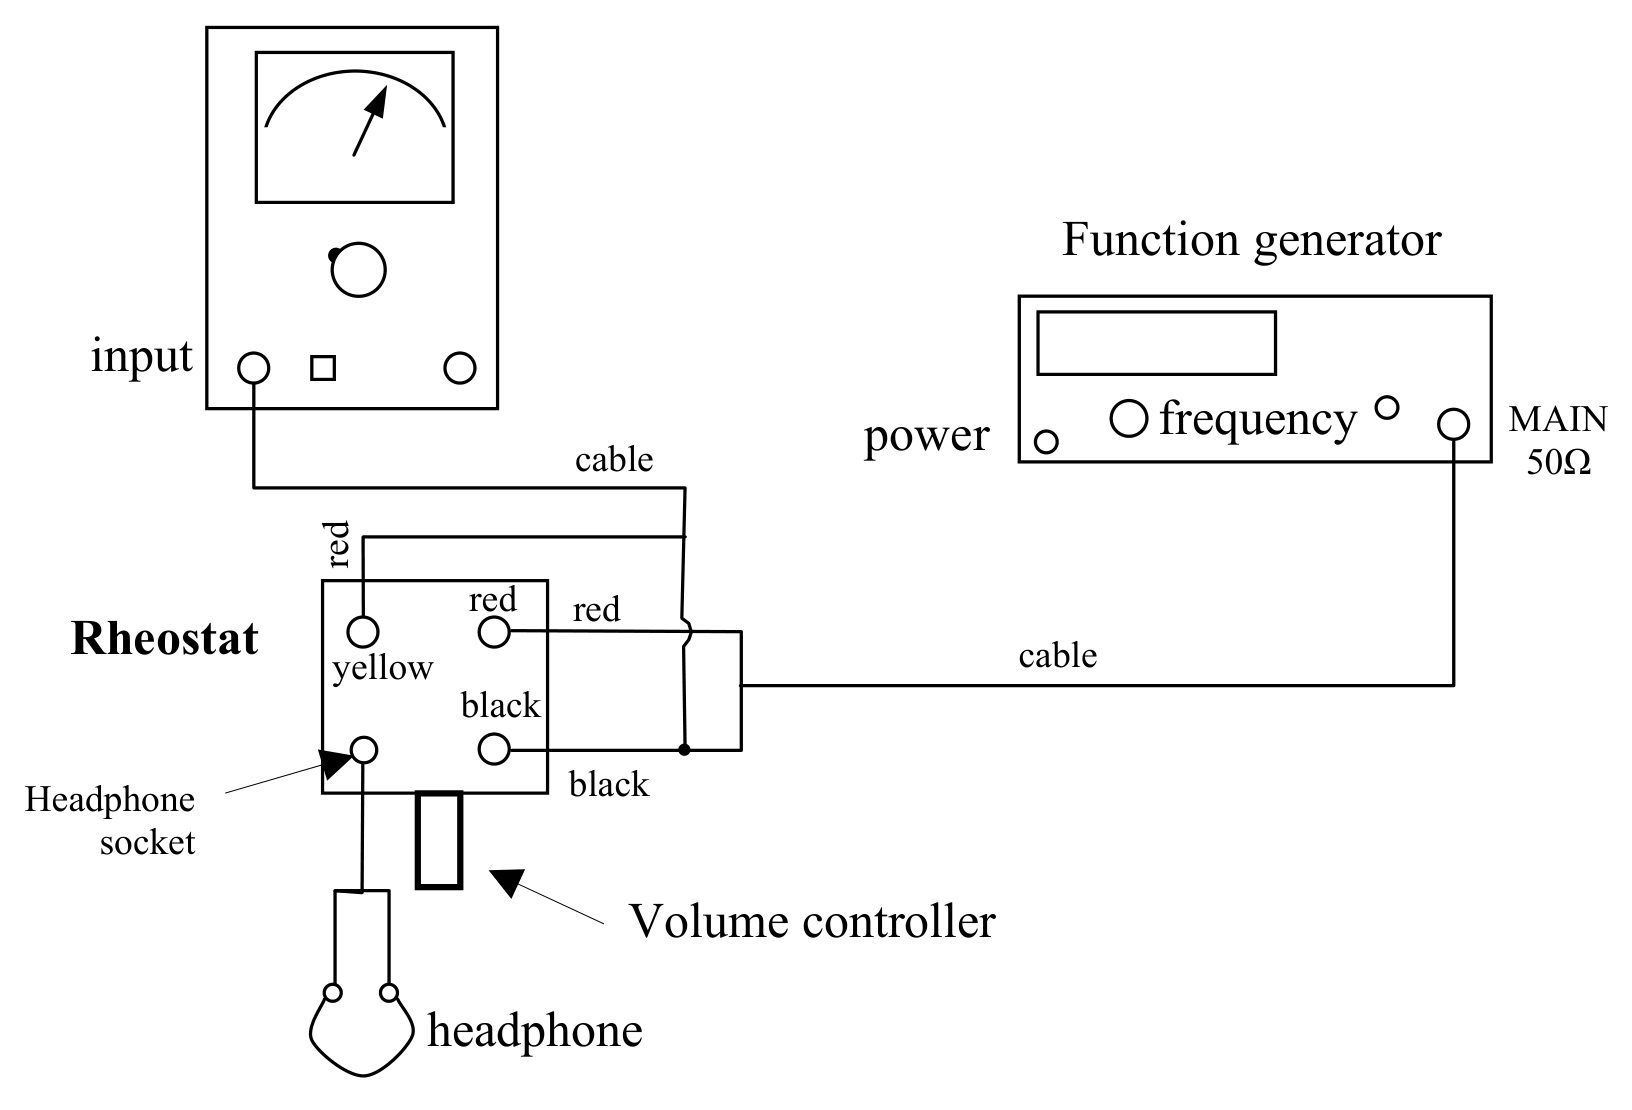
- Connect the experimental apparatus as showed in Figure 4.2.
- Switch on the power of the AC millivoltmeter and Function Generator.
- Rotate the ADJ button and set it to the middle position.
Measurements
4a. The frequency region of one’s own hearing
A. Determination of the lowest frequency to be heard, ; and B. Determination of the highest frequency to be heard,
- Set the volume level of the headphone to the maximum using volume controller of rheostat.
- Find the lowest frequency, , to be heard. In order to do it you should change both of sound level and frequency. To change the frequency use the frequency button of Function Generator. To change the sound level you can use the rheostat and the AMPL ADJ button of the Function Generator.
- Use similar procedures and find the [0,5 т.]
4b. The frequency region to be heard the best
- Lower the sound intensity step by step. For each step find the and . Find out a region where you can hear lowest level of sound intensity, as possible as can. The lower limit of this region is lowest frequency of the frequency region to be heard the best, ; and upper limit of this region is the highest frequency of the frequency region to be heard the best, .
Average of this two limits or the most sensitive frequency to be heard is
[1 т.]
4c. Resolving power (R) of ear for different frequencies of sound.
Resolving power of ear is an ability to distinguish two close frequencies.
- Set the frequency of the generator to .
- While hearing with the headphone, change the intensity to the level that you can hear well.
- Change the frequency a little. If you can not hear a difference between and the changed frequency, make the difference a little more. Find a frequency that you can hear as a different from the . Difference between the and the changed frequency is resolveable frequency of your ear at .
- Calculate resolveable frequency () and resolving power for the . [1 т.]
4d. Find the minimum speed of the mirror which gives Doppler effect detected by one’s own ears in the above frequency region.
Evaluate the speed of the mirror and error of it using the following formula:
where = 343 m/s speed of sound in air in audible range at 20 C. You can use this value only in this part. [0,5 т.]
Решение
Внимание: Непълно решение
В архива няма официално решение на тази задача.
Теми и трудност
Трудност: неоценена.
Вълни и звук · Звук и акустика · Суперпозиция и интерференция · Ефект на Доплер
Предпоставки: Гимназиална подготовка
Оригинал в Архива: exp.pdf