APhO 2011, Експеримент — Задача 2. An Optical “Black Box”
Experimental Question 2: An Optical “Black Box” · 5 май 2011 г. · 10 т.
Внимание: Бележка към темата
The official solution contains sample measurements; actual experimental results depend on the apparatus. Its printed values x = 277.7 mm and Δx = (x₁ − x₂)/2 = 1.5 mm are reproduced unchanged. The total of 10 points is the sum of the three printed section scores. The original two-page answer form is linked with the sources; its blank measurement grid contains no additional data.
Условие
TV and computer screens have advanced significantly in recent years. Today, most displays consist of a color LCD filter matrix and a uniform white backlight source. In this experiment, we will study a sample of plastic material which was considered for use as an ingredient in the backlight illumination of LCD screens.
Equipment
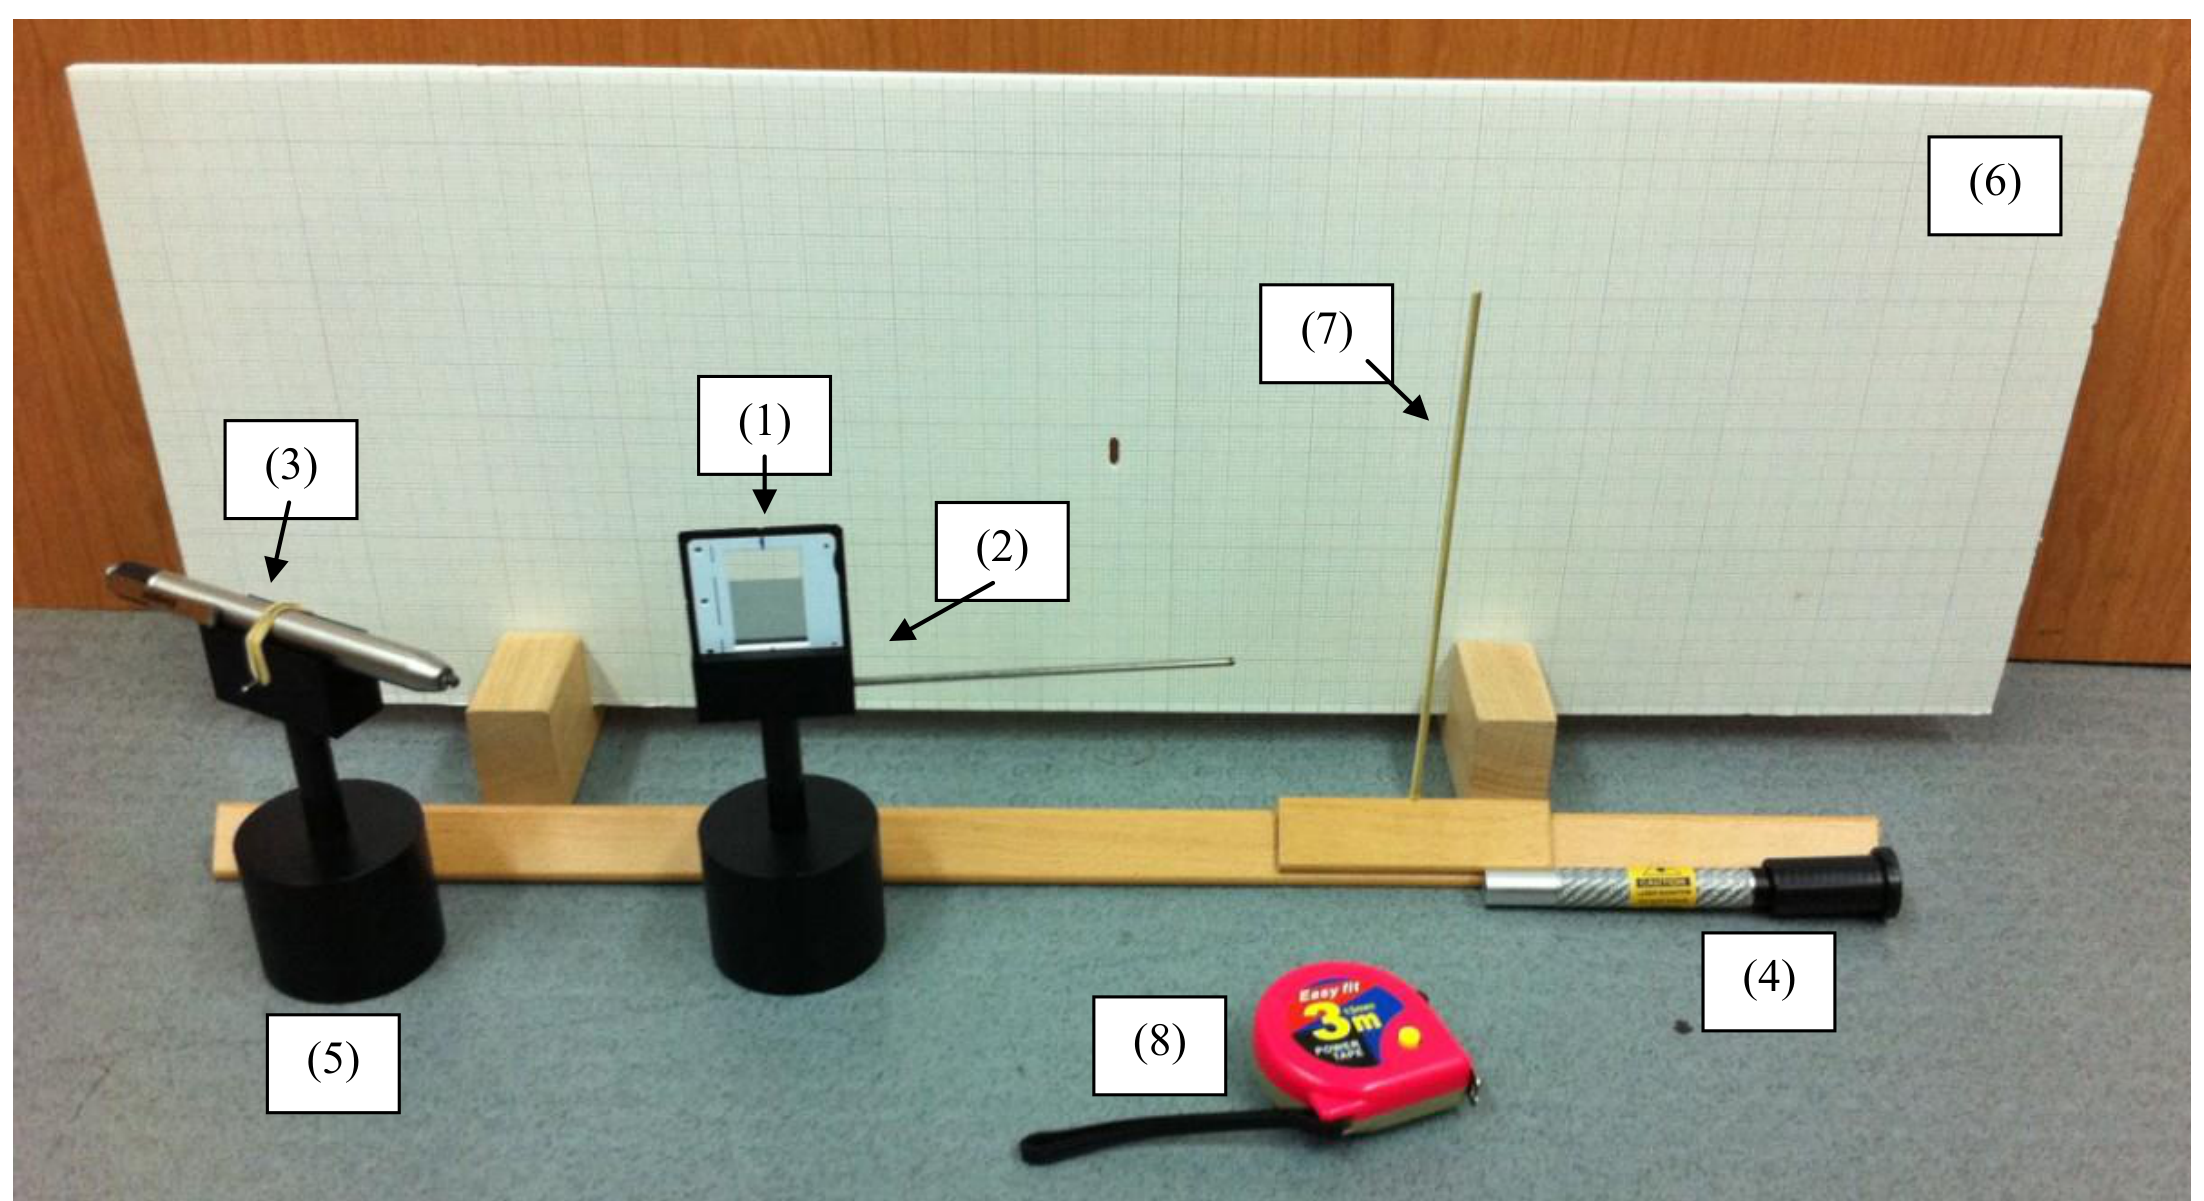
On your desk, you have the following items (see Figure 1):
(1) The sample - a piece of plastic material fixed in a slide frame. The sample is sensitive - do not touch it. To adjust the sample’s position, use its holder and stand.
(2) A holder and stand for the slide frame. The stand includes a handle which can be used for fine rotations of the sample. Do not remove the slide frame from its holder.
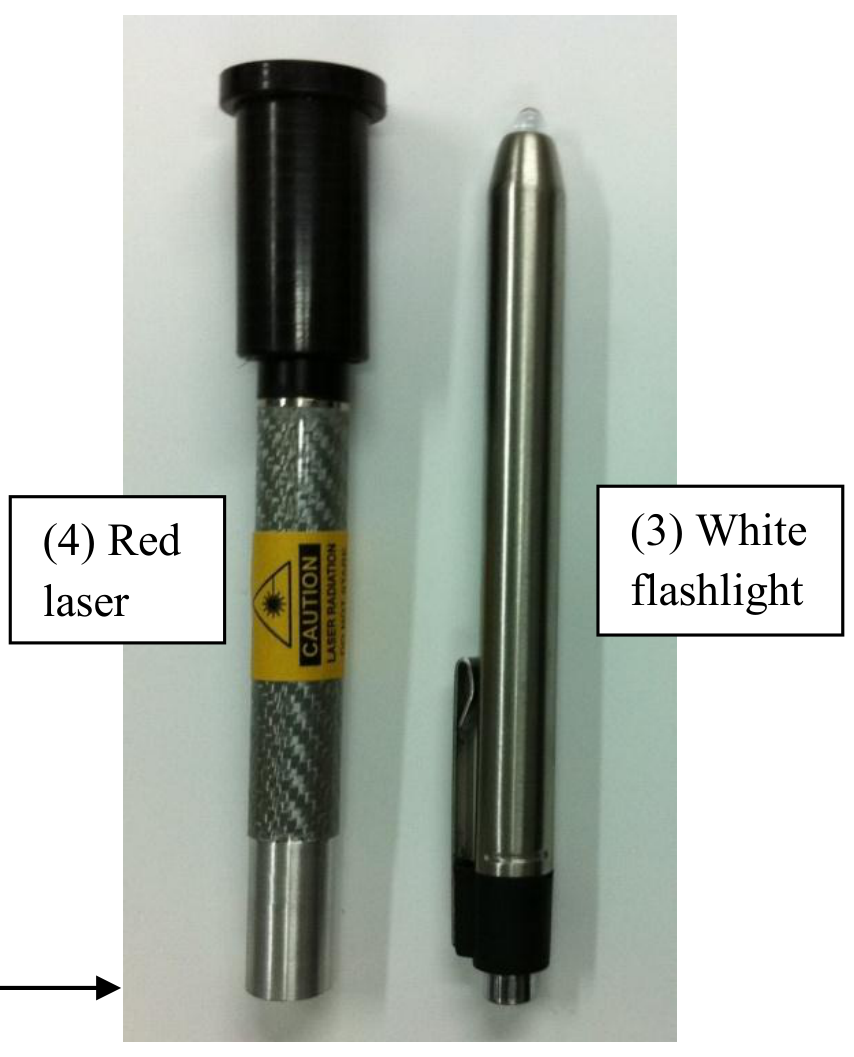
(3) A white LED flashlight. The flashlight can be turned on and off using a button at its rear end. Do not confuse it with the laser (see Figure 2).
(4) A red laser pointer. The laser is marked with a warning label. Do not confuse it with the white flashlight (see Figure 2). The laser may be turned on and off by moving its black cap back and forth. Don’t try to remove the cap – it may be dangerous, and you may break the laser. The laser’s battery will weaken after about an hour - do not keep it turned on longer than necessary. The laser’s wavelength is .
(5) A single stand to be used for the two light sources. At the start of the experiment, the flashlight is fixed to the stand, while the laser lies on the desk.
(6) A white screen on wooden legs, covered with millimeter graph paper. There is a hole near the middle of the screen. You are allowed to make markings on the screen.
(7) A wooden stake that can be moved back and forth on a wooden bench. You are allowed to make markings on the bench.
(8) A tape measure.
(9) A ruler.
(10) Millimeter graph paper.
(11) A desktop lamp which can be turned on or off for your convenience.
LASER SAFETY:
- Do not stare into the laser beam!
- Beware of reflections from metallic surfaces.
- Do not point the laser at others.
- Do not try to repair or disassemble the laser. Call a supervisor if you require assistance.
Part I – Theory (0,4 т.)
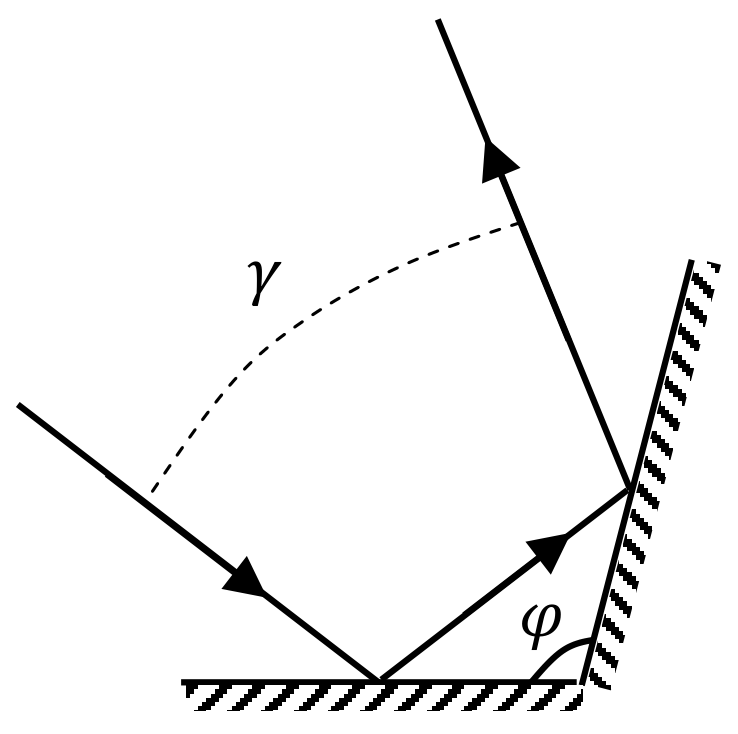
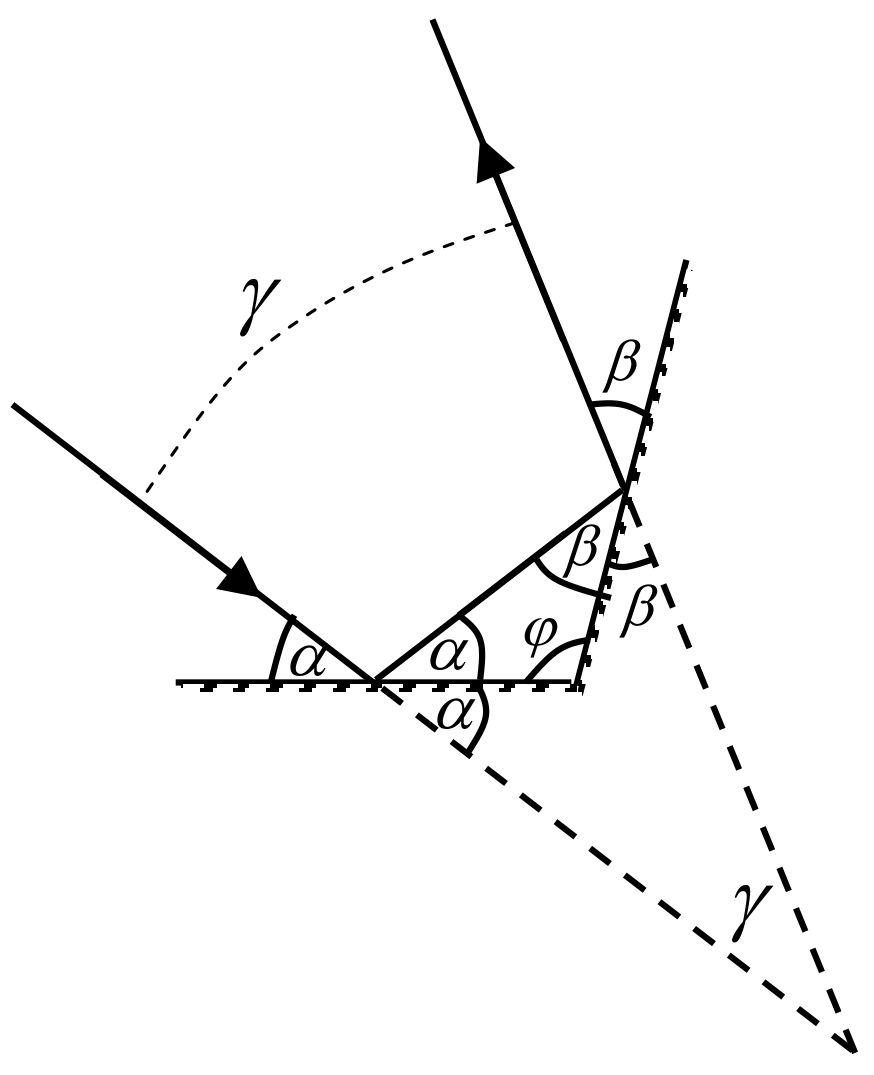
a. A light ray is reflected from two mirrors which meet at an angle (Figure 3). Find the angle between the incoming and outgoing rays. Assume that all light rays lie in the plane perpendicular to the mirrors’ intersection line. [0,4 т.]
Part II – Measurements with white light (6,1 т.)
Using the white flashlight as your light source, you may observe both the transmission and the reflection properties of the sample. Figure 4 illustrates the suggested setups for both types of observation. Note: you may observe different results when illuminating the two sides of the sample.
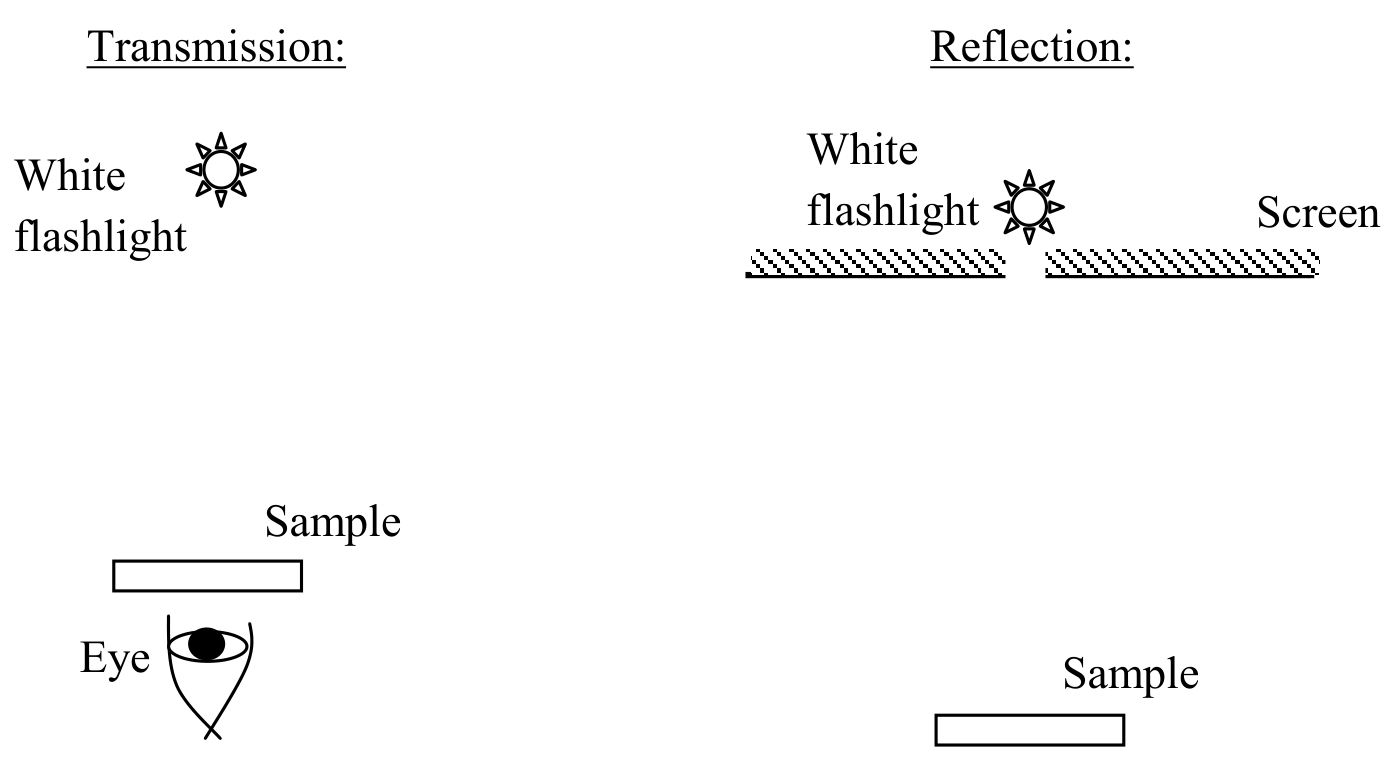
CAUTION: For viewing transmitted light, you will have to look directly into the flashlight beam through the sample. Don’t do this with the laser! Also, avoid looking directly into the flashlight itself for long periods of time.
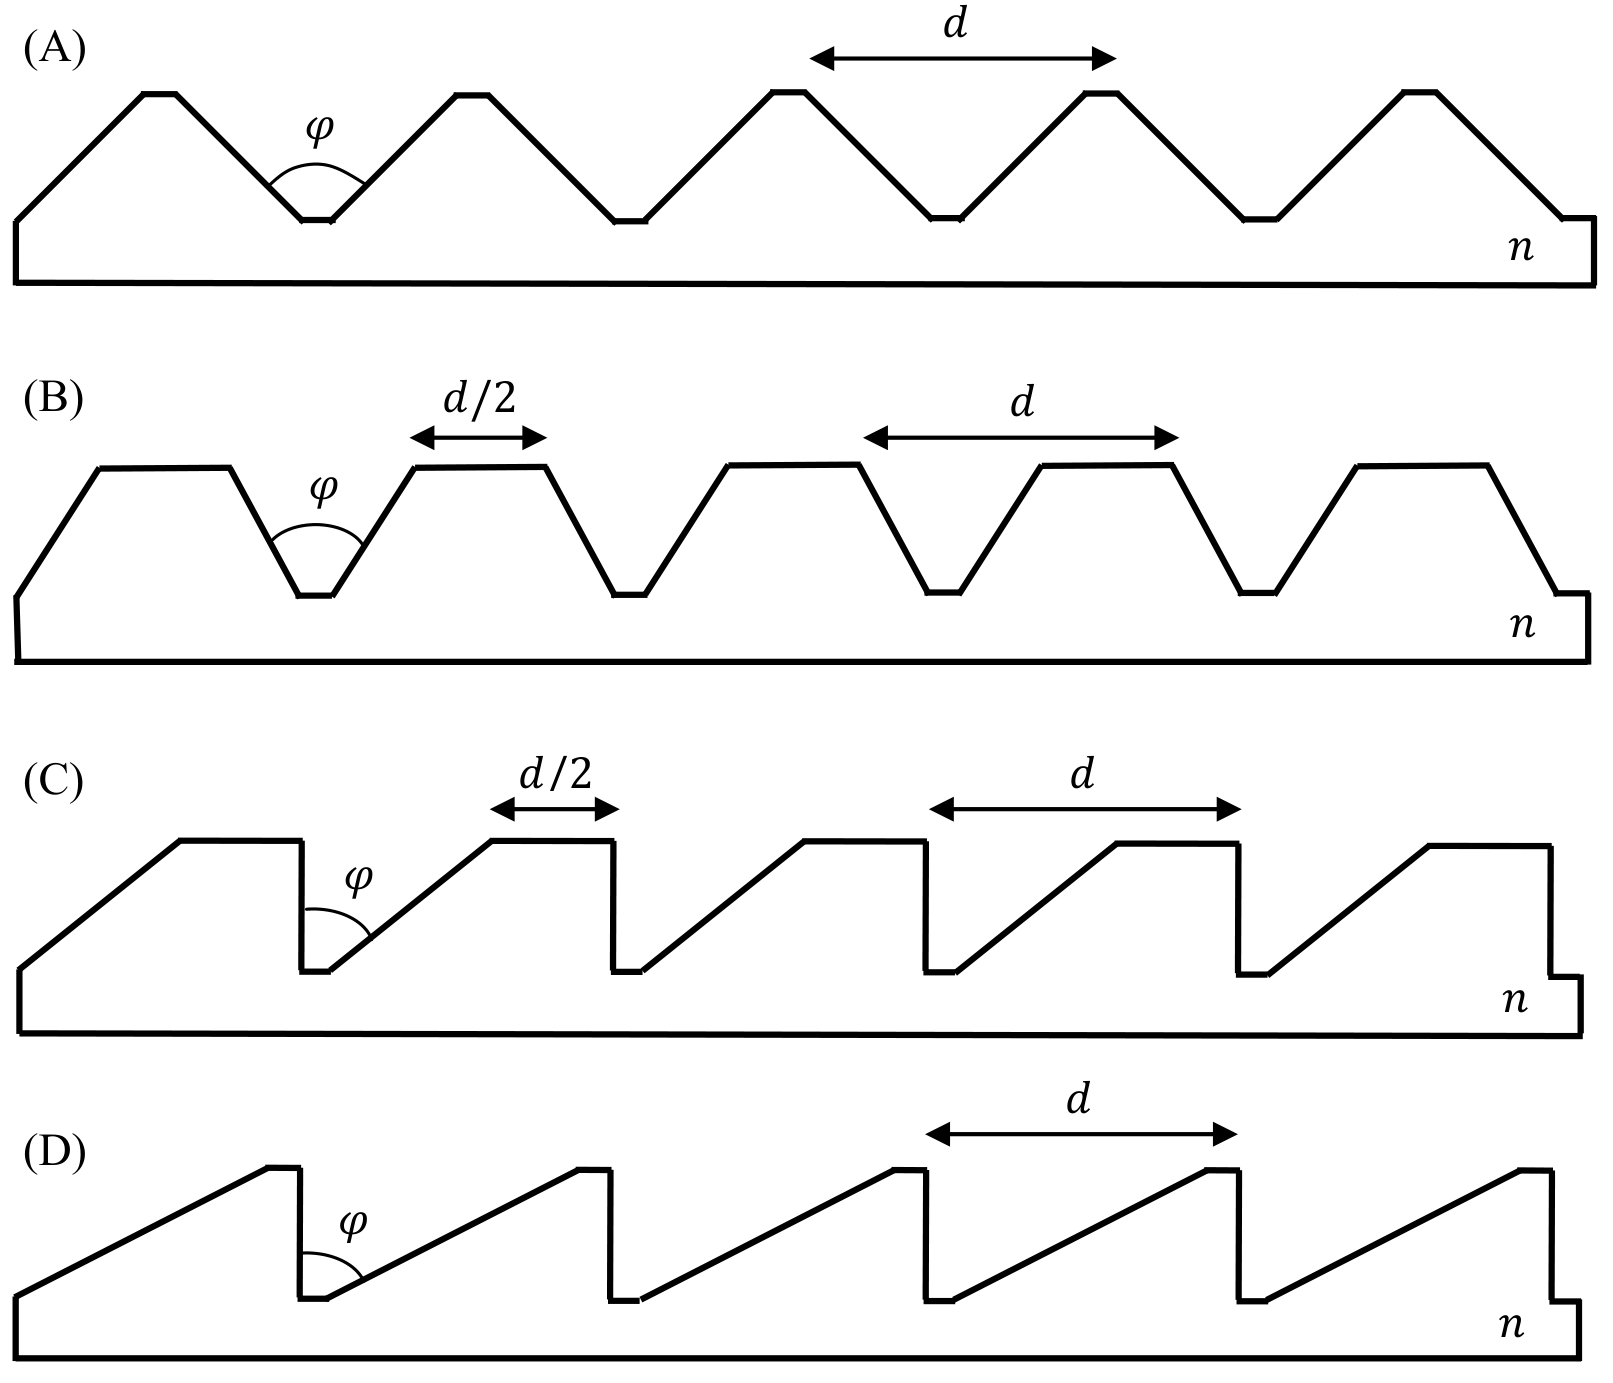
b. Figure 5 illustrates schematically four possibilities for the sample’s microscopic structure. stands for the refractive index of the plastic. Choose the structure that best fits your observations. Note: the 5 periods shown in the figure are for illustration only. In reality, is small, and the sample contains many periods. [0,5 т.]
c. Find the angle for the sample and estimate its error. [0,8 т.]
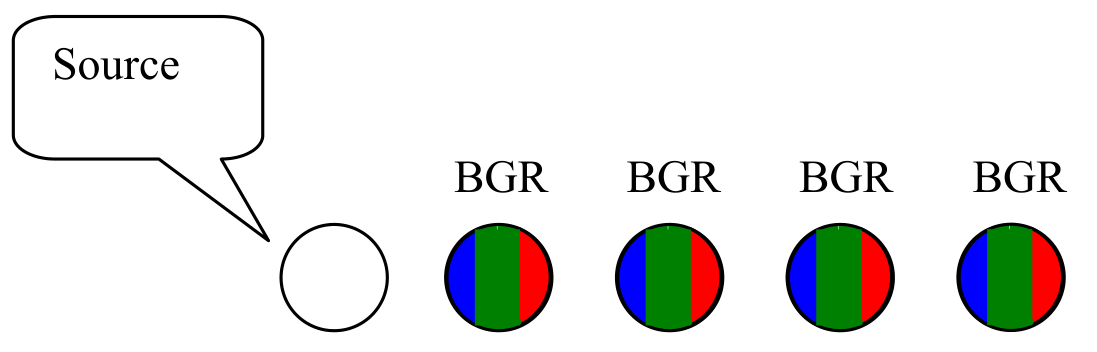
d. When a perpendicular white light beam is incident on the sample from one of its sides, the following faint pattern can be observed in the transmitted light, slightly to the right from the source (Figure 6). “R”, “G” and “B” stand for red, green and blue respectively. Note: this pattern may be difficult to observe, and measurements on it are not required.
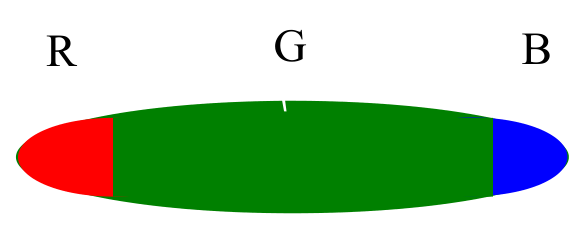
Further to the right you may observe a much brighter pattern (Figure 7):
Choose the correct option:
A. All the colored patterns result from interference.
B. All the colored patterns result from the dependence of on the wavelength.
C. The patterns depicted in Figure 6 result from interference, while the pattern depicted in Figure 7 results from dependence of on the wavelength.
D. The patterns depicted in Figure 6 result from the dependence of on the wavelength, while the pattern depicted in Figure 7 results from interference. [0,5 т.]
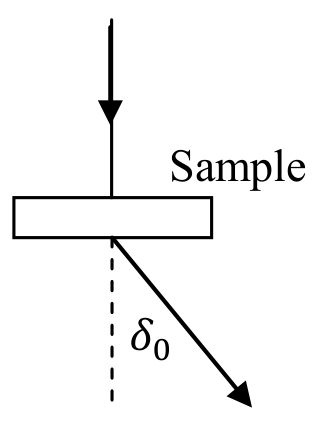
e. With the white light set up as in part (d), measure the deflection angle of violet light (at the far blue end of the spectrum) for the dominant peak depicted in Figure 7. The deflection angle is defined in Figure 8. Record all intermediate measurements. Provide error estimates. [1,4 т.]
f. Illumination of the sample at different angles of incidence results in different deflection angles for the dominant transmitted peaks. Measure the minimal deflection angle of the dominant peak for transmitted violet light (there is only one such minimal angle). Record all intermediate measurements. Provide error estimates. [1,4 т.]
g. Using the angle from part (c), express the refraction index of the sample in terms of either or . You may use the reversibility of light propagation and the fact that there is only one minimal angle . [0,8 т.]
h. Find the refraction index of the sample for violet light and its error estimate. [0,7 т.]
Part III - Laser measurements (3,5 т.)
Remove the flashlight from the light-source stand, and replace it with the laser. You can use the white screen to view both transmission and reflection patterns, as illustrated in Figure 9. The laser has a limited battery life - do not keep it turned on longer than necessary. When aligning the components, it may help to rotate the laser around its axis. WARNING: Do not look directly into the laser beam or its reflections! Do not look at the laser light through the sample – use the provided screen.
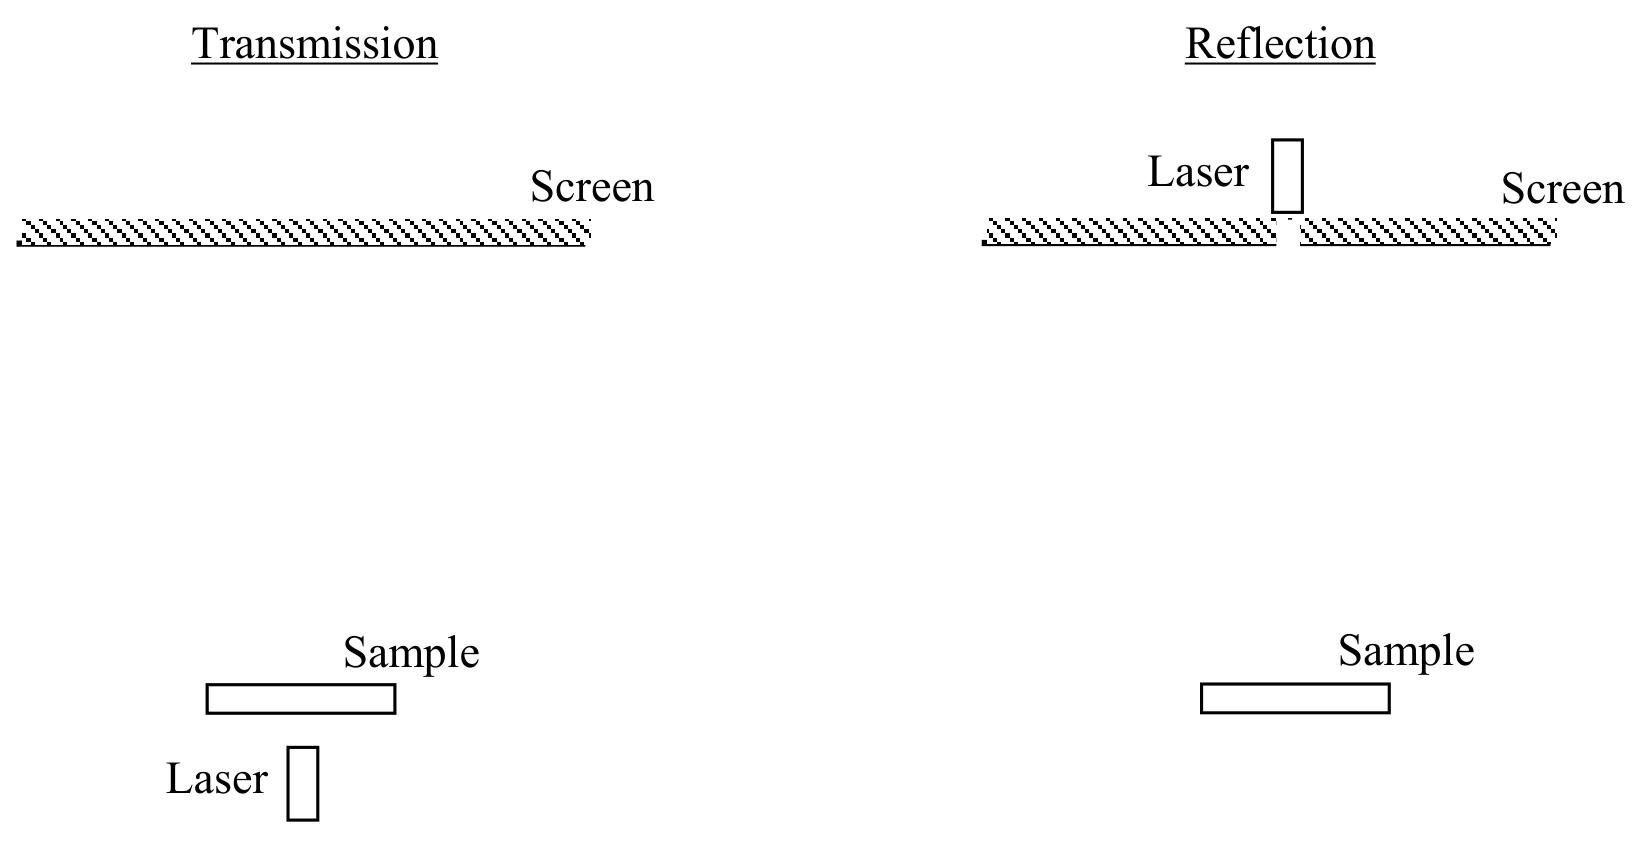
Observe the alternating pattern of bright and dim fringes on the screen as you slightly rotate the sample. The dimming of some of the fringes is due to destructive interference between different regions of each “tooth” on the sample.
i. Use one of the setups in Figure 9, with the sample illuminated perpendicularly by the laser beam. Record the deflection angles of the observed fringes as a function of the fringe number . Define the center of the pattern as . Use the provided table on the answer form. Record all intermediate measurements. Provide error estimations. [1 т.]
j. Using a linear graph, find the spacing between two adjacent “teeth” of the sample. Error bars on the graph are not required. Provide error estimation for . [1,5 т.]
k. Using the formula you derived in part (g), find the refraction index of the sample for the laser’s red wavelength. Record any additional measurements. Provide error estimates. WARNING: Do not look through the sample! Use the provided screen. [1 т.]
Отговори
Part I – Theory, a.
Part II – Measurements with white light, b. A
Part II – Measurements with white light, c. φ = π/2, Δφ = 0.04°
From the official solution: φ = π/2 with an error Δφ = 7·10⁻⁴ rad = 0.04°.
Part II – Measurements with white light, d. C
Part II – Measurements with white light, e. 31.3 °
Sample measurement of the official solution: x = 471 mm ± 2 mm, y = 775 mm ± 1 mm, δ0 = 31.3° ± 0.1°; the measured value depends on the apparatus.
Part II – Measurements with white light, f. 30.75 °
Sample measurement of the official solution: x = 461 mm ± 2 mm, y = 775 mm ± 1 mm, δmin = 30.75° ± 0.1°.
Part II – Measurements with white light, g.
Part II – Measurements with white light, h. 1.604
Sample experiment of the official solution: nv = 1.604 with error Δnv = 0.002.
Part III - Laser measurements, i. Measurement table; the official solution gives sample data in Table 1.
Part III - Laser measurements, j. 50.2 µm
Sample experiment of the official solution: slope k = 0.0130 ± 0.0002, d = λ/k = 50.2 µm, Δd = 0.8 µm (1.5%).
Part III - Laser measurements, k. 1.578
Sample experiment of the official solution: nr = 1.578 ± 0.002.
Решение
a.
Consider an incoming light beam at angle to the first mirror (see figure). The angle to the second mirror is given by . Thus, the total deflection angle is . In particular, it is independent of . The angle is then given by:
b.
The correct option is A. Options C and D are ruled out, because both the transmission and reflection patterns possess left-right symmetry. Option B is ruled out, because it implies strong forward transmission at perpendicular illumination; instead, strong transmission is observed only to the sides, as described in question (d).
c.
To determine , we must observe the reflection pattern, using the setup suggested in the question. It is important to place the flashlight into the hole in the screen; otherwise, the observed pattern will be smeared due to the sample’s non-zero size.
A strong reflection pattern is observed when the light enters the sample from its flat side, is reflected twice from the two slanted faces, and exits again from the flat side. This optical path results in total internal reflection, producing a much brighter reflection pattern than the pattern for light coming from the “toothed” side.
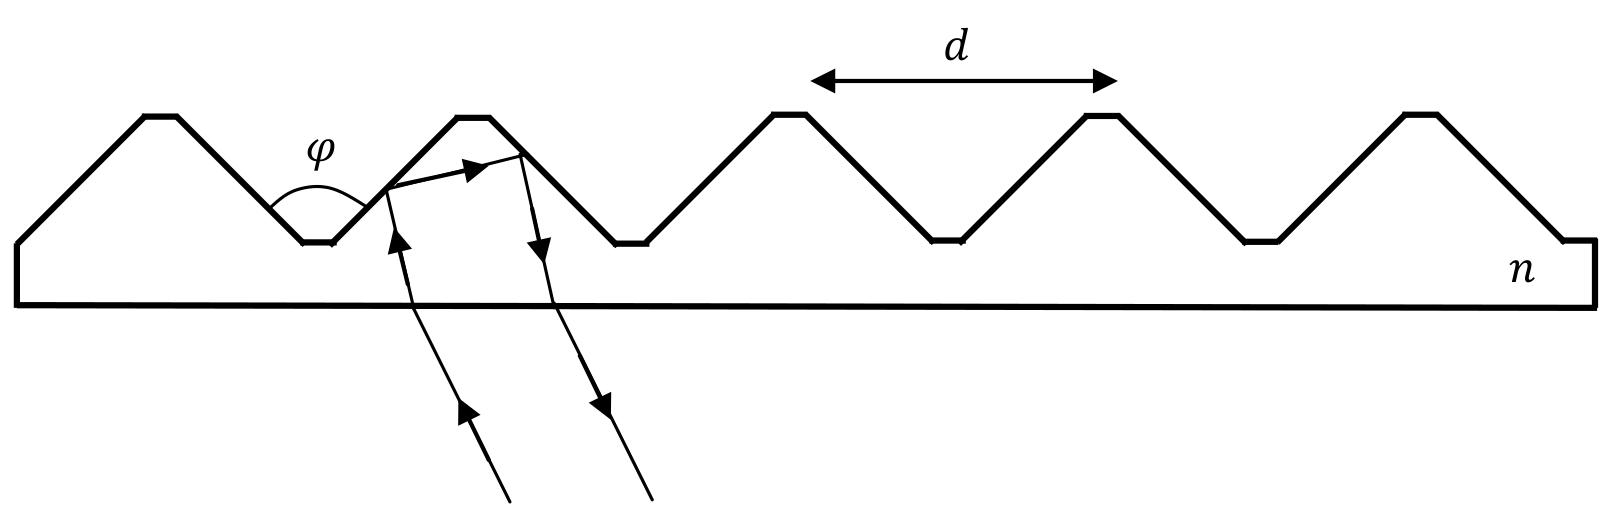
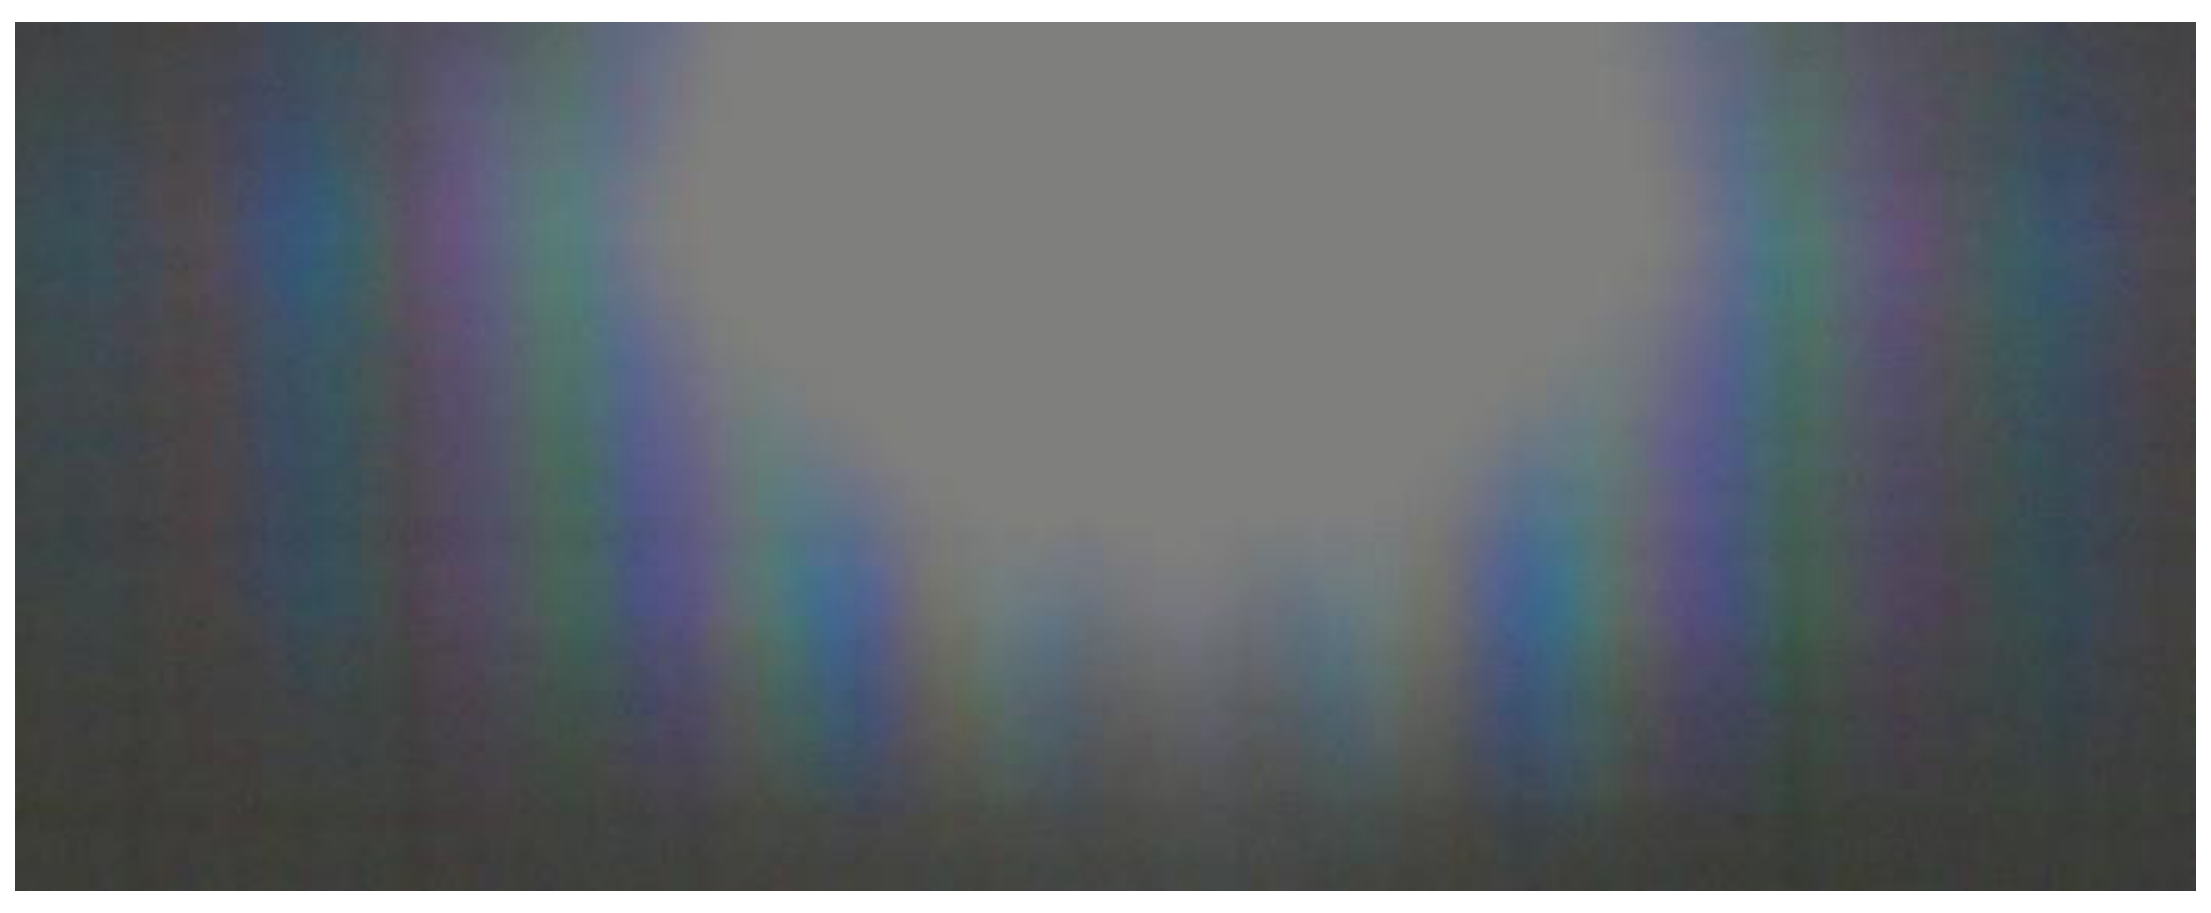
The observed pattern is a colorful band of interference fringes, gradually fading to the sides, without well-defined edges. As we rotate the sample, it can be seen that the pattern widens and narrows, while its center remains stationary, directly on top of the flashlight’s center. While the color sequence is complicated, it is visibly symmetric around the center, which appears white; these observations are the key to identifying the center precisely.
The center of the pattern corresponds to the optical path due to geometric optics. From part (a), we see that such a zero reflection angle corresponds to an angle between the two reflecting surfaces. This conclusion is supported by two other qualitative observations. First, if the reflection angle were nonzero, light from different areas of the sample would reach different points on the screen, due to the sample’s non-zero size. This would have lead to a smeared reflection pattern, like the one obtained when the flashlight does not coincide with the screen. Second, we see that the location of the pattern’s center doesn’t depend on the sample’s orientation. Without refraction at the flat boundary, this would have been the case for any reflection angle. However, taking the refraction into account, the angle between the incoming and outgoing rays would have to be a function of the incidence angle, except for the case , for which the angle remains zero after refraction (see figure above).
The center of the interference pattern can be identified with an error of for the optimal observation distance between the flashlight and the sample. This results in an error of at most radians in the angle between the incoming and outgoing rays. Examining the result of part (a), we see that this error should be halved to give the error in . Though it is not required, a bright student will also divide the error by the refraction index , which can be estimated as . This is because the refraction amplifies angular deviations as the light leaves the sample. We conclude that the error in is . This will be negligible with respect to all other errors in the experiment.
A common mistake will be to take the edge of the central white stripe, or the edge of the entire pattern, as representing instead of the pattern’s center. For the edge of the central white stripe (about at ), this would result in a deviation (depending on whether is taken into account). For the edge of the pattern (about at ), this would result in a deviation.
Similarly, a student may decide that the edge of the central white stripe or the edge of the pattern correspond to the error . This will lead to an over-estimation of the error as or , respectively.
d.
The correct option is C. An interference pattern will always have larger deflection angles for larger wavelengths. Therefore, the pattern in Figure 7 cannot result from interference, and must result from the dependence of on the wavelength. On the other hand, the pattern in Figure 6 has the correct order of colors for an interference pattern. It must in fact be an interference pattern, because the sample’s structure as depicted in part (b) is rather simple and periodic, and cannot produce a large number of nearby refraction angles.
e.
The phenomenon described in this part is observed when the sample is illuminated from its “toothed” side. Transmission from the other side is very weak due to total internal reflection.
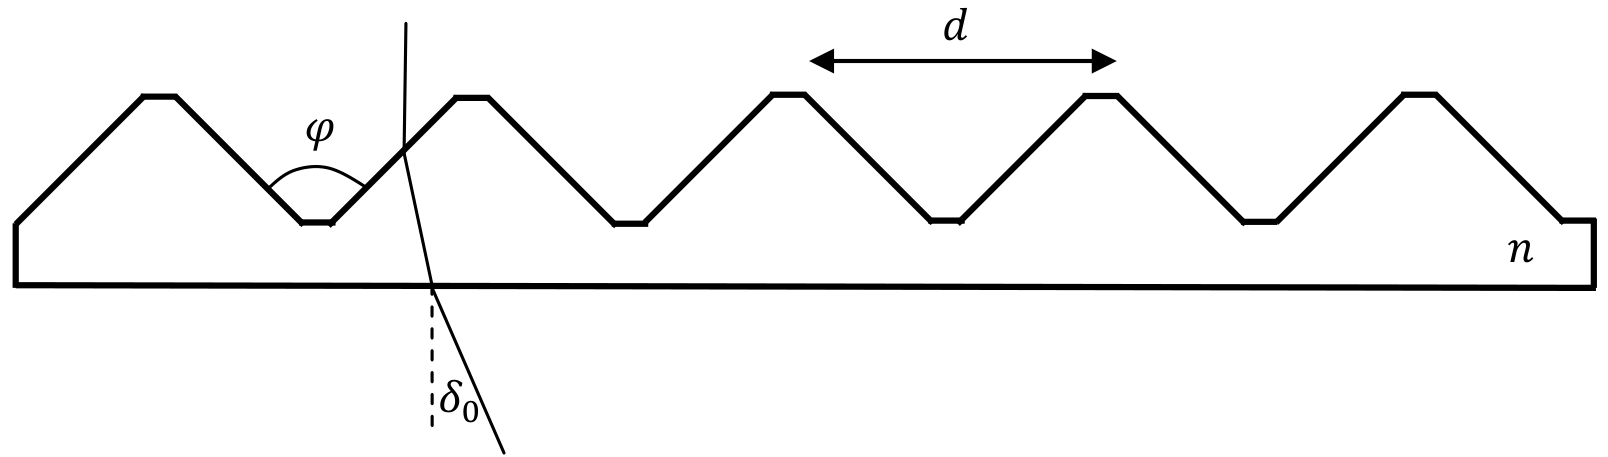
The deflection angle can be seen qualitatively by projecting the transmission pattern onto the screen. However, due to the sample’s nonzero size, this pattern is too smeared to enable precise measurement. A much sharper pattern is observed when looking directly through the sample, as suggested in the question. The challenge is then to measure angles that are seen directly with the eye, rather than on a screen.
For this purpose, the student is provided with the mobile wooden stake on a bench. The bench should be placed perpendicularly to the line of sight between the flashlight and sample. The stake should be positioned at two points: point A directly along the line of sight between the flashlight and sample, and point B where the stake coincides with the desired band of deflected light along the student’s line of sight. The two measurements are the distance between these two points and the distance between the sample and the center of the bench. The desired deflection angle is then given by:
To properly establish point A, some alignment issues must be solved. The long bench can be quite accurately placed in parallel to one of the desk’s sides. The flashlight can then be placed near the bench, in perpendicular to it. The sample can also be aligned in parallel to the desk’s side, by visual reference to the orientation of its long handle. The bench should lie in front of the flashlight, rather than behind it. This has two advantages. First, it allows for a greater distance between the flashlight and sample, minimizing the harm from the sample’s nonzero size. Second, it allows us to align the stake directly in front of the flashlight quite accurately. The alignment of the stake and flashlight can be checked and corrected by observing the stake’s shadow on the desk. Finally, we must place the sample precisely in front of the flashlight, i.e. without a sideways offset. One way to do this is to place both the flashlight and sample at the edge of the desk. A less accurate way is to measure their distances from the edge using the tape measure. In any case, there are several ways to check the alignment without reference to the desk:
- Ensuring that the sample lies at the center of the stake’s shadow from the flashlight.
- Looking at the flashlight through the sample’s frame, and making sure that the flashlight’s center and the stake are aligned together with the frame’s center.
- Placing a sheet of paper behind the sample, and making sure that the stake’s shadow on the paper is at the center of the shadow from the sample’s frame.
To establish point B, it is best to look through the sample not from a zero distance, but from a distance large enough to focus the eye on the sample’s frame. One should then try to align three points along the line of sight: the center of the sample’s frame (marked with a blue line), the desired band of deflected light, and the stake. It is convenient first to align the frame’s center with the deflected light, and then check in which direction the stake should be moved to align with them. Within 3-5 such iterations, point B can be established with an accuracy of about .
Once the points A and B are physically established, the distance between them has to be measured. One way is to record each position of the stake with a pen mark on the bench, and then measure the distance between the two markings. It’s difficult and unnecessary to mark the position of the stake itself – one can mark the position of the edge of the stake’s holder. Another way, which doesn’t require any markings, is to align the edge of the stake’s holder at point A with the edge of the bench. Then when the stake is at point B, the distance can be measured directly. In any case, while moving the stake between points A and B, the student must take care not to move the bench.
The relative accuracy of the measurement increases with the distance between the flashlight and bench and the sample. Optimally, most of the desk’s 1-meter length should be used for the distance . Then will take up most of the desk’s width. The price for these large distances is that the bench is not within arm’s reach from the sample, and the student will have to get up for each adjustment of the stake’s position.
The cylindrical base of the sample holder makes it difficult to measure the distance accurately. The solution is to place the measuring tape perpendicularly to the bench or screen, and in tangent to the cylindrical base. Repeated measurements reveal that this reduces the error to .
We now present the results of a sample measurement:
From these we derive the deflection angle . The error in as derived from the measurement errors reads:
One can also use the simpler formula to arrive at a similar result. The value leading to this estimate was obtained from repeated attempts to locate point B without changing the overall alignment. A student who repeats the alignment process from the beginning and compares his results will likely get a larger error estimate, up to . The source of these deviations is the difficulty in arranging perpendicular incidence of the light onto the sample. This error is difficult to quantify in any way other than repeating the alignment process. An additional source of error is the subjective definition of the “blue end of the visible spectrum”. Sample measurements were performed by different individuals, and the scatter of their results is taken into account in the Marking Scheme.
Instead of taking the distance between the source and the deflected light band, a student may take the distance between the two symmetric deflected bands on either side of the source. This carries two disadvantages: the size of the desk constrains the perpendicular distance in this case to about , and the difficulties with locating point B are now encountered twice.
Another inferior alternative is to use the screen’s edges or center instead of the wooden stake. Then the distance is fixed by the screen’s width, and becomes the controlled variable. This method leads to higher errors (about ), for two reasons. First, the stake is helpful in the alignment of the different elements, as described above. Second, it is difficult to fine-tune the distance without spoiling the alignment.
f.
In this part, after the initial alignment and before measuring the deflection angle, the student should gently rotate the sample while looking through it, until he identifies the orientation at which the deflection angle is minimal. Unlike the deflection of perpendicular light in part (e), this minimal deflection angle can be observed from both sides of the sample. When the light is incident on the “toothed” side, as in part (e), the minimum is obtained not far from perpendicular incidence. As a result, is only slightly smaller than .
The measurement process is very similar to that in part (e), except that there’s no need to align the sample for perpendicular incidence. The student may keep the rest of the alignment from part (e), and use the same distance between the sample and the wooden bench. The results of a sample measurement read:
From which we derive:
In this case, the naïve error estimation of eq. (1) corresponds to the actual scatter of results from repeated alignments and measurements. This is because the error from the perpendicular alignment is gone. We still have an error in finding the sample orientation which leads to the minimal deflection. However, this error has very little impact on the measurement of itself, since the deflection angle is stationary around the minimum.
g.
Solution in terms of :
Consider a vertical light ray entering a horizontal prism with opening angle (see figure). We have:
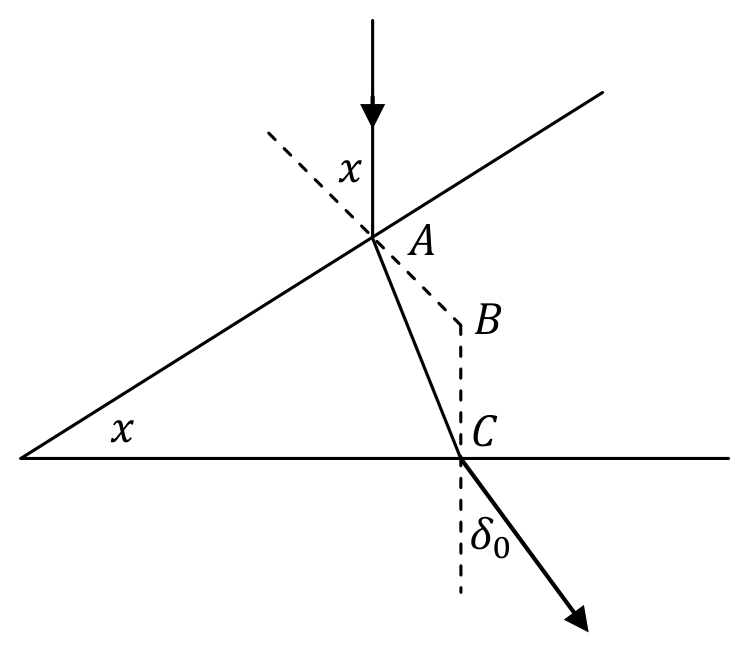
Solving for , we get:
In our case, the appropriate prism angle is , which gives:
A student that plugs in the value will get:
Solution in terms of :
Using the uniqueness of the minimal deflection angle and the reversibility of light rays, we conclude that minimal deflection occurs symmetrically with respect to the prism angle:
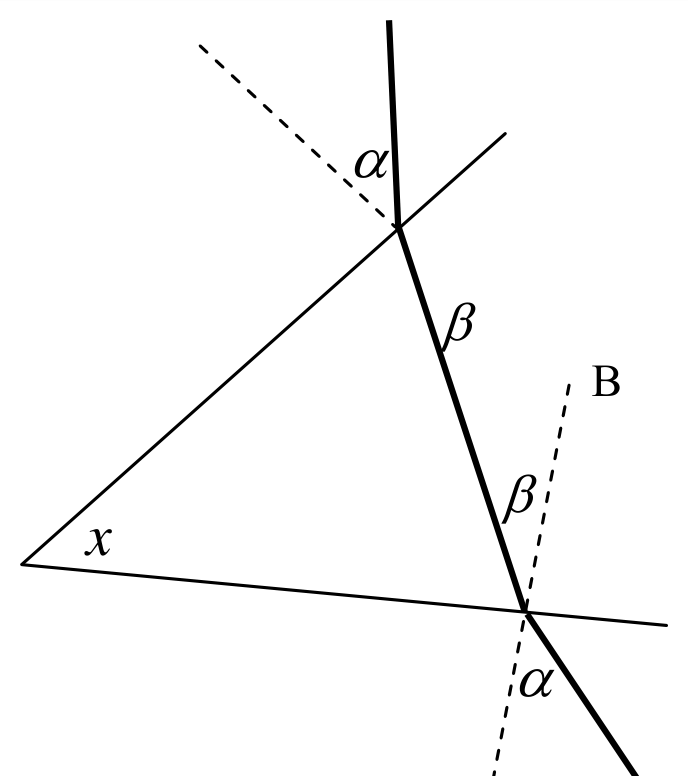
Solving for , we get:
In our case, the appropriate prism angle is , which gives:
A student that plugs in the value will get:
h.
The refraction index can be found either from or from , using the formulae from part (g). As discussed in parts (e) and (f), the measurement of is the more accurate one. Therefore, its accuracy is the basis for the full credit in the Marking Scheme for this part. Using the results (2) and (3), we find for our sample experiment:
The error reads:
i.
The measurement process here is the standard one for a diffraction grating. The pattern is projected onto the screen. The measured quantities are the distance between the sample and the screen, the distances on the screen between the fringes and the pattern’s center, and the fringe number . The angles for the different fringes are then found as . It is important that is measured from the center, since the relation is linear in and not in . An offset in is less problematic, since it will not affect the slope of the linear graph in part (j).
The alignment process is more straightforward than with the white light. The laser beam, observed as scattered light from the screen or from the sample, can be used as a reference line instead of the stake’s shadow. The sample’s nonzero size no longer leads to measurement uncertainties, since the laser beam illuminates only a small portion of it. Instead, we are constrained by the width of the beam, which widens noticeably with distance. Since the laser pointer is not quite horizontal, the beam may come out at a slight vertical slope, causing it to miss the sample. To fix this, the student may rotate the laser around its axis.
A diffraction pattern can be observed in three different configurations:
- Reflection with the light entering the sample from the flat side, as in part (c).
- Transmission with the light entering the sample from the “toothed” side, as in parts (d)-(e).
- Transmission with the light entering the sample from the flat side.
All three configurations produce fringes at the same angles , but otherwise they look quite different. Each configuration has its advantages and disadvantages for our measurement purposes. The best choice among the three may depend on the amount of ambient light in the room.
Configuration 3 gives a wide pattern of dim but well-defined fringes. They result from the interference of light passing through the narrow flattened “peaks” and “valleys” of the sample’s toothed side (the light incident on the slanted faces of the “teeth” undergoes total internal reflection). Note: the observed patterns are sharper than in the photos below, which were taken by a theoretician.

Configuration 2 gives a similar pattern from the “peaks” and “valleys”, superimposed on two much brighter narrow interference patterns from the slanted faces. These bright patterns are centered around the geometric deflection angle , one to the right and one to the left. They are bright because more light passes through the slanted faces, and they are narrow because they are multiplied by the narrow diffraction pattern off of each slanted face, whose width is the same order of magnitude as the spacing . The condition for a fringe at angle is the same for the “peaks” and “valleys” and for the slanted faces.

Configuration 1 (reflection) gives a noisier interference pattern, with broader fringes. This is because the laser beam travels the distance to the screen twice (back and forth), and broadens in the process. The central fringes are very bright – most of the light is reflected off of both slanted faces directly backwards, as discussed in the solution to part (c). These fringes are even brighter than the bright patterns in Configuration 2, because in this case the beam doesn’t split in two. This bright region of the reflected pattern is narrow, again due to the narrow diffraction pattern off of the broad slanted faces. Further to the sides, the dim interference pattern from the “peaks” and “valleys” becomes dominant. It is dimmer than in the transmission patterns, and fades away quickly, because it arises from weak reflection, as opposed to the total internal reflection from the slanted faces.
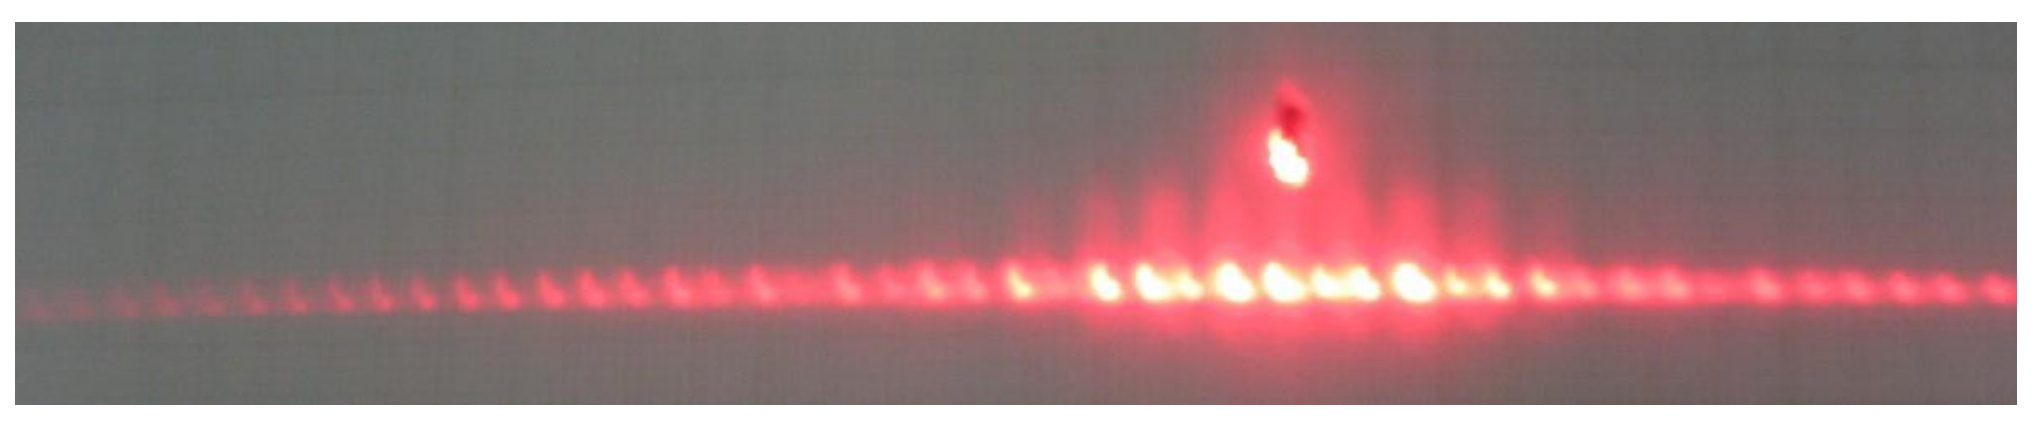
The dim interference pattern from the narrow “peaks” and “valleys” on the sample displays an alternating sequence of brighter and dimmer fringes, as described in the question text. If all the fringes are taken into account, their spacing corresponds to the sample’s spacing . The twice larger spacing between the brighter fringes corresponds to the spacing between each “peaks” and the adjacent “valley”. In other words, the dimmer fringes are due to destructive interference between a peak and its adjacent valley. Towards larger , the effect becomes less simple than just a factor-of-2, because then the vertical distance between the “peaks” and “valleys” must also be taken into account. As the sample is rotated, the brighter and dimmer fringes interchange, and at some orientations become equal in magnitude. This phenomenon is more pronounced in the transmission pattern, i.e. Configurations 2 and 3. In the reflection pattern, i.e. Configuration 1, it is pronounced towards the edges, where the light from the “peaks” and “valleys” becomes dominant. The central fringes in Configuration 1 remain fixed up to small changes in brightness, and their spacing corresponds to . The bright side fringes in Configuration 2 vary noticeably in brightness, due to the diffraction pattern from each slanted face.
It is likely that some of the dimmer fringes in the alternating sequence will not be visible. This results in a doubled, and sometimes tripled, spacing between the visible fringes. By rotating the sample and observing the alternating pattern, the student should learn to identify such doubled spacing, and take it into account when recording the fringe numbers .
In the reflection setup, rotation of the sample reveals a bright fringe moving across the screen. This fringe is of similar brightness to the central fringes of the interference pattern. It arises from light directly reflected from the sample’s flat side, without entering into the sample. The other bright fringes remain stationary as this fringe moves, because they arise from a double reflection, as discussed in parts (a) and (c). The single-reflection fringe can be used as an alignment indicator: at perpendicular illumination, it should fall back on the laser. This situation can only be extrapolated and not directly observed, because near the center the single-reflection fringe blends with the other bright fringes.
The reflection pattern has an advantage for measurements – the central fringes around are very bright and always visible, so there is no problem with counting the fringes consecutively, even in bright ambient illumination. On the other hand, it has some disadvantages – the overall pattern is narrower, while the individual fringes are broader. The reflection setup is also more difficult to align: to observe a high-quality pattern, the laser beam must pass through the hole in the screen without scattering off the sides, and then it must reach the sample. On the other hand, this provides better feedback: if a clean pattern is obtained, it means that the alignment is good. This reduces the eventual error.
In all three configurations, we need an indicator for the point , from which both and should be counted. In Configuration 1 (reflection), given proper alignment, this point is given by the source of the laser beam, at the center of the hole in the screen. In Configurations 2 and 3 (transmission), it can be found by illuminating the screen directly without the sample, and recording the beam’s location. Configuration 2 allows another method – to define as the midpoint between the two bright side patterns. See the solution to (k) for remarks on identifying the centers of these patterns.
When choosing the measurement points, one should choose the largest possible range for which the fringes can still be reliably counted. This will reduce the relative error in distance measurements. There is no need to record all the dozens of fringes in this range – a sample of 8 more-or-less evenly spaced points is enough.
In the white light measurements, it was clear that one must choose the largest possible distance to minimize the relative errors. With the laser light, a compromise must be struck between this consideration and the widening of the laser beam with distance.
In Table 1, we present sample measurements from a reflection pattern at a distance . The error in can be understood in two different ways. First, one may consider the error due to the width of each separate fringe. Since we are looking for the center of the fringes, this error is smaller than the fringe width itself. It may estimated for transmitted light as (same as the measurement resolution), and for reflected light as . On the other hand, one may consider the collective offset of all the fringes relative to the true point. This can be estimated as half the fringe spacing, which may as large as . All the above error estimations should receive full credit. The corresponding errors in , calculated as in eq. (1), range from to .
| (mm) | |||
|---|---|---|---|
| -29 | -262.5 | -21.93 | -0.3735 |
| -20 | -176 | -15.11 | -0.2606 |
| -10 | -86.5 | -7.56 | -0.1315 |
| -1 | -9 | -0.79 | -0.0138 |
| 1 | 9 | 0.79 | 0.0138 |
| 6 | 51 | 4.47 | 0.0780 |
| 11 | 95.5 | 8.33 | 0.1449 |
| 19 | 170 | 14.61 | 0.2523 |
| 25 | 230.5 | 19.47 | 0.3333 |
Table 1: Sample measurement results for part (i) from a reflection pattern at
j.
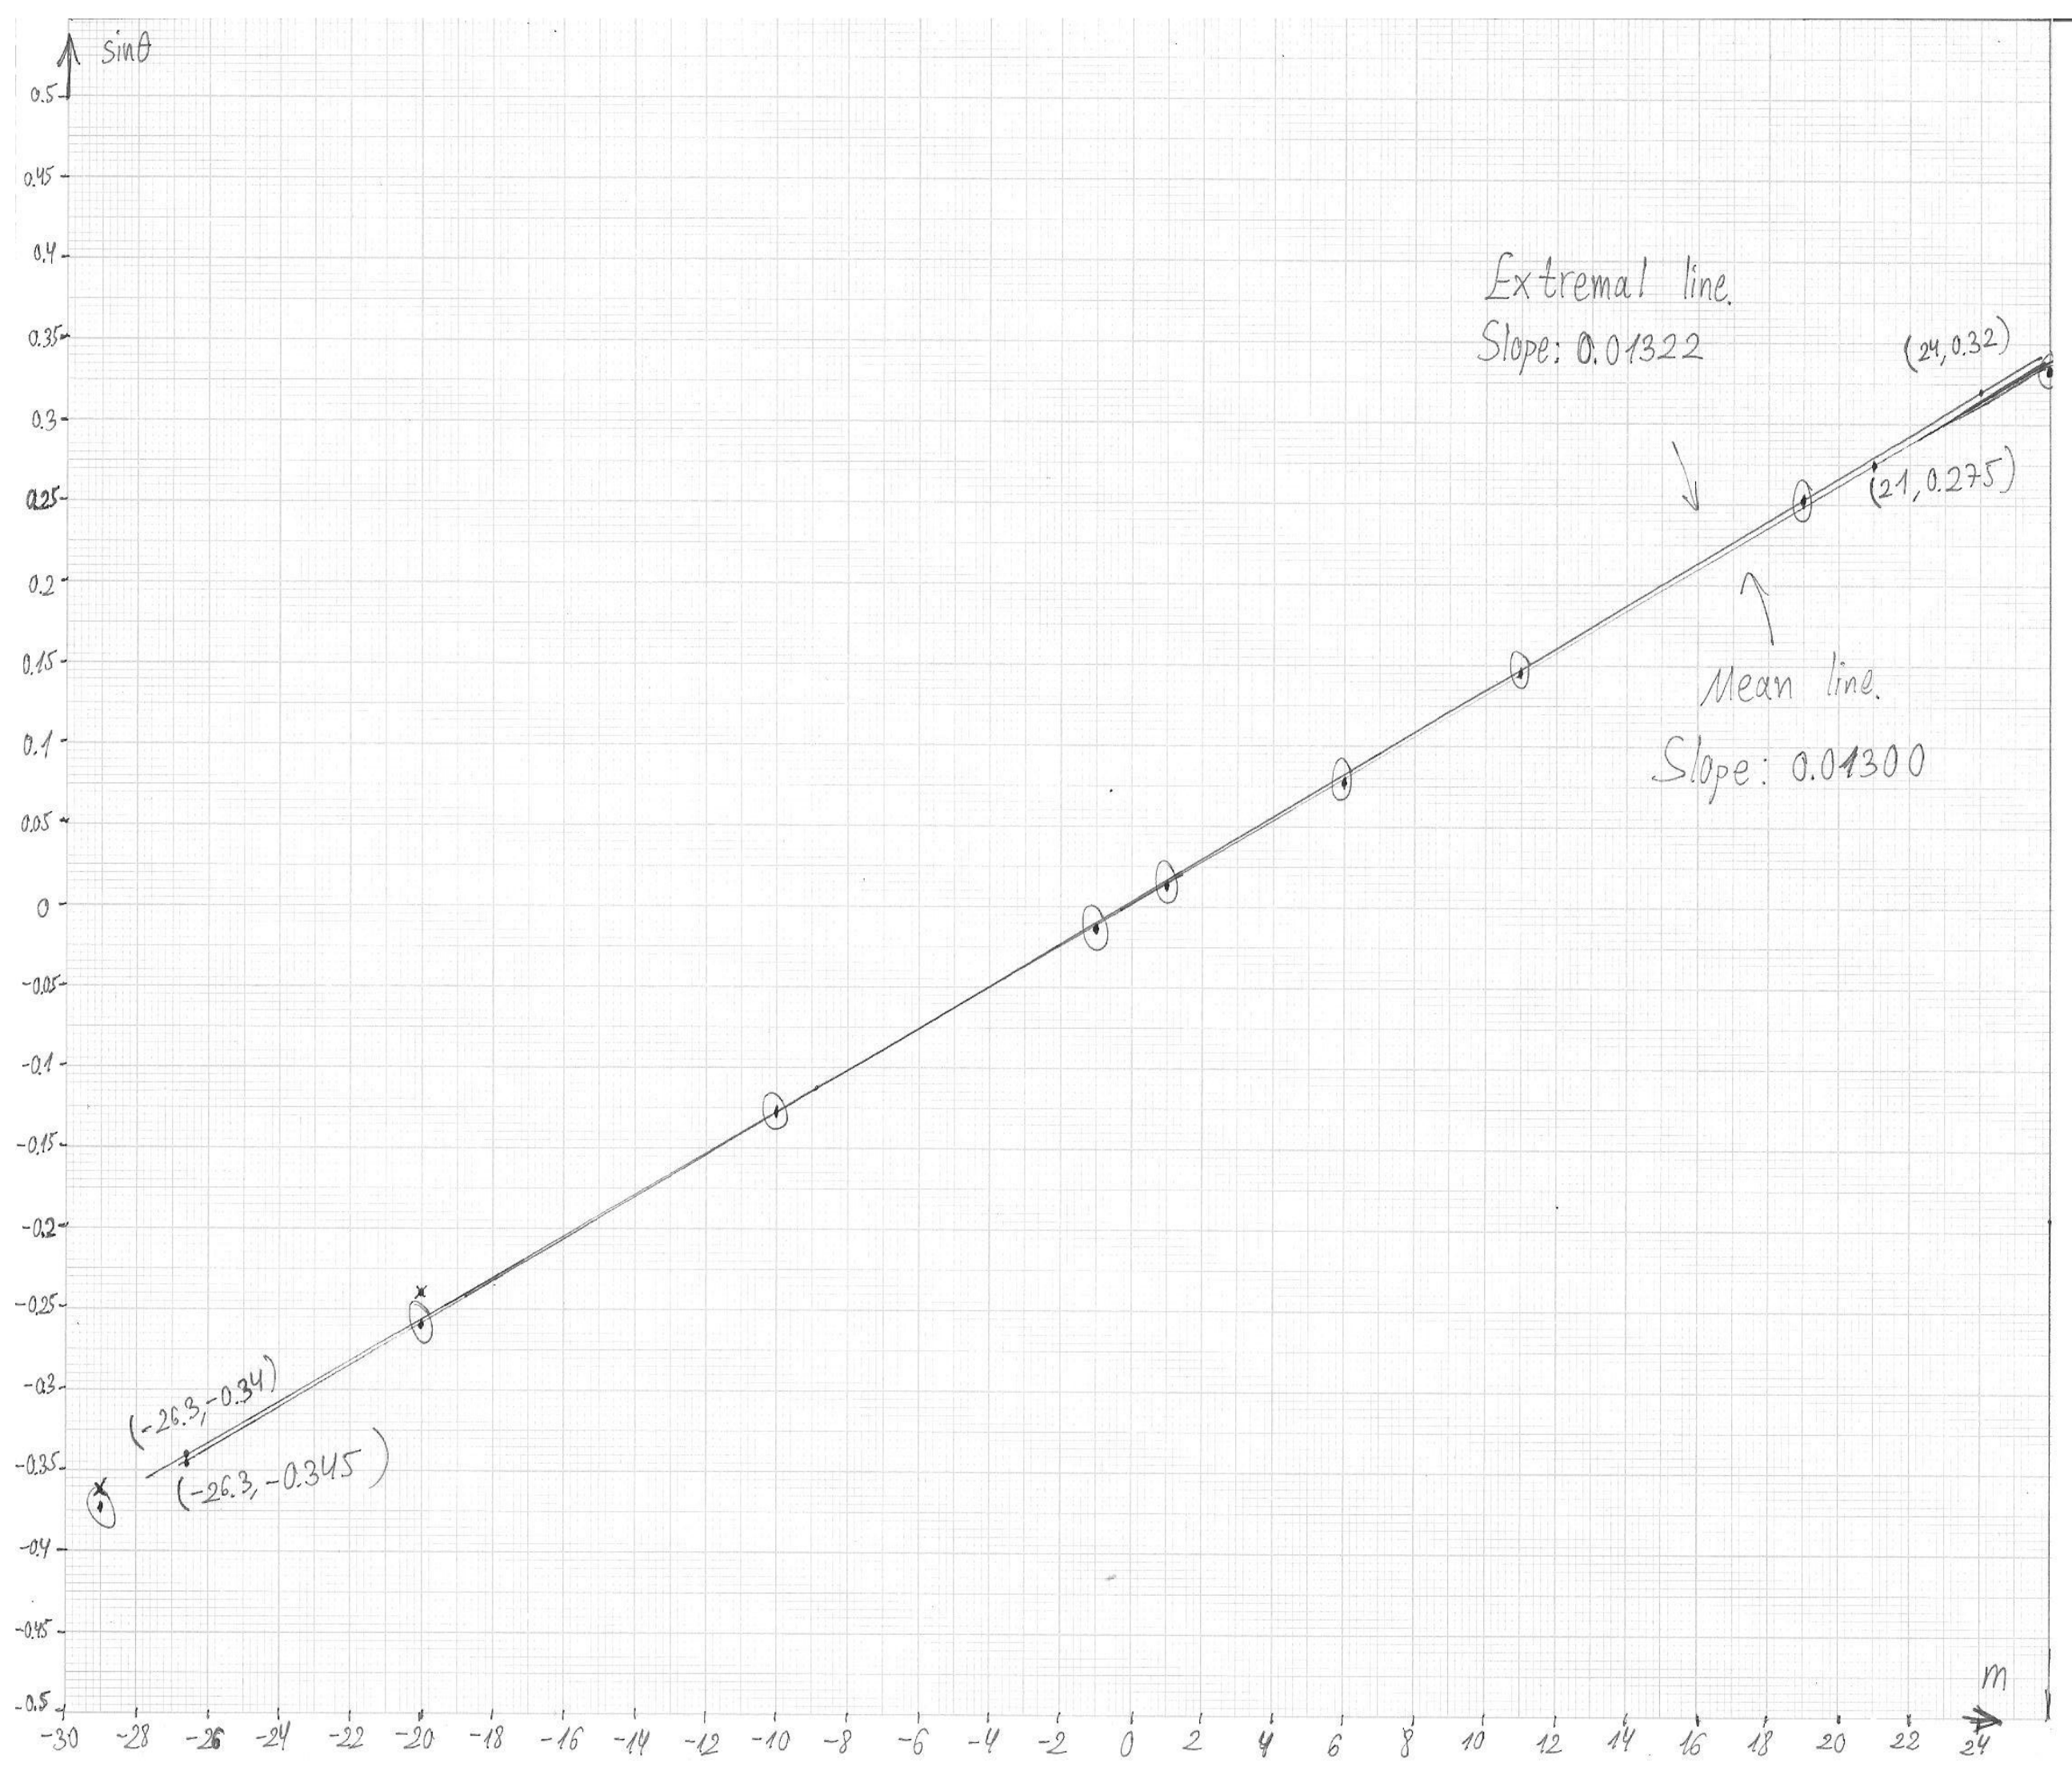
The student should use the relation and draw a linear graph of as a function of . The slope of this graph will be . The values of for our sample experiment are shown in Table 1. Deciding on the appropriate error bars is problematic. First, we have the wide range of possible error estimations for from part (i). Second, it’s difficult to estimate the relevance of the fringes’ collective offset for the graph’s slope. Therefore, error bars will not be graded.
The plot for our sample experiment is presented in Graph 1. Its slope reads:
This leads to the value for the spacing. The relative error in is dominant over the relative error in , so we have (1.5%).
A student who doesn’t take into account the doubled spacing between some of the fringes will get a less linear graph. A student who consistently uses the double spacing will get a linear graph, but his result for will be too small by a factor of 2.
k.
The student must use the bright patterns in the transmitted light (Configuration 2 or a rotated Configuration 3) to measure the deflection angle or . Instead of looking through the sample, the student must use the screen. The peculiarities of the alignment process were already discussed in part (i). If part (i) was carried out with transmitted light, one may keep the same alignment and distance to the screen.
The precise location corresponding to the desired deflection angle can be difficult to identify on the screen. The bright patches are several centimeters wide, and their center doesn’t necessarily lie on one of the interference fringes. However, there is an oval-shaped aura defining these patches, and the center can be identified as the point where this aura is broadest. Alternatively, one can try to move the interference fringes by slight rotations of the sample, and use them to probe the bright patch; for instance, its center can be estimated as the place where the brightest possible fringe is obtained.
As for white light, the more precise measurement is obtained for the minimal deflection angle . Unlike with the white light, a larger distance to the screen is not necessarily better, due to the broadening of the laser beam. In our sample experiment, we chose a moderate distance . Then instead of using the distance between the un-deflected beam and the beam at minimal deflection, we used the distance between the minimal deflections to the right and to the left. These two points were obtained by rotating the sample without changing any other element of the alignment. As a check, we in fact measured the distances and of the two points from the un-deflected beam, to see that they come out similar. The difference can then serve as an error estimate for .
The measurements from the sample experiment read:
From and , we derive , with an error . For , we get:
Calculating the error as in eq. (1), we get . This error is consistent with the scatter of several sample measurements.
Using eqs. (3) and (4) for the refractive index and its error, we get .
Marking scheme
| Part | Criterion | Points | Details |
|---|---|---|---|
| a) 0.4 | Writing the reflection law | 0.1 | |
| Correct result | 0.3 | ||
| b) 0.5 | Correct answer | 0.5 | |
| c) 0.8 | Value of | 0.6 | Partial credit for corresponding to the edge of the reflection pattern – 0.2 |
| Error estimation | 0.2 | – – Full credit of 0.2; – – Partial credit of 0.1 | |
| d) 0.5 | Correct answer | 0.5 | |
| e) 1.4 | Measuring the distance between the sample and the bench | 0.1 | |
| Choosing a large enough distance | 0.3 | At least 70cm – 0.3; 25cm–69cm – 0.1 | |
| Distance between two positions of the stake (or equivalent) | 0.1 | ||
| Calculating from measurements | 0.1 | ||
| Value of | 0.7 | – – 0.7; – – 0.5; – – 0.3; – – 0.1 | |
| Error estimation | 0.1 | ||
| f) 1.4 | Measuring the distance between the sample and the bench | 0.1 | |
| Choosing a large enough distance | 0.3 | At least 70cm – 0.3; 25cm–69cm – 0.1 | |
| Distance between two positions of the stake (or equivalent) | 0.1 | ||
| Calculating from measurements | 0.1 | ||
| Value of | 0.7 | – – 0.7; – – 0.5; – – 0.3; – – 0.1 | |
| Error estimation | 0.1 | ||
| g) 0.8 | Writing equations for | 0.2 | |
| Extracting an expression for | 0.4 | ||
| Using the correct angle of the prism | 0.2 | ||
| h) 0.7 | Value of | 0.3 | 1.601–1.607 – 0.3; 1.595–1.613 – 0.2; 1.574–1.634 – 0.1 |
| Error calculation | 0.3 | ||
| Value of the error | 0.1 | ||
| i) 1.0 | Measured distance to the screen | 0.1 | |
| Large enough range of points on the screen | 0.3 | At least 20cm – 0.3; 15cm–19cm – 0.2; 10cm–14cm – 0.1 | |
| Enough fringes | 0.2 | At least 8 fringes – 0.2; 6–7 fringes – 0.1 | |
| Correct counting | 0.2 | ||
| Converting distances to angles | 0.2 | ||
| Penalty for no errors in measurements | -0.1 | ||
| Penalty for no errors in | -0.1 | ||
| j) 1.5 | Graph | 0.5 | Correct axes (e.g. vs. ), properly marked – 0.1; Reasonably linear – 0.3; Efficient use of the graph paper’s area – 0.1 |
| Finding the slope | 0.1 | ||
| Error of the slope | 0.1 | ||
| Result for | 0.6 | 49.3μm–50.7μm – 0.6; 48.5μm–51.5μm – 0.4; 47μm–53μm – 0.2 | |
| Calculation of error in | 0.1 | ||
| Value of error in | 0.1 | ||
| k) 1.0 | Measuring the deflection angle | 0.3 | Measuring the distance along the screen or counting fringes – 0.1; Deducing the angle – 0.2 |
| Value of | 0.5 | 1.577–1.581 – 0.5; 1.573–1.585 – 0.3; 1.567–1.590 – 0.2; 1.550–1.610 – 0.1 | |
| Calculation of error in | 0.1 | ||
| Value of error in | 0.1 |
Оригинал в Архива: exp2.pdf · официални решения: exp2_sol.pdf · допълнителни данни: exp2_marking.pdf · допълнителни данни: exp2_anssheet.pdf