Съдържание
УсловиеExperiment A — Measurement of the Frequency of Ultrasonic Waves using the Diffraction Method (6,5 т.)Experiment B — Measurement of the Frequency of the Ultrasonic Waves using the Projection Method (6 т.)Experiment C — To determine the Salt Concentration of a Solution (5 т.)Experiment D — Measurement of Speed of Sound in Corn-Syrup Solution (2,5 т.)РешениеAPhO 2014, Експеримент — Задача 1. Speed of Ultrasonic Sound in Solution
Experimental Competition — Speed of Ultrasonic Sound in Solution · 15 май 2014 г. · 20 т.
Внимание: Бележка към темата
One complete original experiment with four connected native sections A–D and 17 parts. The obtained blank answer-sheet cover prints A 6.5 / B 6.0 / C 5.0 / D 2.5 / total 20.0. All 14 question, 22 Marking Rubric and 21 blank answer/writing-sheet pages are covered. Printed scientific, table and page-reference differences remain attributed locally. The problem number 1 is a structural ordinal; no task number is printed on the singular Experiment Problem cover.
Native experimental cover and instructions
Experimental Competition — May 15, 2014, 0830–1330 hrs. 15th Asian Physics Olympiad, 11th–18th May 2014, Singapore. The question cover says “Experiment Problem”, has four blank Student Code boxes, and states: “There are 14 pages including the cover page.”
May 15, 2014 (Thursday). Please first read the following instructions carefully:
- The time available is 5 hours for the experimental problem.
- Use only the pen and equipment provided.
- There is a set of Answer Sheets in which you have to enter your data and results.
- Write down your Student Code in the boxes at the top of each Answer Sheets and additional sheets which you submit.
- Additional Writing Sheets are provided.
- If you use any additional Writing Sheets, please write down your Student Code, the Question Number and the Page Number on these additional Writing Sheets.
- If you use additional Writing Sheets that you do not wish to be marked, put a large ‘X’ across the entire sheet.
- You should use mainly equations, numbers, symbols, graphs, figures and as little text as possible in your answers. Use the symbols defined in the question.
- At the end of the experiment arrange all sheets in the following order: a. Main Answer Sheets; b. Used Writing Sheets; c. Writing sheets which are marked with ‘X’; d. Unused Writing Sheets; e. The question paper.
- Put all the papers inside the envelope and leave the envelope on your desk.
- You are not allowed to take any sheet of paper or any material used in the experiment out of the room.
Условие
1. Introduction:
Ultrasonic sound waves have many applications in industry, for non-destructive testing, sonar, medical imaging, etc. The acousto-optic effect is extensively used in the study of ultrasonic waves. Acousto-optic devices are now utilized in modulation, signal processing and frequency shifting of light beams. With the availability of lasers, the acousto-optic effect can be readily observed. In addition, development of high frequency piezoelectric transducers can be utilized to generate acousto-optic effects.
In this APhO2014 experiment, we shall embark on a journey to probe the properties of sound travel in selected solutions:
(i) using the acousto-optic effect in the Raman-Nath diffraction regime, and
(ii) by direct visualization of the standing waves.
In addition, we shall also learn that very interesting experiments can be performed by making use of simple and economical items that are easily available.
2. Safety Precautions and General Advice:
(1) Do not stare into the laser beam directly.
(2) The Piezoelectric Transducer should be switched ON only after being securely placed inside the water in the glass cell.
(3) Do not dip your hand into the water filled glass cell if the Piezoelectric Transducer is switched ON.
(4) Be careful not to spill the water, especially onto the electrical power socket.
(5) Handle the glass container and the lab-jacks safely.
(6) Do not drink/consume any of the materials provided for the experiment.
(7) Wear the laser safety goggles whenever the laser is ON.
(8) Switch off the laser pointer when it is not in use to avoid unnecessary draining of battery.
(9) Switch off the piezoelectric transducer if it is not in use to avoid the heating of water. The speed of sound in water changes with temperature.
(10) You are provided with a plastic folder to keep your question paper and answer sheets to protect the papers from water.
(11) As there is limited space on the working table, store unused equipment in the box and keep that on the floor.
(12) You are provided with three Glass Cells and you can use a new one when moving from experiment to the next.
3: Apparatus
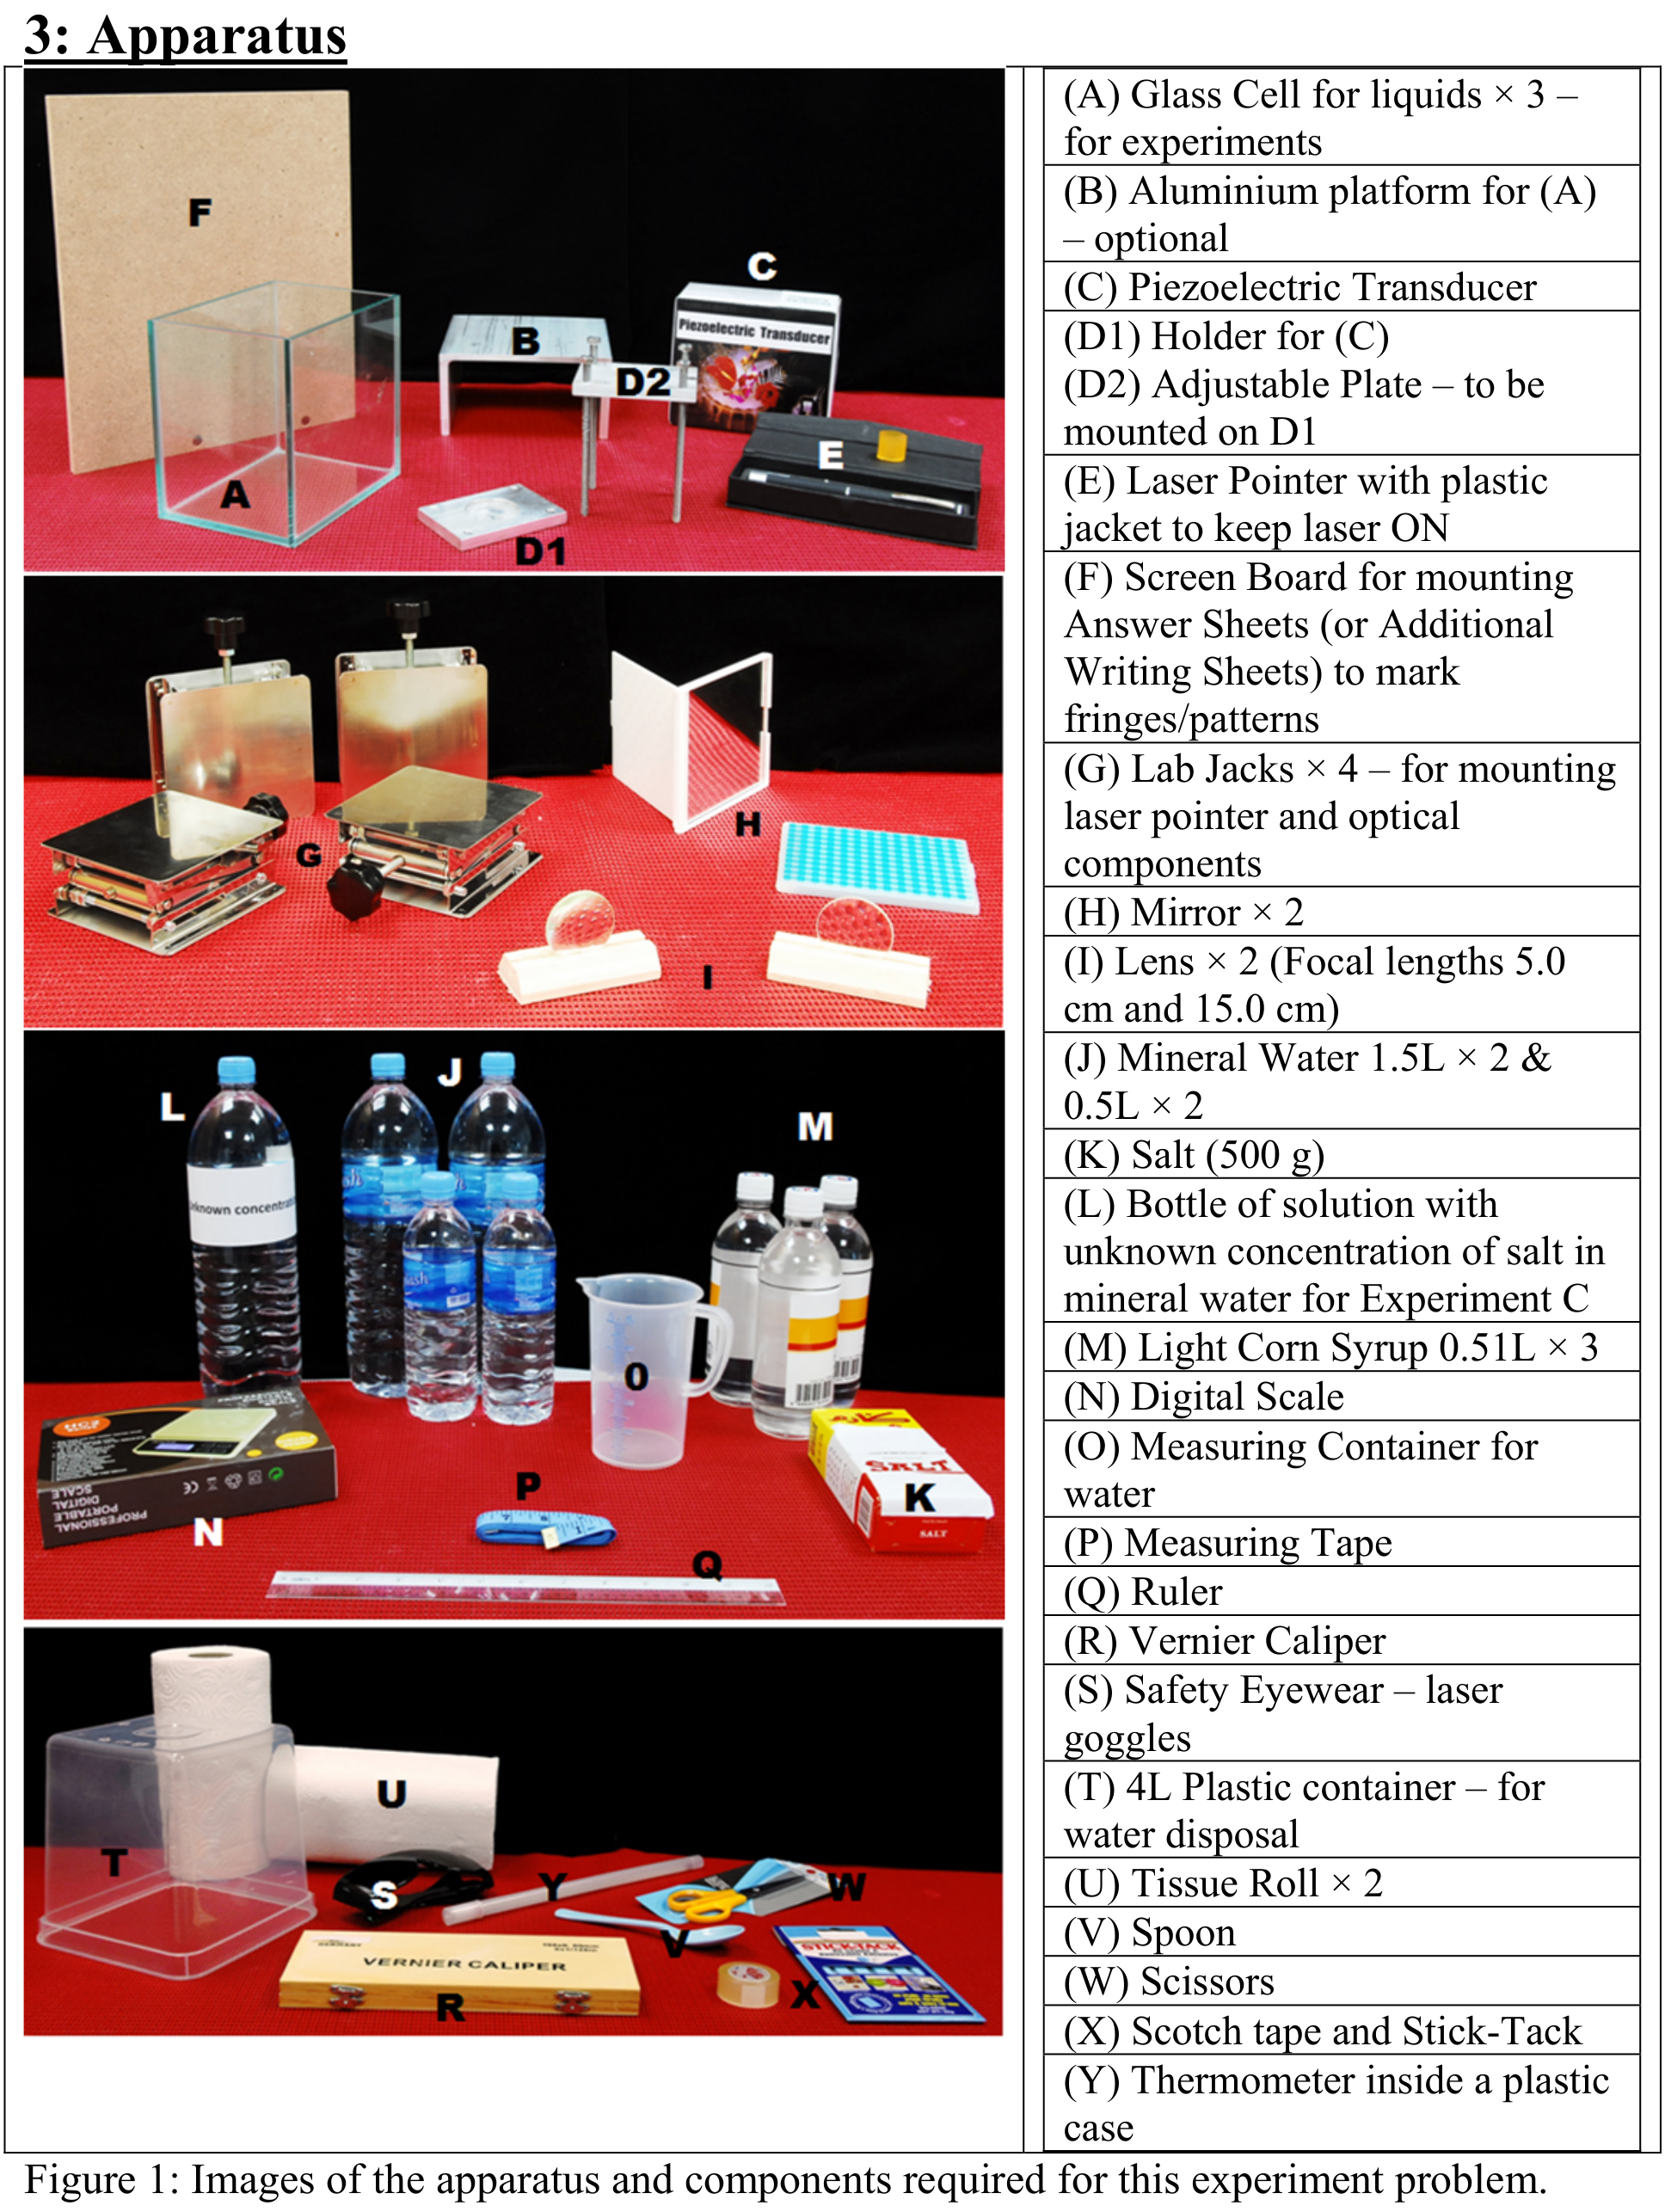
| Label | Apparatus and components |
|---|---|
| A | Glass Cell for liquids × 3 – for experiments |
| B | Aluminium platform for (A) – optional |
| C | Piezoelectric Transducer |
| D1 | Holder for (C) |
| D2 | Adjustable Plate – to be mounted on D1 |
| E | Laser Pointer with plastic jacket to keep laser ON |
| F | Screen Board for mounting Answer Sheets (or Additional Writing Sheets) to mark fringes/patterns |
| G | Lab Jacks × 4 – for mounting laser pointer and optical components |
| H | Mirror × 2 |
| I | Lens × 2 (Focal lengths 5.0 cm and 15.0 cm) |
| J | Mineral Water 1.5L × 2 & 0.5L × 2 |
| K | Salt (500 g) |
| L | Bottle of solution with unknown concentration of salt in mineral water for Experiment C |
| M | Light Corn Syrup 0.51L × 3 |
| N | Digital Scale |
| O | Measuring Container for water |
| P | Measuring Tape |
| Q | Ruler |
| R | Vernier Caliper |
| S | Safety Eyewear – laser goggles |
| T | 4L Plastic container – for water disposal |
| U | Tissue Roll × 2 |
| V | Spoon |
| W | Scissors |
| X | Scotch tape and Stick-Tack |
| Y | Thermometer inside a plastic case |
Experiment A — Measurement of the Frequency of Ultrasonic Waves using the Diffraction Method (6,5 т.)
When sound waves are travelling in a medium, it gives rise to pressure fluctuations resulting in the variation in the refractive index of the medium. Under the appropriate conditions, sound waves produce a moving periodic refractive index grating in the materials and this grating can be detected optically. This is known as acousto-optic effect. Debye and Sears, in 1932, were one of the first to demonstrate the diffraction of light by this moving periodic refractive index grating. Detailed theoretical treatment was formulated by Raman and Nath in 1935.
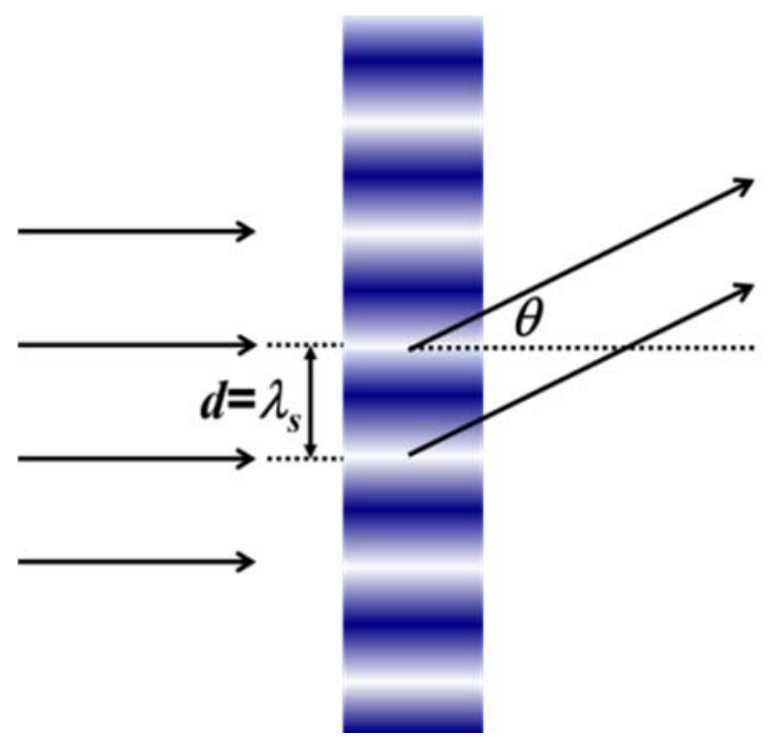
As shown in Figure 2, a light beam is diffracted by the moving periodic refractive index grating. The diffracted light follows the grating equation
where is the grating element, is the diffraction angle, is the order of diffraction, and is the wavelength of the light in the medium.
According to Raman and Nath, the grating element is equal to the wavelength, , of the ultrasonic wave in the medium as shown in Figure 2.
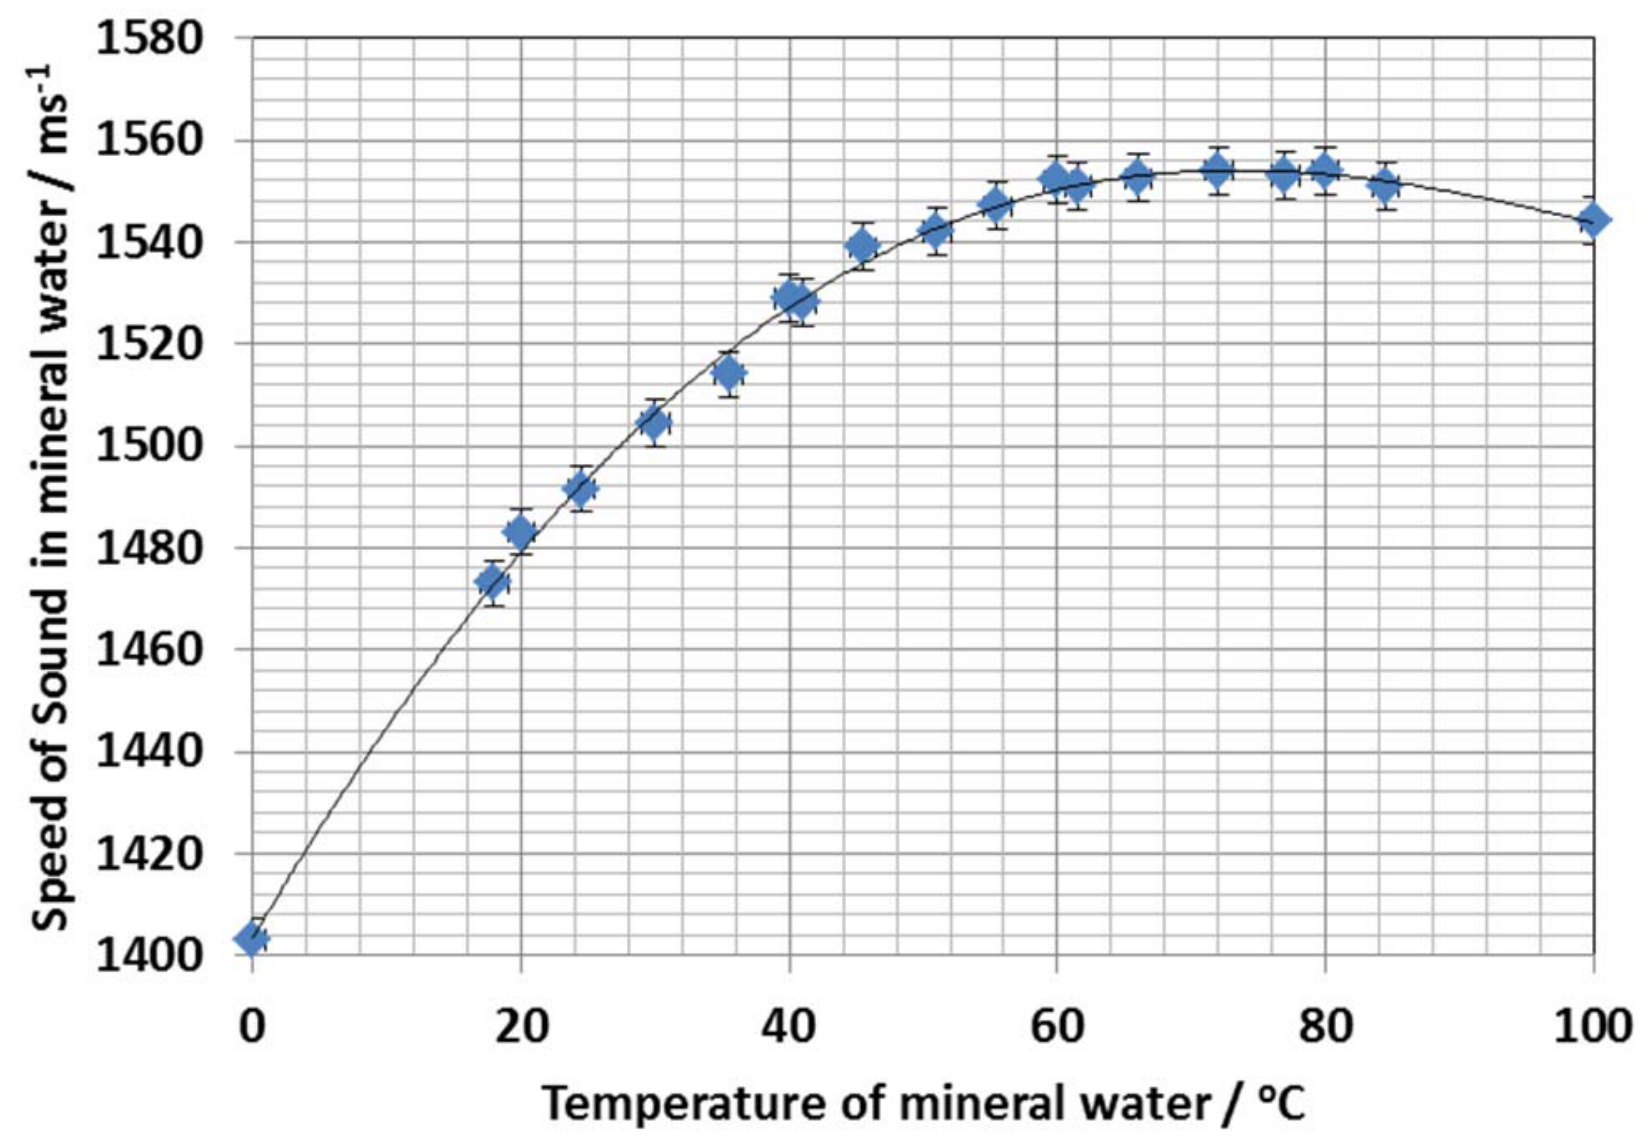
In this experiment, the diffraction method will be employed to measure the frequency of the ultrasonic waves generated by a Piezoelectric Transducer (C) using the known value of speed of the sound in mineral water. Figure 3 shows the speed of sound in mineral water as a function of temperature.
The Piezoelectric Transducer (C) is positioned in the circular slot of the Holder (D1) placed in the Glass Cell (A) filled with 1.5L of mineral water. Upon switching on the transducer, a vertical moving periodic refractive index grating is established in water as shown in Figure 4(a). For experiment A, please ensure that the Plate (D2) is positioned above the water level as it is only used to avoid splashing. A laser beam incident perpendicular to the grating results in the formation of the diffraction fringes. At sufficiently large distance from the grating, clearly distinguishable fringes can be formed on the screen (F) for measurement and analysis, as described in Figure 4(b).
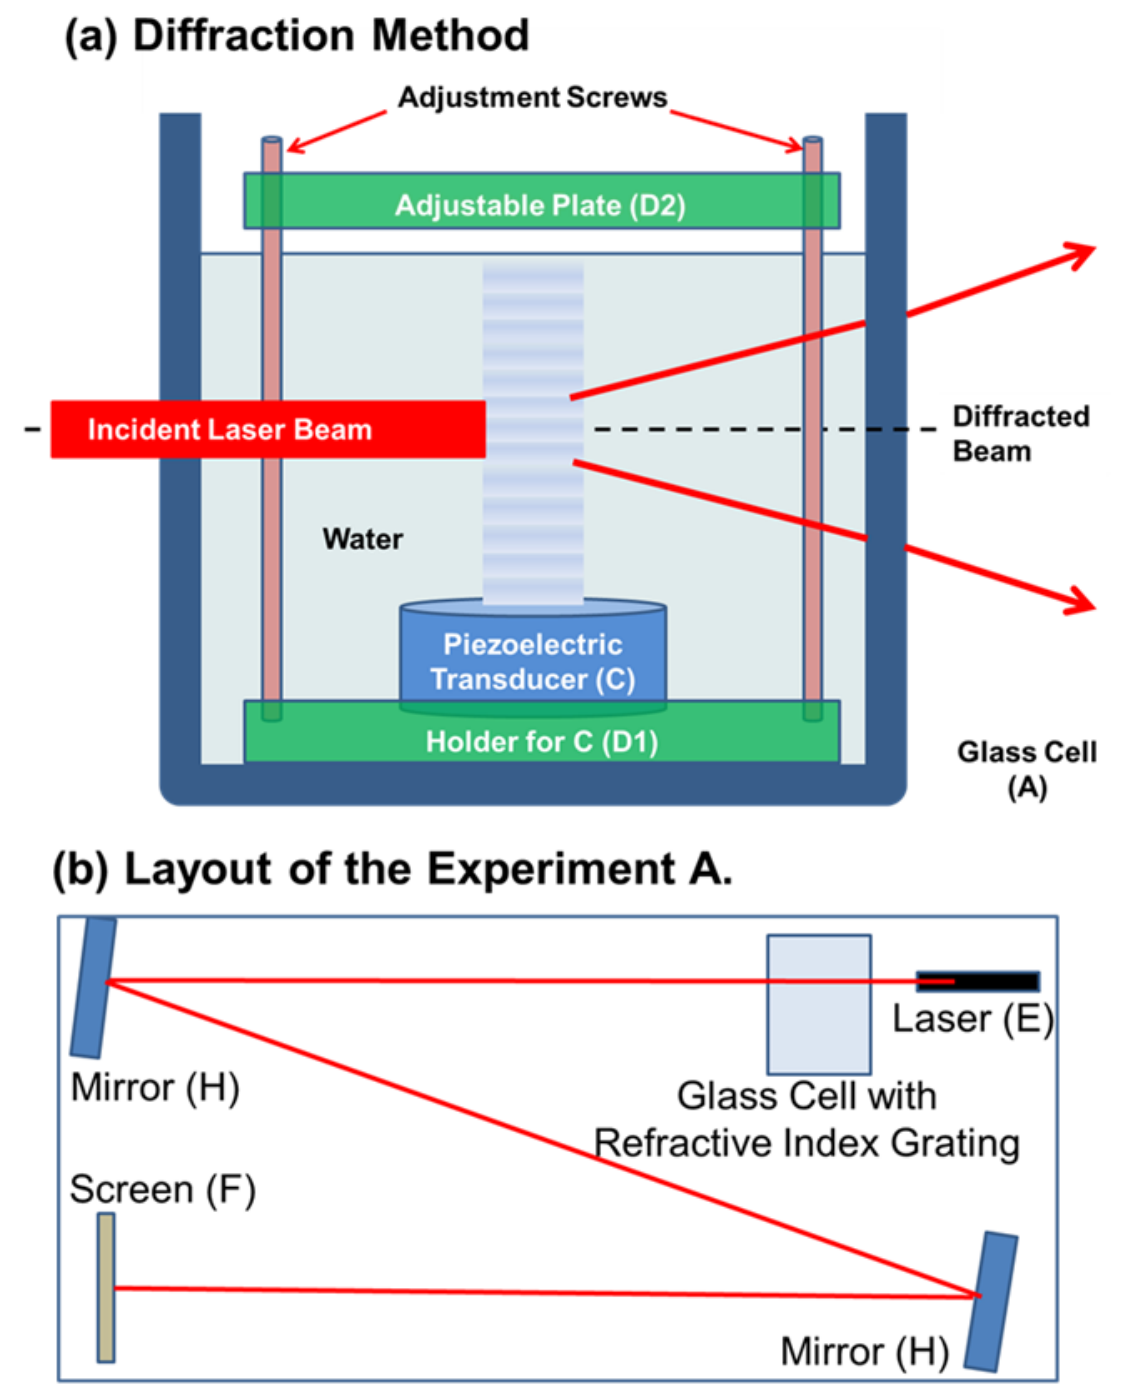
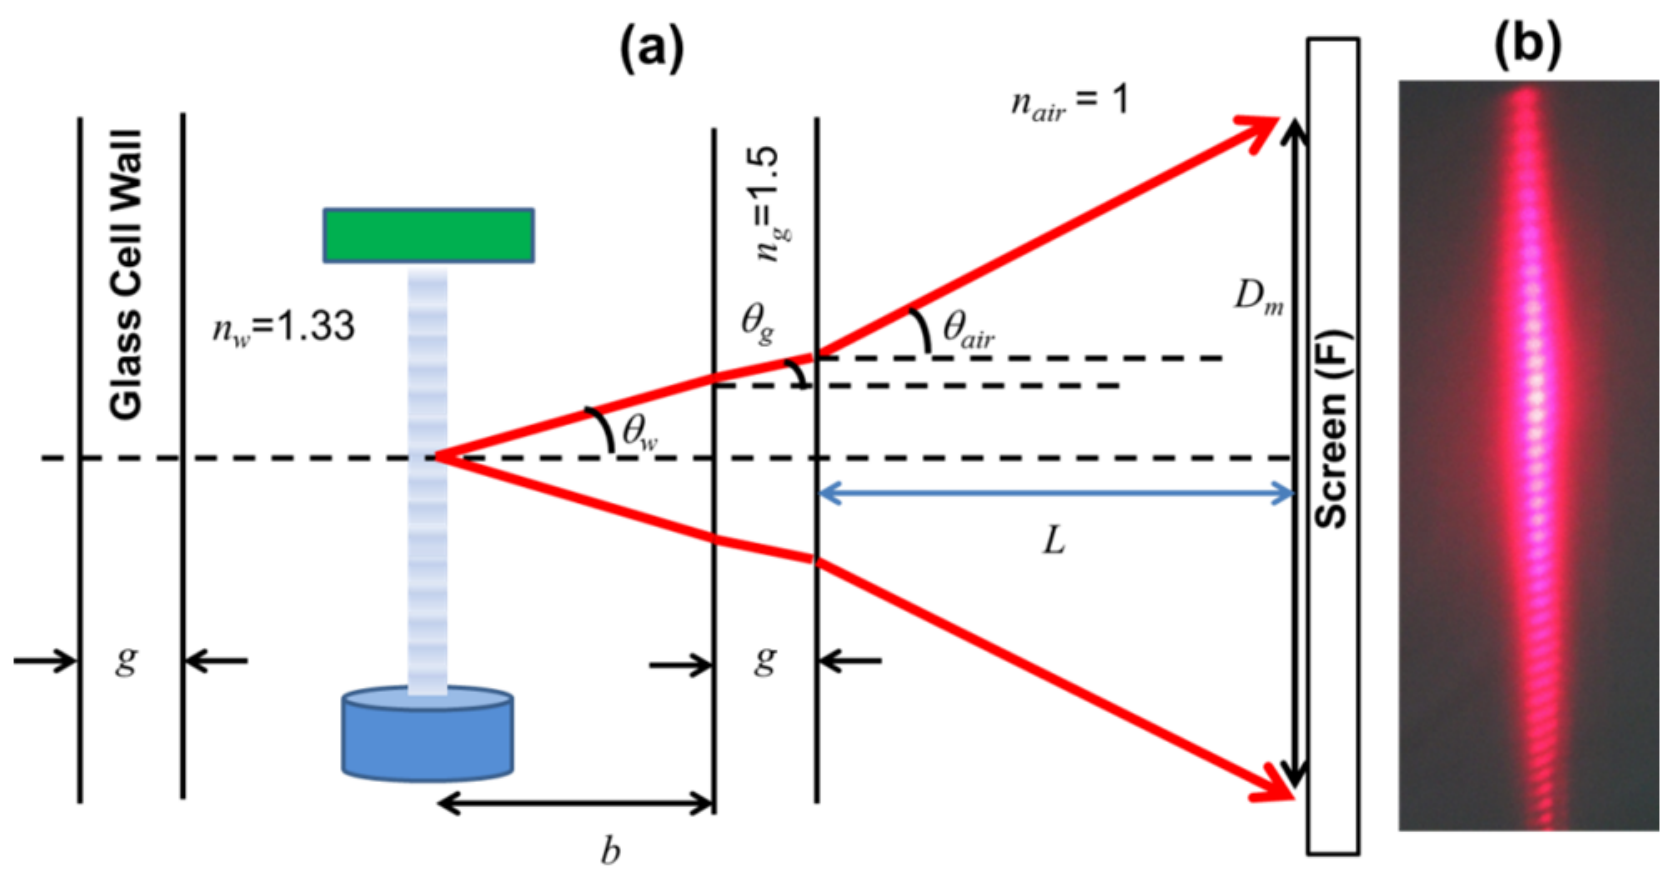
The calculation of the frequency of ultrasonic waves generated by the Piezoelectric Transducer in mineral water requires the determination of the wavelength of sound in water, , first. Using equation (1) and Figure 5, which shows all relevant parameters, answer Question A1.
A1 An expression for is given in equation (2) under the small angle approximation.
Derive an expression for in terms of , and : Here
is the wavelength of the ultrasonic wave in water,
is the distance from the center of the grating to the inner wall of the glass cell,
is the thickness of the wall of the glass cell,
is the total number of diffraction fringes counted on screen,
and are the refractive indices of water, glass and air, respectively,
is the distance from the wall of the glass container to screen,
is the wavelength of laser light in air, and
is the spread of diffraction fringes on the screen. [1,5 т.]
Now set up the experiment taking hints from the schematics shown in Figure 4 and 5. Do put in effort to generate as many fringes as you can. For this part you are required to mount Answer Sheet A2 on the Screen (F) to record the diffraction fringes. As the laser beam profile may not be perfectly symmetric, you should rotate the laser to get the best possible fringes. Keep your work neat and clean. Since the speed of sound in water depends on the temperature of the water, the temperature should be monitored during the experiment. You are provided with a plastic folder to keep your question paper and answer sheets to protect the papers from water spillage.
A2 Mark all fringe patterns you measure on the Answer Sheet A2. Write clearly the number of fringes counted, , and the spread of the fringes. Note down the temperature of the mineral water.
Do not forget to note down the relevant experimental parameters, in Answer Sheet A3 as well, needed for calculations. [2,5 т.]
Note: Whenever you have completed the marking of the fringes, please switch off the Piezoelectric Transducer (C) and the Laser Pointer (E) while you are working on data analysis and calculations.
For the following questions you may use:
Figure 3 to determine the speed of sound in mineral water.
Note: For your error analysis, to simplify your calculation, you may neglect the uncertainties in and .
A3 Measure and record all relevant parameters in Answer Sheet A3 and calculate the wavelength of sound, , in mineral water. [1 т.]
A4 Calculate and record the frequency of ultrasonic waves, , in mineral water. [0,5 т.]
A5 Carry out an error analysis to estimate the uncertainty in . [1 т.]
Experiment B — Measurement of the Frequency of the Ultrasonic Waves using the Projection Method (6 т.)
In Experiment B a different method, called Projection Method, will be used to measure the frequency of ultrasonic waves in mineral water by directly visualization. To do this a standing wave pattern is setup in mineral water by using the Adjustable Plate (D2) as ultrasonic wave reflector. The superposition of the travelling waves, from the piezoelectric transducer and the adjustable reflector plate, moving in opposite directions generates a standing wave pattern. Figure 6 shows the schematic of projection method setup. As shown in schematic, a Lens (I) is inserted between the Laser (E) and the wall of the Glass Cell (A). The standing wave pattern in the glass cell is then projected onto the screen with a magnification, .
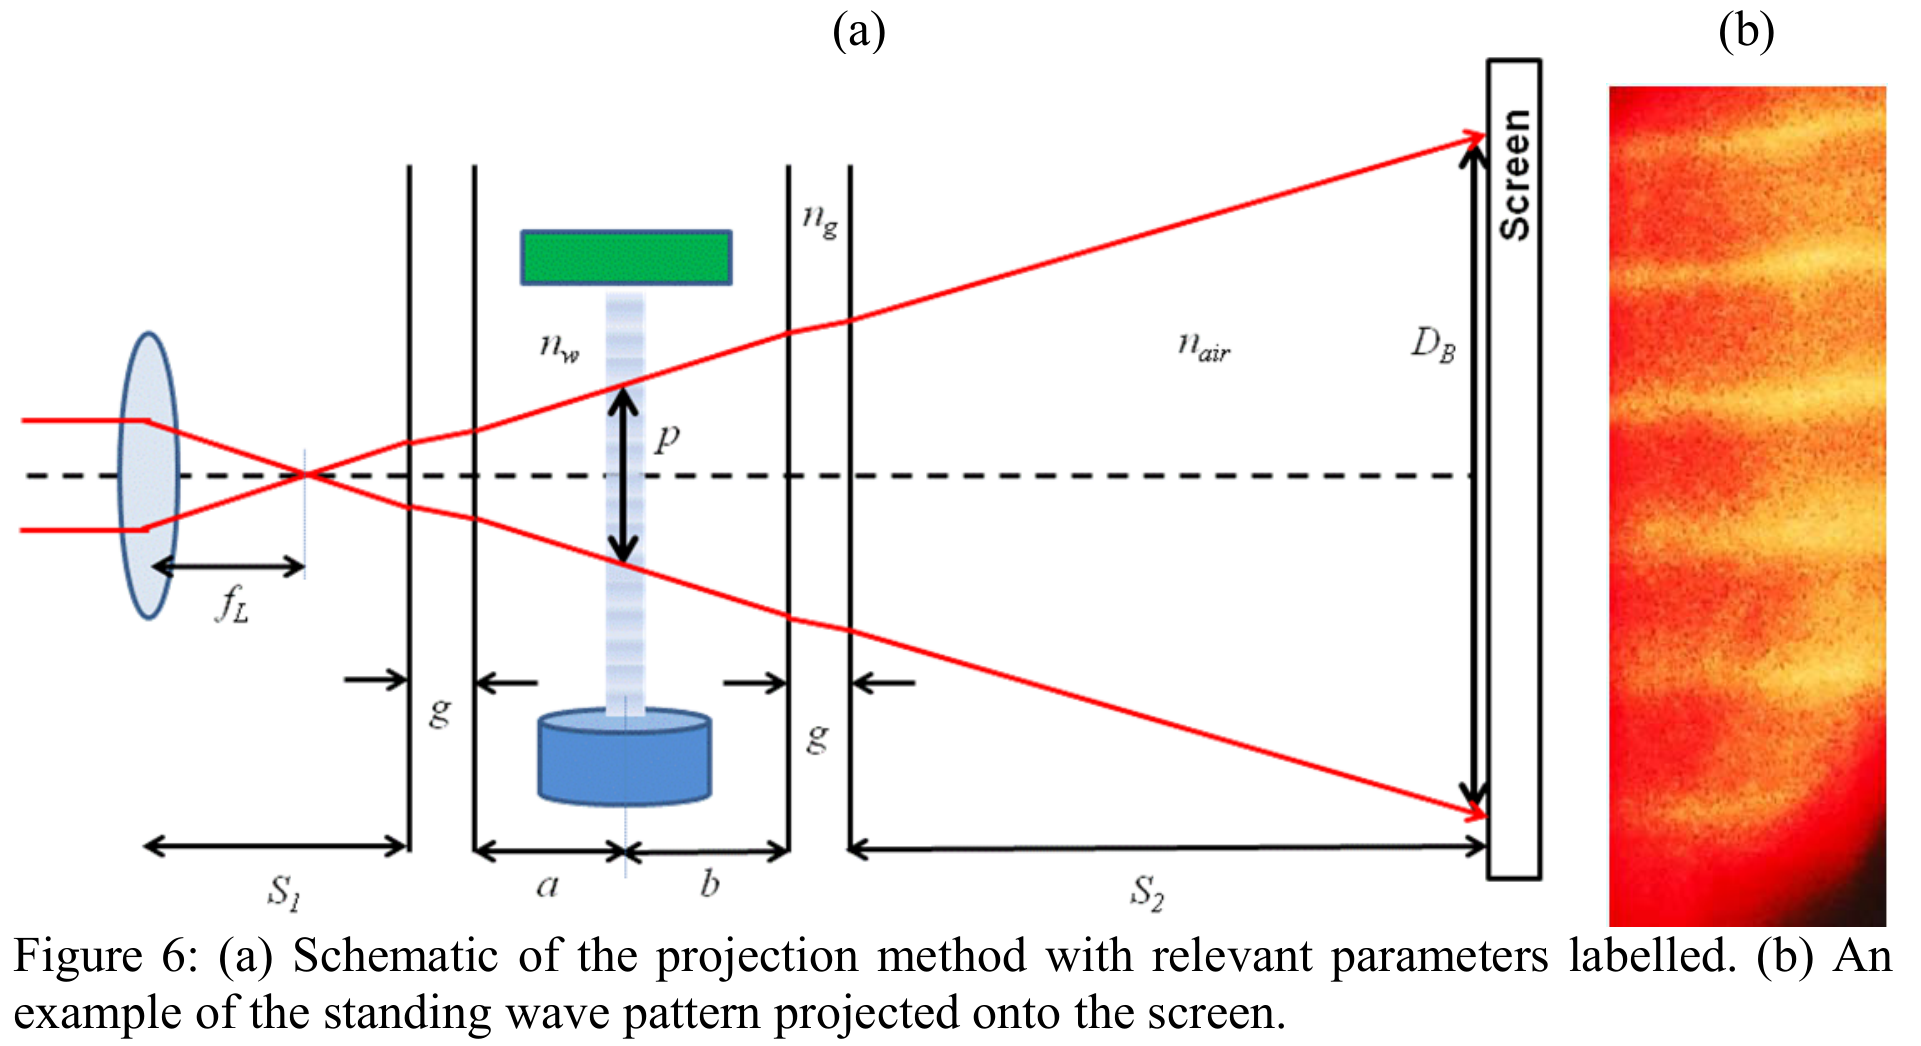
The magnification, , of the region on screen (F) in terms of the parameters shown in Figure 6 is given by equation (3)
Here
is the distance from the center of the lens to the outer wall of the glass cell,
is the distance from the outer wall of the glass cell to the Screen (F),
is the focal length of the lens,
is the distance from the center of the grating to the left inner wall of the glass cell,
is the distance from the center of the grating to the right inner wall of the glass cell,
is the thickness of the wall of the glass cell,
is the refractive index of water,
is the refractive index of glass, and
is the refractive index of air.
The bright and dark regions in the projected pattern are related to the nodes and antinodes of the standing wave pattern.
B1 Assume that the number of bright regions counted within the length on screen is .
Use equation (3), to write the expression for in terms of measurable and given parameters. [1 т.]
Now set up the experiment taking hints from the schematic shown in Figure 6. For this part you are required to mount Answer Sheet B2 on the Screen (F) to record the projected standing wave pattern.
Some recommendations for the experimental procedure are:
- To obtain a standing ultrasonic wave for the projection method, submerge the adjustable plate (D2) into the water.
- Carefully adjust the leveling screws, to obtain a stable and well defined pattern as shown in Figure 6(b).
- Two lenses of focal lengths 5.0 cm and 15.0 cm are provided. Use only one of these lenses for Experiment B.
B2 Mark the projected standing wave patterns on the Answer Sheet B2. Write clearly the number of bright regions counted, , and the corresponding spread . Note down the temperature of the mineral water.
Do not forget to note down the relevant experimental parameters, in Answer Sheet B3 as well, needed for calculations. [2 т.]
B3 Measure and record all relevant parameters in the Answer Sheet B3 and calculate the wavelength of sound, , in mineral water. [1,5 т.]
B4 Calculate and record the frequency of ultrasonic waves, , in mineral water. [0,5 т.]
For your error analysis in the next part, to simplify your calculation, you may neglect the uncertainties in and .
B5 Carry out an error analysis to estimate the uncertainty in . [1 т.]
Experiment C — To determine the Salt Concentration of a Solution (5 т.)
In this experiment, you are provided with a bottle (L) labeled as “Unknown Concentration” that contains salt solution with an unknown amount of salt dissolved in mineral water. The aim of Experiment C is to determine the concentration of the salt solution.
The approach in this method is to dissolve increasing and known amounts of salt into 1.5 liters of mineral water in the Glass Cell (A) and subsequently measure the speed of sound in water with the known salt concentration using the frequency of ultrasonic waves determined in Experiment A or B. After dissolving a known amount of salt into the water, measure the speed of sound in the salt solution using ONLY one of the two methods described in Experiment A and Experiment B.
You will need to plot a graph of the speed of sound versus the concentration of the salt solution (where is the mass of salt dissolved in water divided by combined mass of water and salt). This shall be your calibration curve.
Then proceed to measure the speed of sound in solution with an unknown amount of salt dissolved in mineral water (L) labeled as “Unknown Concentration” and use your calibration curve to determine the salt concentration in the unknown solution.
Assume that the refractive index of salt solution changes negligibly as salt is added and its value can still be taken as .
For Experiment C, make ONLY one measurement corresponding to each of the different salt concentrations.
Remember to switch OFF the Piezoelectric Transducer and the Laser Pointer when they are not in use.
You are required to mount Answer Sheet C1 on the Screen (F) to record the observed pattern.
C1 Mark the observed patterns on Answer Sheet C1 for each known salt concentration used. Label each recorded pattern with the corresponding salt concentration. Do not forget to note down the relevant experimental parameters, in Answer Sheet C2, needed for calculations.
If additional sheets are needed for marking then please use Writing Sheets. [1 т.]
C2 Measure and record all relevant parameters in answer sheet and calculate the speed of sound, , in each of the known salt concentrations. [2 т.]
C3 Plot the speed of sound, , in solution against the salt concentration, , of the solution. Include error bars, assuming that the percentage error is the same as that obtained in Experiment A or Experiment B, for each data point. [1 т.]
Now perform the experiment to determine the unknown salt concentration, , of the solution labeled as “Unknown Concentration” (L).
C4 Mark the observed pattern on Answer Sheet C4 for unknown salt concentration solution. Note down the temperature of the solution.
Note down the relevant experimental parameters, in Answer Sheet C4, and calculate the speed of sound, , in this solution. [0,8 т.]
C5 Determine the salt concentration in the unknown solution. Write down your answer along with the uncertainty in the Answer Sheet C5. [0,2 т.]
Experiment D — Measurement of Speed of Sound in Corn-Syrup Solution (2,5 т.)
In this experiment, you are provided with corn-syrup solution (M) which you should pour in one of the new Glass Cells (A).
The speed of sound in corn-syrup solution will be measured using Diffraction Method illustrated in Experiment A. However, to calculate the speed of sound the refractive index of corn-syrup needs to be determined first.
Using the resources provided, design and carry out an experiment to determine the refractive index of the corn-syrup.
D1 Draw a labeled sketch of the experiment you have designed.
Carry out this experiment, record relevant parameters need and calculate the refractive index of the corn-syrup. [1,5 т.]
Now set up the experiment for the diffraction method of Experiment A to determine the speed of sound in corn-syrup.
D2 Mark the fringes on the Answer Sheet D2.
Measure and note down all relevant parameters needed to calculate the speed, , of sound in corn-syrup solution. [1 т.]
No error analysis is needed for Experiment D.
----End of Paper----
Решение
Marking Rubric — Experimental Competition, May 15, 2014, 0830–1330 hrs. The worked answer sheets identify Country and Student Code as “Sample Solution”. The separate obtained blank answer-sheet companion supplies forms and writing sheets; it does not supply these measured sample values. The repeated primary Figure 5 on key page 2 is represented by the complete primary Figure 5 retained above.
A1
Native key A1 prompt: In the space below, derive an equation for in terms of under small angle approximation condition.
Given,
Also we know,
Raman and Nath condition:
Snell’s Law: water to glass
Snell’s Law: glass to air
From above Figure [the original key repeats primary Figure 5],
Using small angle approximation:
From Eqns (6) and (7),
Writing and in terms of from equations (4) and (5),
Substituting from equations (1), (2) and (3) and counting the total number of fringes in distance on the screen,
Note that . Rearranging the terms to get ,
Marking rubric — Total = 1.5. If final answer is the same, then get full mark. 0.1 for Eqn (2); 0.1 for Eqn (4); 0.1 for Eqn (5); 0.4 for Writing the correction Eqn (6); 0.1 for Small angle approximation; 0.2 for expressing all angles to ; 0.1 for relating to ; 0.3 for expression; 0.1 for .
Some examples of variations to be considered:
Note – If they ignore glass, merge glass and water (−0.3 mark, max mark = 1.2),
Note – If they ignore glass and water and everything considered as air (−1.0 mark, max mark = 0.5),
Source note: Equation (11b) is printed exactly as above, with on the left and no multiplicative diffraction factors. It is retained as a source discrepancy.
A2
Attach this Answer Sheet to the Screen (F) and mark the fringes in the space below.
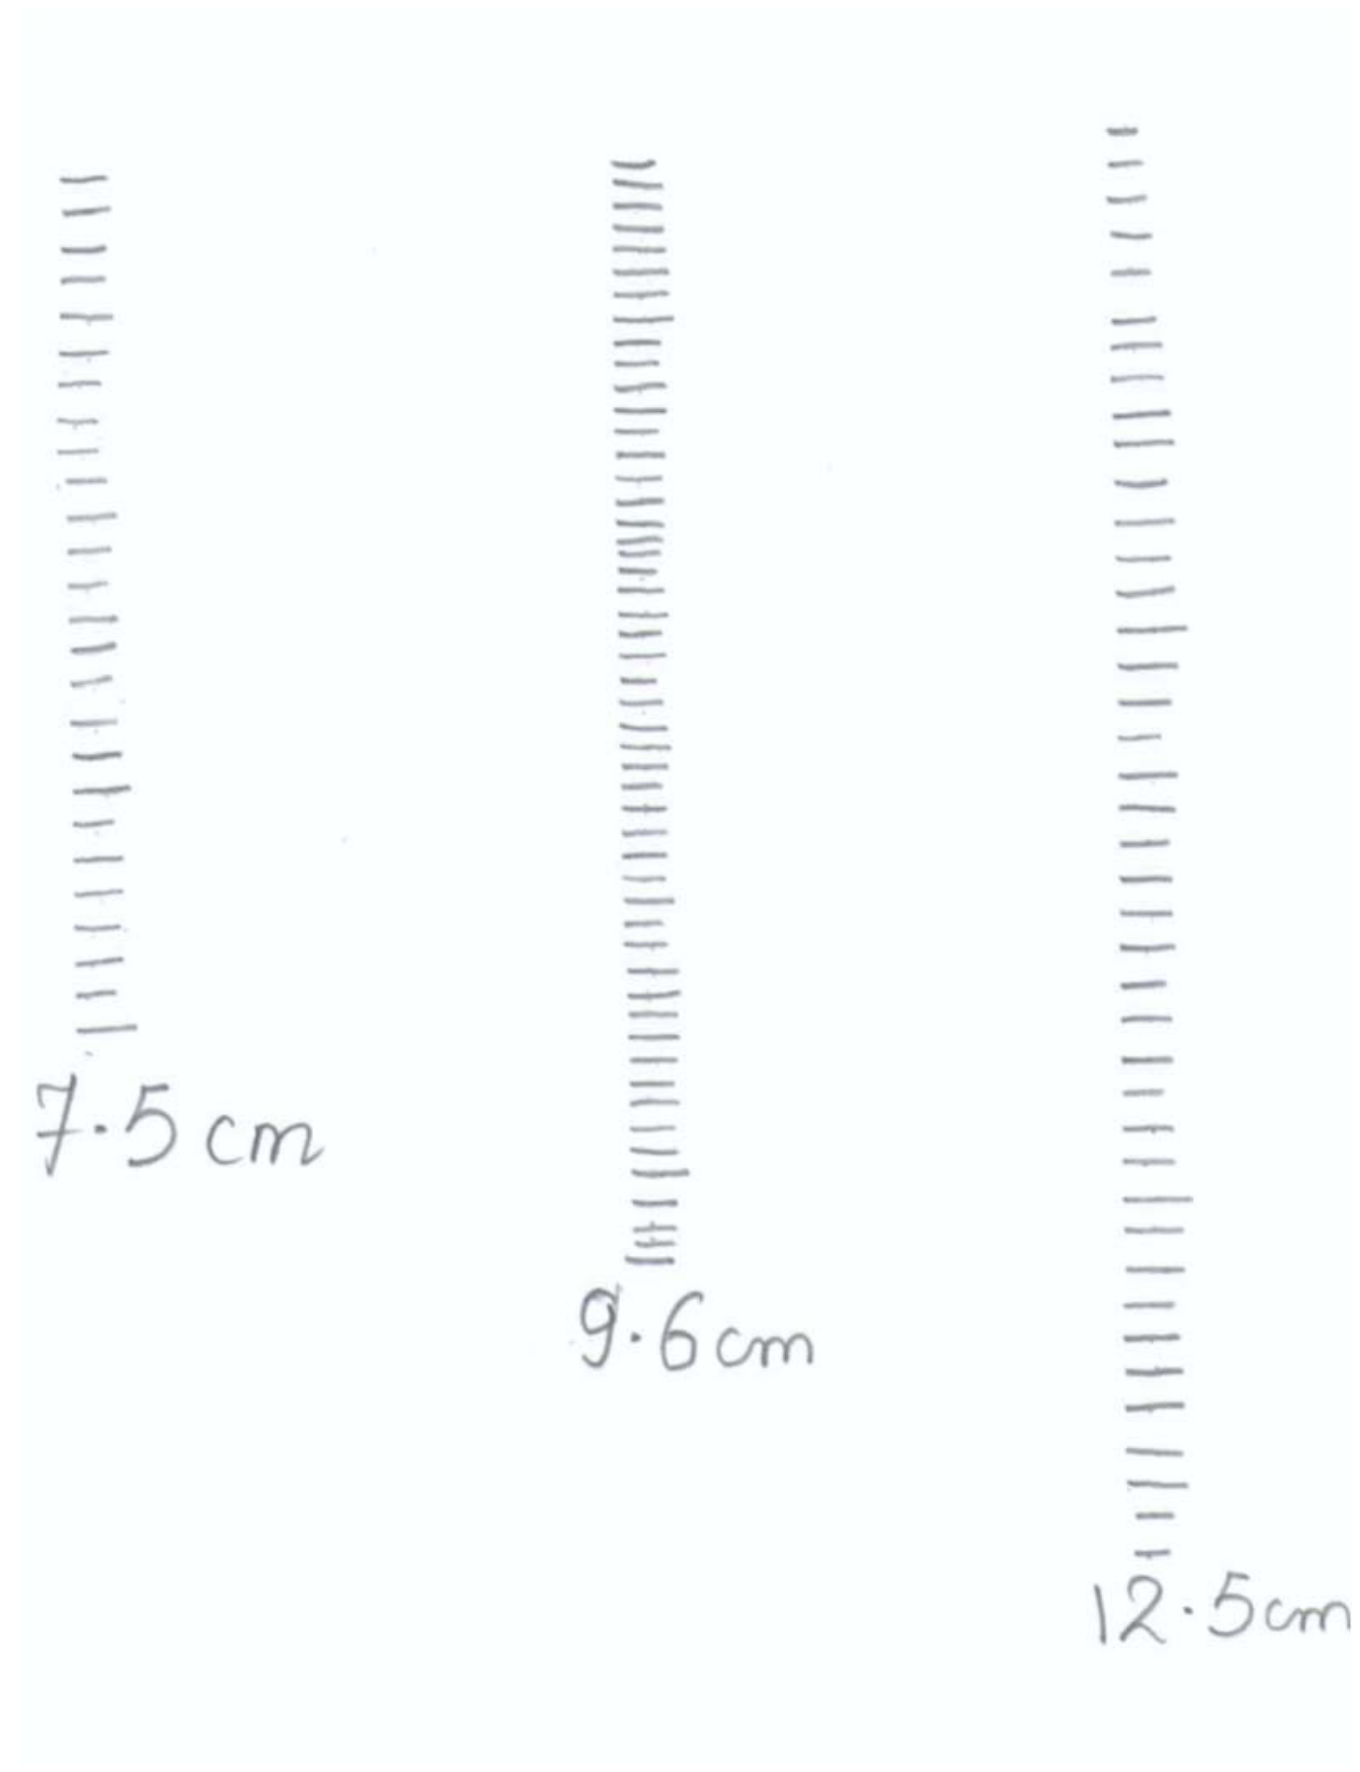
| Pattern 1 | Pattern 2 | Pattern 3 | Uncertainty | |
|---|---|---|---|---|
| 26 | 51 | 41 | ||
| (cm) | 7.5 | 9.6 | 12.5 | |
| Temperature of the mineral water (°C) | 22 | 22 | 22 |
NOTE: Temp in Exam Hall was 27 °C for water in Glass Cell under experimental conditions with precaution taken.
Marking rubric — Total: 2.5. 1.6 for Patterns: 1.6 for patterns; 1.4 for 2 patterns; 1.2 for 1 pattern. Note – The maximum marks will be reduced to 50% of the marks mentioned above if the number of fringes marked is less than 10 on average; and 25% for less than 5 marked fringes.
0.9 for complete table: −0.1 each uncertainty missing; −0.1 each unit missing; −0.1 missing; −0.2 missing; −0.2 missing.
Note: the marks allocated for the table will be given if the values are implicitly observed in the results.
A3
Measure and record all relevant parameters in the space below and calculate the wavelength of sound, , in mineral water.
Thickness of the wall of glass cell: .
| (cm), ±0.2 cm | (cm), ±0.5 cm | (cm), ±0.05 cm | (m), × | ||
|---|---|---|---|---|---|
| Pattern 1 | 5 | 368.5 | 7.5 | 26 | 8.20 |
| Pattern 2 | 5.5 | 235 | 9.6 | 51 | 8.23 |
| Pattern 3 | 7.1 | 384.6 | 12.5 | 41 | 8.24 |
Marking rubric — Total: 1.0. 0.1 Right value of (between 4.9 to 5.1 mm); 0.4 Tabulation of ; 0.5 for value of .
Note – is Temperature dependent: 0.5 within 5% of value of at temperature noted by Organizing Committee in Exam Hall; 0.3 for outside 5% but within 10% of value of at noted temperature; 0.1 for outside 10% but within 20% of value of at noted temperature; 0 otherwise.
Note: If is wrong due to totally wrong , then team leader check for value from correct formula and award from above guidelines for , but with a further deduction of 0.1 mark.
−0.1 each uncertainty missing; −0.1 each unit missing; −0.1 missing; −0.1 missing; −0.2 for .
Source note: Here the key prints glass-index uncertainty 0.005, whereas the question prints 0.05. The uncertainty is 0.2 cm here and 0.1 cm in the following error-analysis table. Both are retained.
A4
Calculate and record the frequency of ultrasonic waves, , in mineral water.
From the graph, Speed of ultrasound in water at 22 °C is .
Frequency of ultrasound:
If is wrong due to totally wrong then subtract additional 0.1 from above guidelines for .
NOTE: Temp in Exam Hall was 27 °C for water in Glass Cell under experimental conditions with precaution taken.
Marking rubric — Total: 0.5. 0.2 Right value of speed of sound (@ the reported ); 0.1 for ; 0.1 for unit; 0.1 for correct answer (full 0.1 for value within 5% of 1.786 MHz; 0 otherwise).
Note: Measured value of frequency of the piezoelectric transducers is 1.786 MHz.
A5
Carry out an error analysis to estimate the uncertainty, , in the frequency of ultrasonic wave.
Check that small angle is appropriate . So the percentage difference between and is ~0.02%.
From equation (10), relative error in can be written as
| (cm), ±0.1 cm | (cm), ±0.5 cm | (cm), ±0.05 cm | (m), × | |||
|---|---|---|---|---|---|---|
| Pattern 1 | 5.0 | 368.5 | 7.5 | 26 | 8.20 | 0.0068 |
| Pattern 2 | 5.5 | 235 | 9.6 | 51 | 8.23 | 0.0056 |
| Pattern 3 | 7.1 | 384.6 | 12.5 | 41 | 8.24 | 0.0042 |
Alternative. If students get three or more patterns and calculate the standard error using
Marking rubric — Total: 1.0. 0.8 Expression for everything combined (0.6 for , 0.2 for by combining and ). 0.2 for the right numerical value: 0.2 for 0.01 MHz–0.09 MHz; 0.1 for (0.005 to ) MHz and ( to 0.18) MHz; 0 otherwise.
Note: if students just take one pattern but do this detail error analysis, get full 1.0 mark for error analysis if the analysis is done correctly.
Alternative (Max 1.0): 0.4 for the correct expression for the standard error; 0.4 if they do at least 6 times and then go for standard error (0.2 if they do at least three times and then go for standard error); 0.2 marks for numerical value (further penalty as per rules/range specified above).
Source note: The numerical speed-error term is here, whereas A4 prints . The printed small-angle percentage and standard-error formula are also retained.
B1
Write down the equation for .
represents the number of fringes counted corresponding to .
Marking rubric — Total: 1.0. 0.2 for using for getting ; 0.8 for equation (12). −0.8 for missing the factor 2, i.e. for not realizing that for standing wave the spacing between bright/dark spaces is . −0.2 for using instead of (no deduction if the results show that number of intervals).
B2
Attach this Answer Sheet to the Screen (F) and mark the projected standing wave pattern in the space below.
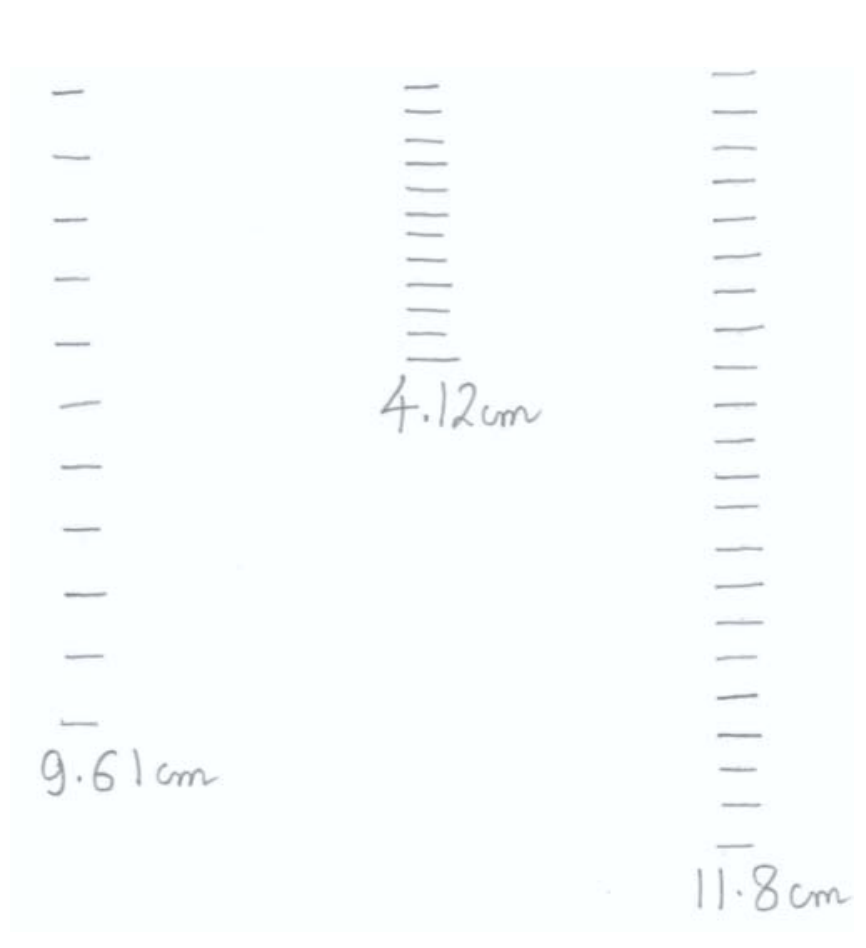
| Pattern 1 | Pattern 2 | Pattern 3 | Uncertainty | |
|---|---|---|---|---|
| 11 | 12 | 22 | ||
| (cm) | 9.61 | 4.12 | 11.80 | |
| Temperature of the mineral water (°C) | 22 | 22 | 22 |
NOTE: Temp in Exam Hall was 27 °C for water in Glass Cell under experimental conditions with precautions taken.
Marking rubric — Total: 2.0. 1.4 for Patterns: patterns get 1.4; 2 patterns get 1.2; 1 pattern gets 1.0. Full marks for more than 2 dark/bright region marked.
0.6 for the complete table: −0.1 each uncertainty missing; −0.1 each unit missing; −0.1 missing; −0.1 missing; −0.1 missing.
Note – the marks allocated for the table will be given if the values are implicitly observed in the results.
B3
Measure and record all relevant parameters in the space below and calculate the wavelength of sound, , in mineral water.
| Pattern 1 | Pattern 2 | Pattern 3 | Uncertainty | |
|---|---|---|---|---|
| (cm) | 5.2 | 5.5 | 3.5 | |
| (cm) | 11.16 | 11.16 | 12.00 | |
| (cm) | 0.5 | 0.5 | 0.5 | |
| (cm) | 12.7 | 12.7 | 20.5 | |
| (cm) | 257.4 | 92.2 | 208.5 | depending on experiment |
| 11 | 12 | 22 | ||
| (cm) | 9.61 | 4.12 | 11.80 | |
| 22.96 | 8.95 | 12.66 | ||
| (cm) | 0.419 | 0.46 | 0.932 | |
| (× m) | 8.37 | 8.37 | 8.88 |
.
Marking rubric — Total: 1.5. 0.1 Right value of (between 4.9 to 5.1 mm); 0.9 Tabulation of or ; 0.5 for value of .
Note – is Temperature dependent: 0.5 within 5% of value of at temperature noted by Organizing Committee in Exam Hall; 0.3 for outside 5% but within 10% of value of at noted temperature; 0.1 for outside 10% but within 20% of value of at noted temperature; 0 otherwise.
Note: If is wrong due to totally wrong , then team leader check for value from correct formula and award from above guidelines for , but with a further deduction of 0.1 mark.
−0.1 each uncertainty missing; −0.1 each unit missing, up to maximum penalty of 0.5 marks; −0.1 or missing; −0.1 or missing; −0.1 for .
Source note: The key prints in B3/B5, whereas A3 prints . Both native values and units remain visible.
B4
Calculate and record the frequency of ultrasonic waves, , in mineral water.
Frequency of ultrasound:
Marking rubric — Total 0.5. 0.1 for ; 0.1 for unit; 0.3 for correct answer (full 0.3 for value within 5% of 1.786 MHz; 0.2 for value outside 5% but within 10% of 1.786 MHz; 0 otherwise).
Note: Measured value of frequency of the piezoelectric transducers is 1.786 MHz.
B5
Carry out an error analysis to estimate the uncertainty, , in frequency of ultrasonic wave.
The native error-analysis table repeats the B3 measurements, with here:
| Pattern 1 | Pattern 2 | Pattern 3 | Uncertainty | |
|---|---|---|---|---|
| (cm) | 5.2 | 5.5 | 3.5 | |
| (cm) | 11.16 | 11.16 | 12.00 | |
| (cm) | 0.5 | 0.5 | 0.5 | |
| (cm) | 12.7 | 12.7 | 20.5 | |
| (cm) | 257.4 | 92.2 | 208.5 | |
| 11 | 12 | 22 | ||
| (cm) | 9.61 | 4.12 | 11.80 | |
| 22.96 | 8.95 | 12.66 | ||
| (cm) | 0.419 | 0.46 | 0.932 | |
| (× m) | 8.37 | 8.37 | 8.88 | |
| 0.012 | 0.016 | 0.008 |
.
Marking rubric — Total: 1.0. 0.8 Expression for everything combined (0.6 for , 0.2 for by combining and ). 0.2 for the right numerical value: 0.2 for 0.01 MHz–0.09 MHz; 0.1 for (0.005 to ) MHz and ( to 0.18) MHz; 0 otherwise.
Note: if students just take one pattern but do this detail error analysis, get full 1.0 mark for error analysis if the analysis is done correctly.
Alternative (Max 1.0): 0.4 for the correct expression for the standard error; 0.4 if they do at least 6 times and then go for standard error (0.2 if they do at least three times and then go for standard error); 0.2 marks for numerical value (further penalty as per rules/range specified above).
C1
Attach this Answer Sheet to the Screen (F) and mark the observed patterns in the space below. Label each recorded pattern with the corresponding salt concentration. Do not forget to note down the relevant experimental parameters, in Answer Sheet C2 on page 10, needed for calculations.
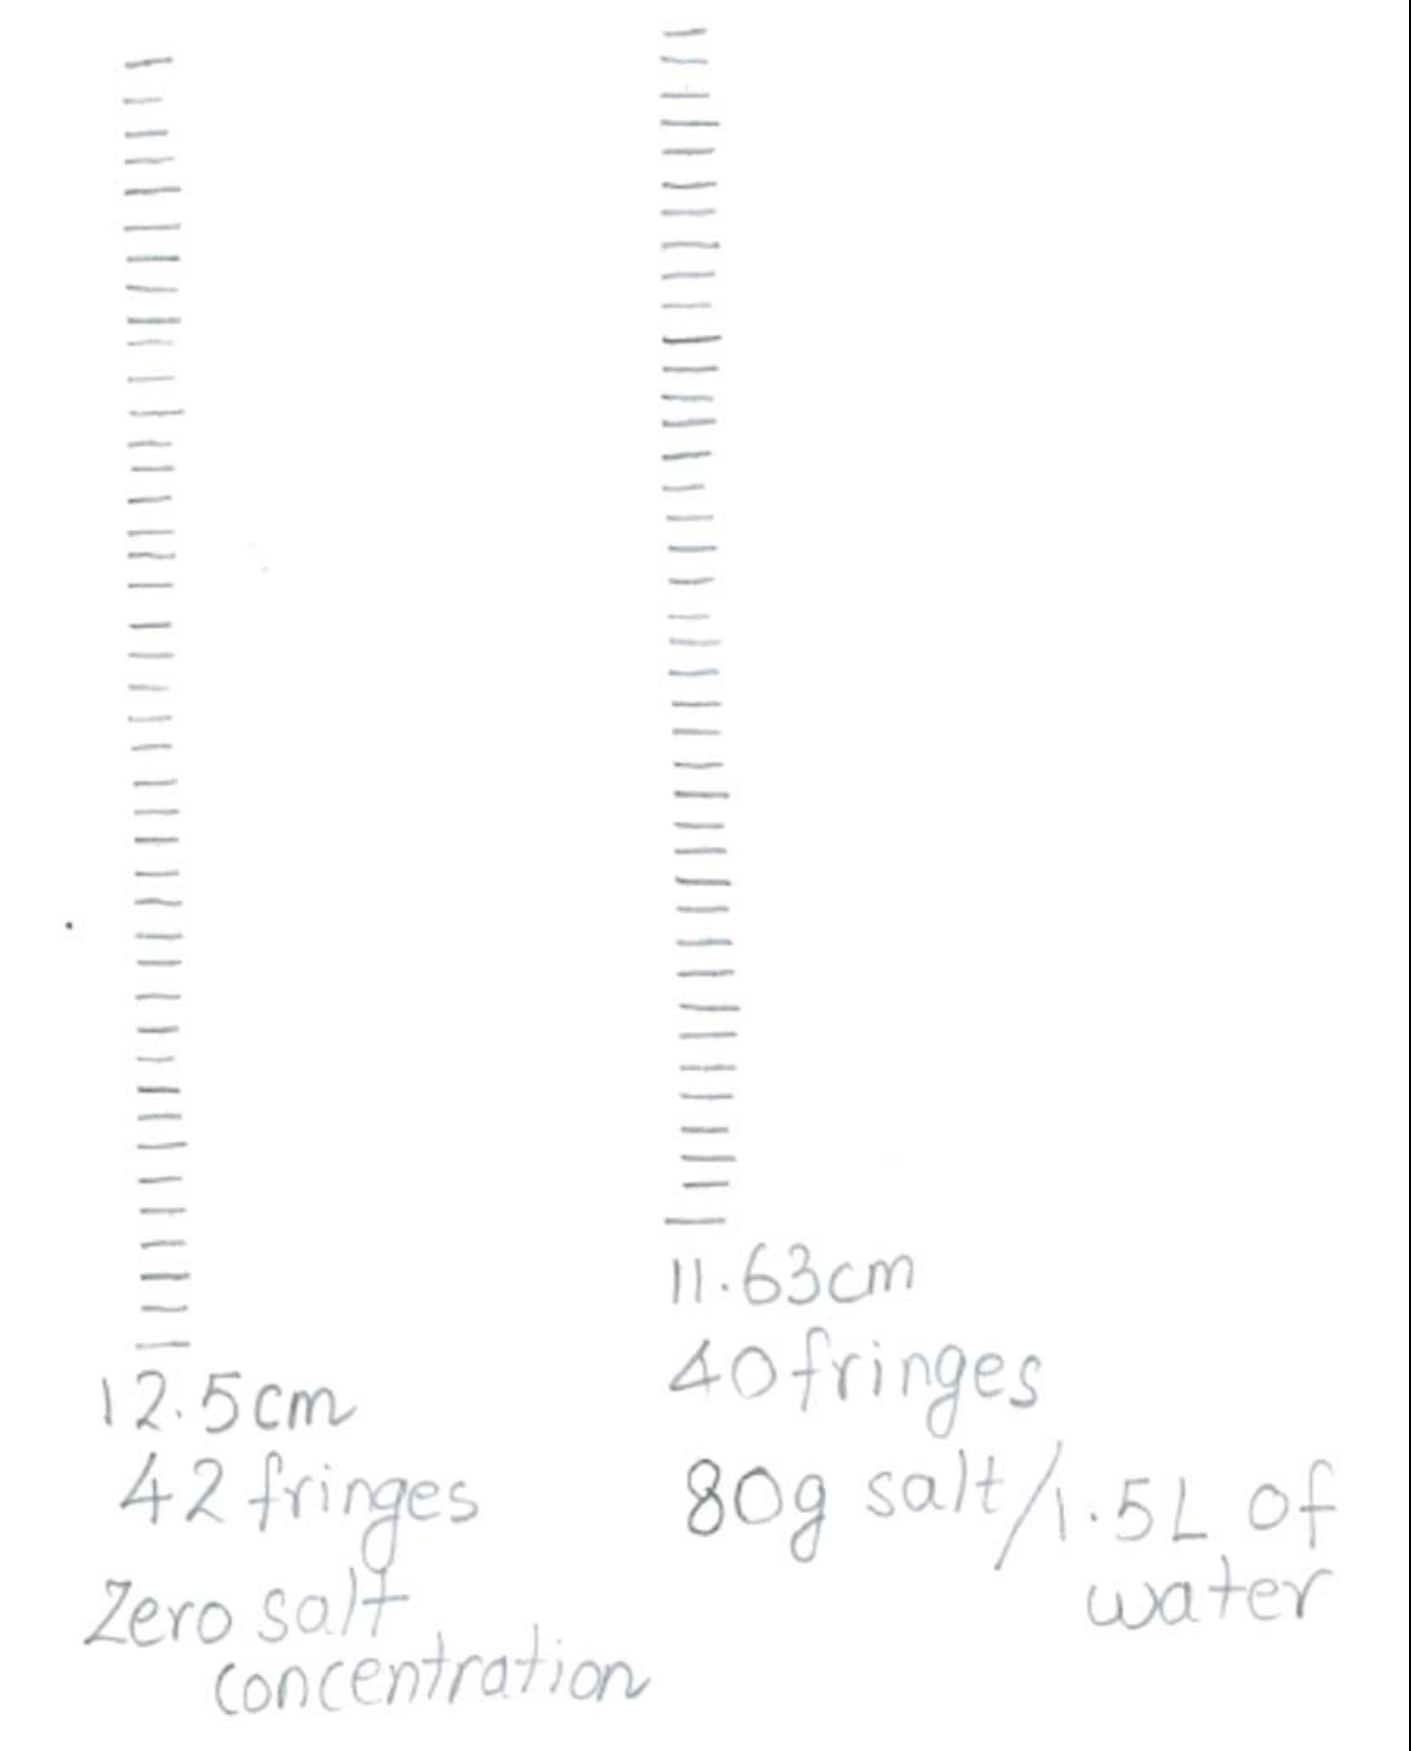
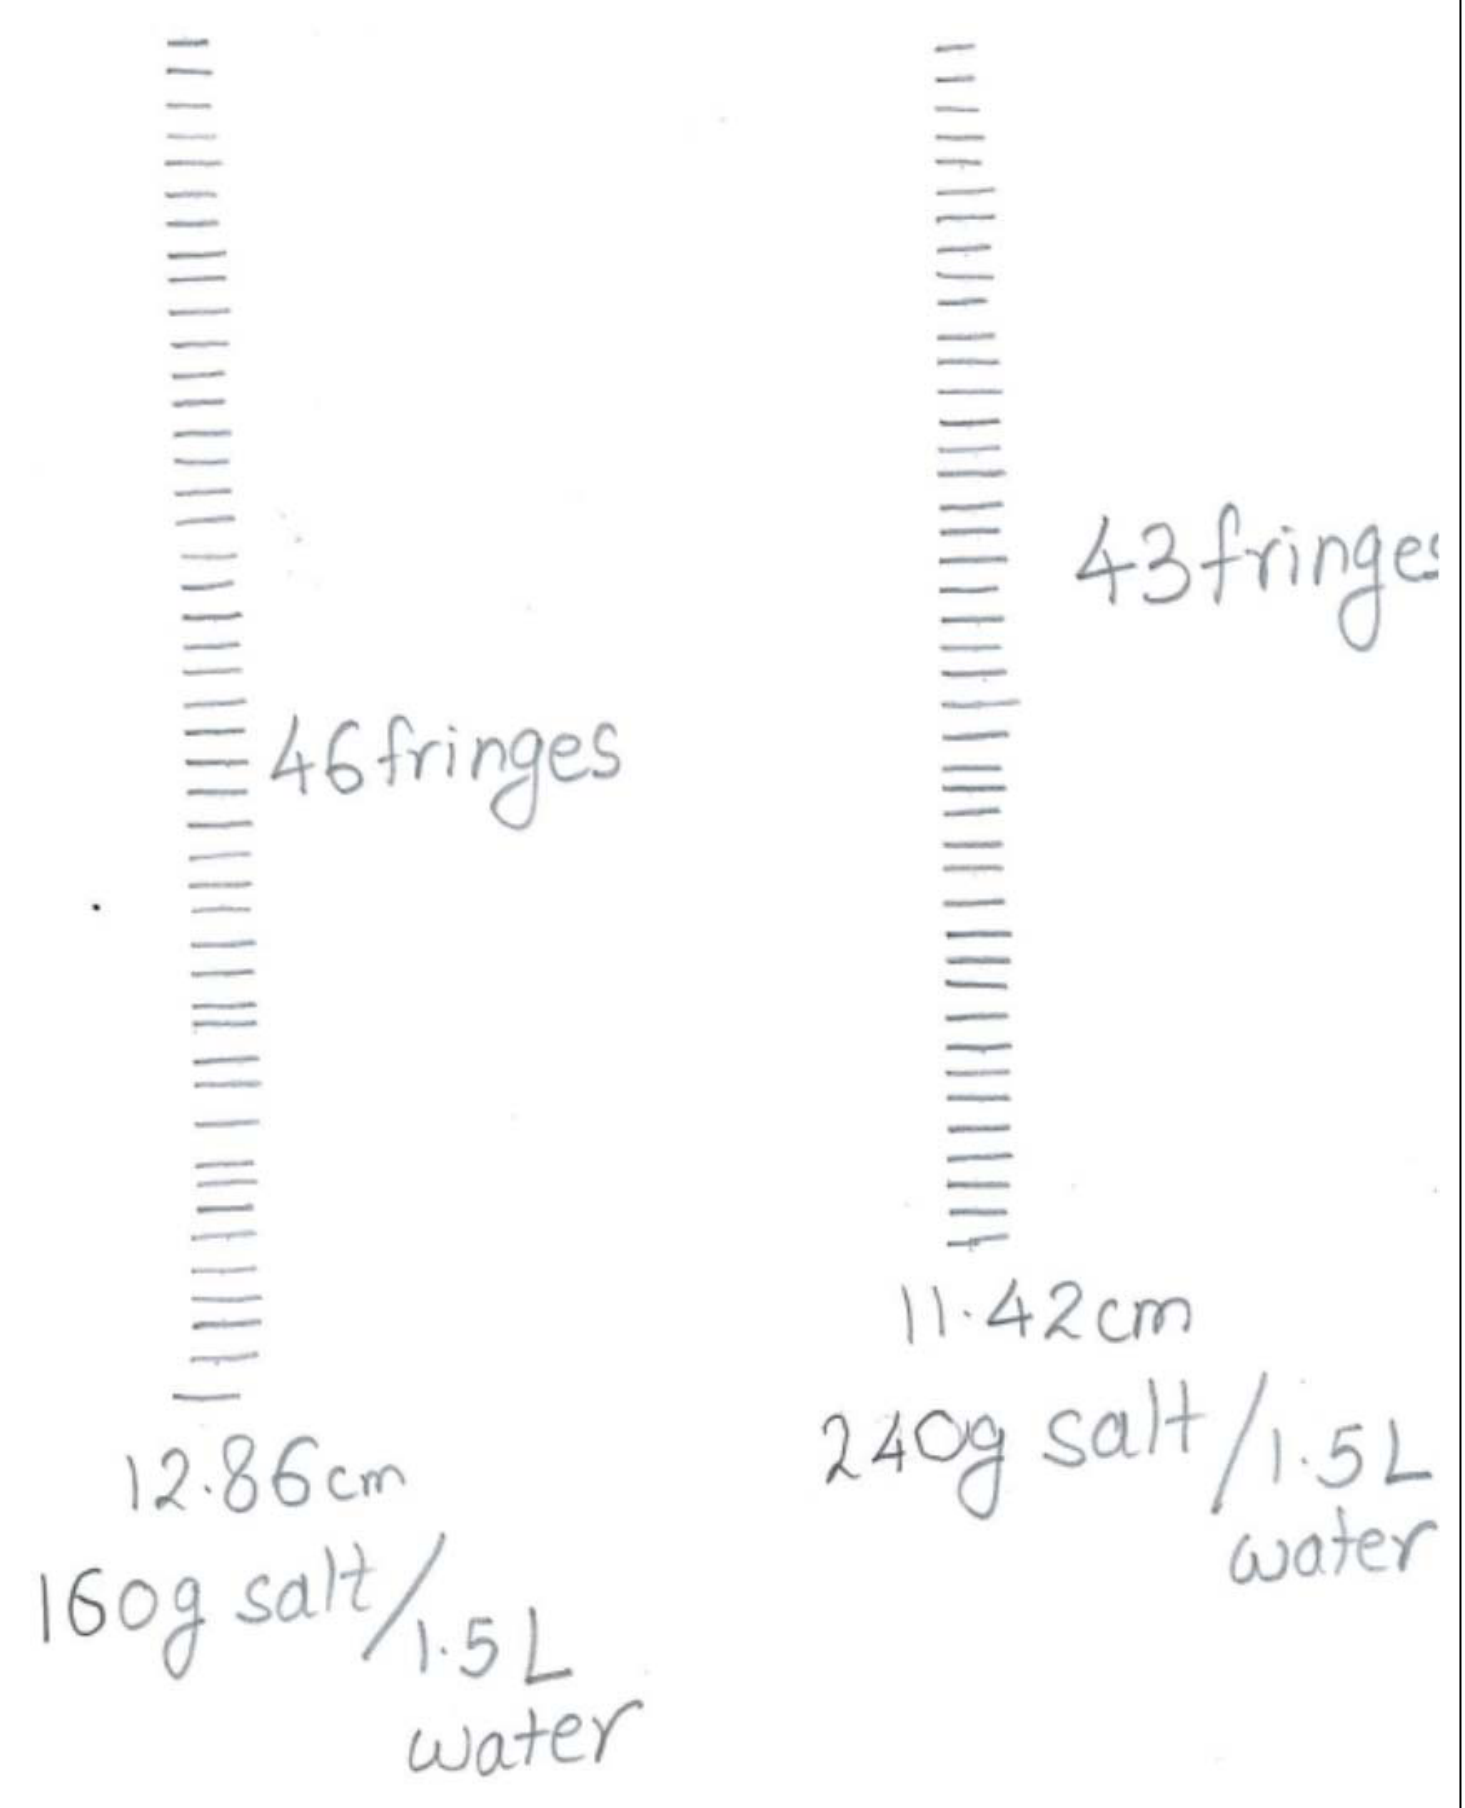
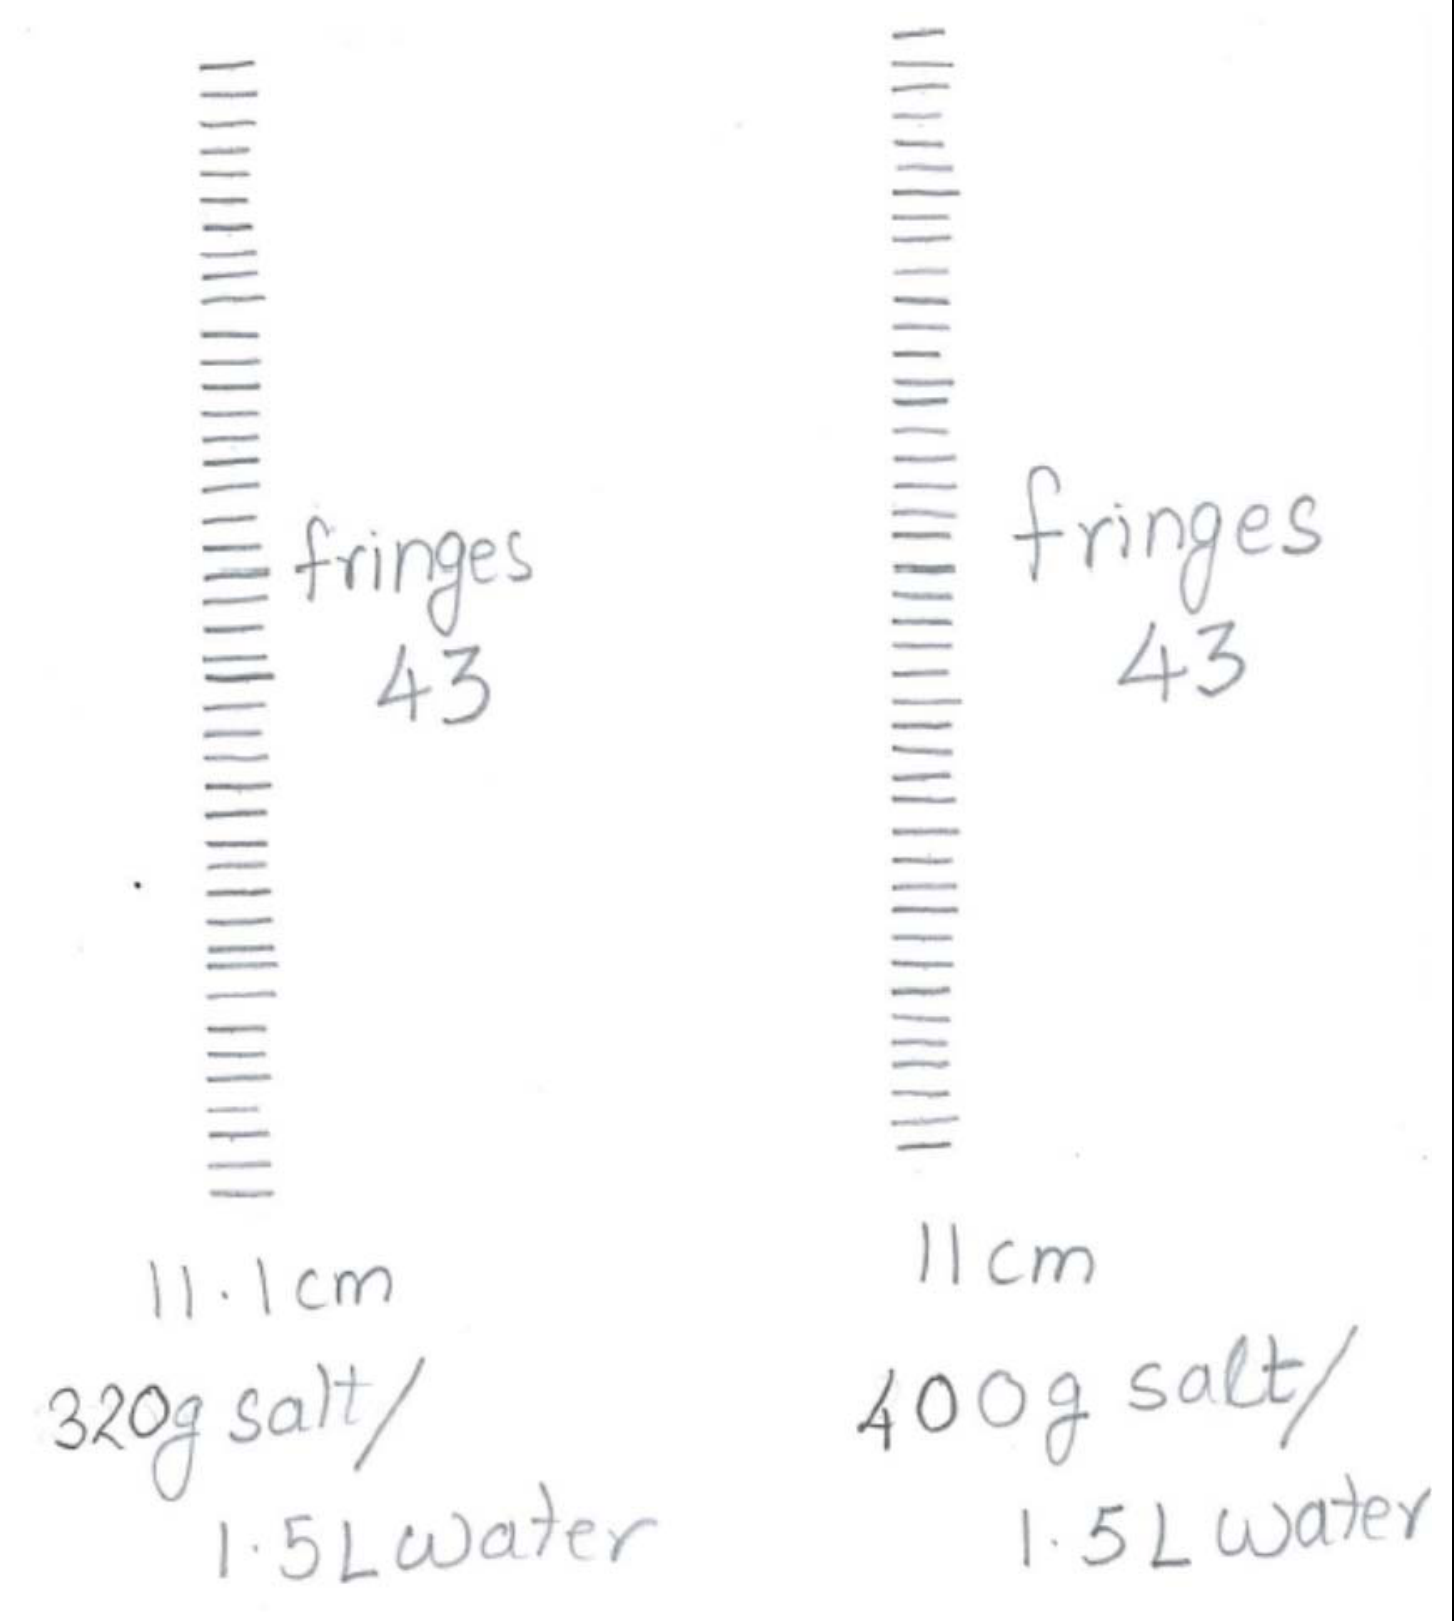
The original handwritten records are: zero salt, 42 fringes, 12.5 cm; 80 g salt in 1.5 L water, 40 fringes, 11.63 cm; 160 g salt in 1.5 L water, 46 fringes, 12.86 cm; 240 g salt in 1.5 L water, 43 fringes, 11.42 cm; 320 g salt in 1.5 L water, 43 fringes, 11.1 cm; 400 g salt in 1.5 L water, 43 fringes, 11 cm.
Marking rubric — Total: 1.0. At least 5 different Salt Conc. get 1.0; 4 Conc. gets 0.8; 3 Conc. gets 0.6; 2 Conc. get 0.4; 1 Conc. gets 0.2. Above numbers exclude 0 concentration pattern which may be obtained from given graph. Not penalized for number of fringes.
Source note: The repeated instruction says C2 is on page 10; the obtained blank companion places C2 on page 11, and this worked key places it on page 16. The printed reference is retained.
Native image boundary: On original key page 14 the right edge of the handwritten “43 fringes” note meets the answer/rubric column border. The exact source image retains that printed boundary; no missing letter is reconstructed.
C2
Measure and record all relevant parameters in the table below and calculate the speed of sound, , in each of the known salt concentration.
| Parameter | Measurement 1 | Measurement 2 | Measurement 3 | Measurement 4 | Measurement 5 | Measurement 6 |
|---|---|---|---|---|---|---|
| Salt (g) in 1.5 L of water, | 0.0 | 80.0 | 160.0 | 240.0 | 320.0 | 400.0 |
| , Salt Conc., | 0 | 0.0506 | 0.0964 | 0.138 | 0.176 | 0.211 |
| Temperature, | 22 | 22 | 22 | 22 | 22 | 22 |
| (cm), | 7.1 | 6.8 | 8.4 | 7.6 | 7 | 8.9 |
| (cm) | 375.6 | 381.8 | 380.5 | 371.1 | 373.5 | 375.5 |
| (cm), | 12.52 | 11.63 | 12.86 | 11.42 | 11.1 | 11 |
| 42 | 40 | 46 | 43 | 43 | 43 | |
| () | 8.24 | 8.57 | 8.94 | 9.15 | 9.47 | 9.64 |
| Speed of Sound in salt solution (m/s) | 1483 | 1543 | 1609 | 1647 | 1704 | 1735 |
Marking rubric — Total: 2.0.
1.0 for Salt Conc. Variation. Full 1.0 marks if the salt conc. ranges from 0 to 0.2 and above is covered. Full 0.7 marks if salt conc. from 0 to (0.1–less than 0.2) is covered. Only 0.4 marks if salt conc. from 0 to less than 0.1 is covered. Data points should spread well with at least three well separated points with difference of at least 50 g per 1.5 liters. If data does not follow the above mentioned rule deduct 0.3 marks.
1.0 for value of . The values of speed of sound is expected to follow the equation
where is Salt Conc and is the speed of sound in mineral water (without salt) at temperature . At , .
0.2 for each value of within 5% of expected value at the temperature noted by Organizing Committee; 0.1 for each value of outside 5% but within 10% of expected value; 0 otherwise. Maximum of 1.0 marks for .
C3
Plot the speed of sound in solution against the salt concentration of the solution.
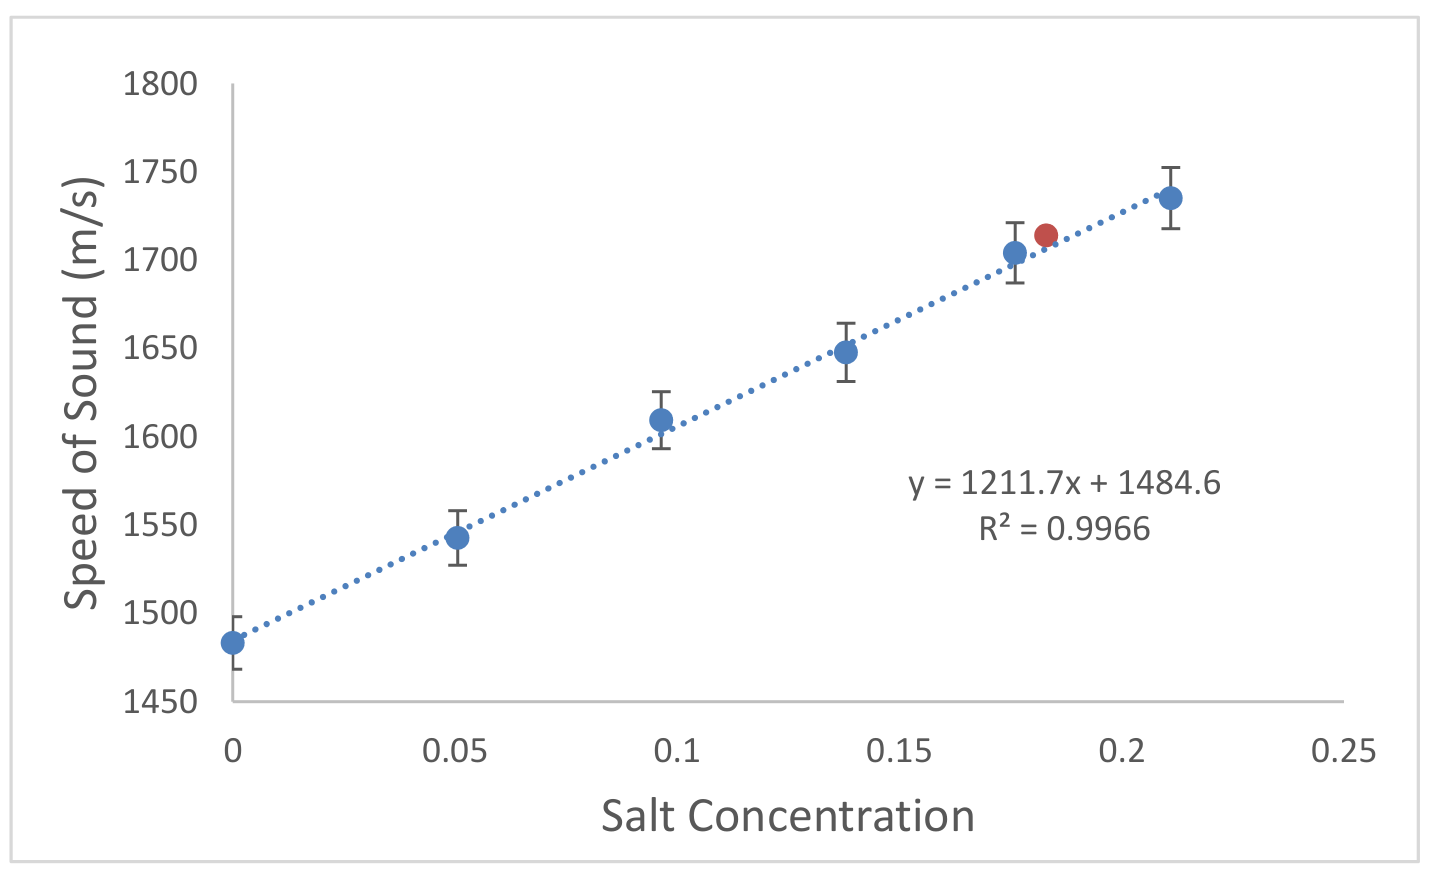
The native plotted fit is , . Its axes are Speed of Sound (m/s) and Salt Concentration. The original blue measured points and error bars and red unknown-solution point are retained in the crop.
Marking rubric — Total: 1.0. 0.2 for Axes Labels; 0.1 for Axes Units; 0.5 for plotting data points correctly; 0.2 for plotting error bars.
Source note: The graph prints fitted coefficient 1211.7, whereas the C2 marking rule prints expected coefficient 1187. Both native values remain visible.
C4
Attach this Answer Sheet to the Screen (F) and mark the observed patterns in the space below for unknown salt concentration solution. Note down the temperature of the solution and all other relevant experimental parameters needed for calculation of the speed of sound in this solution.
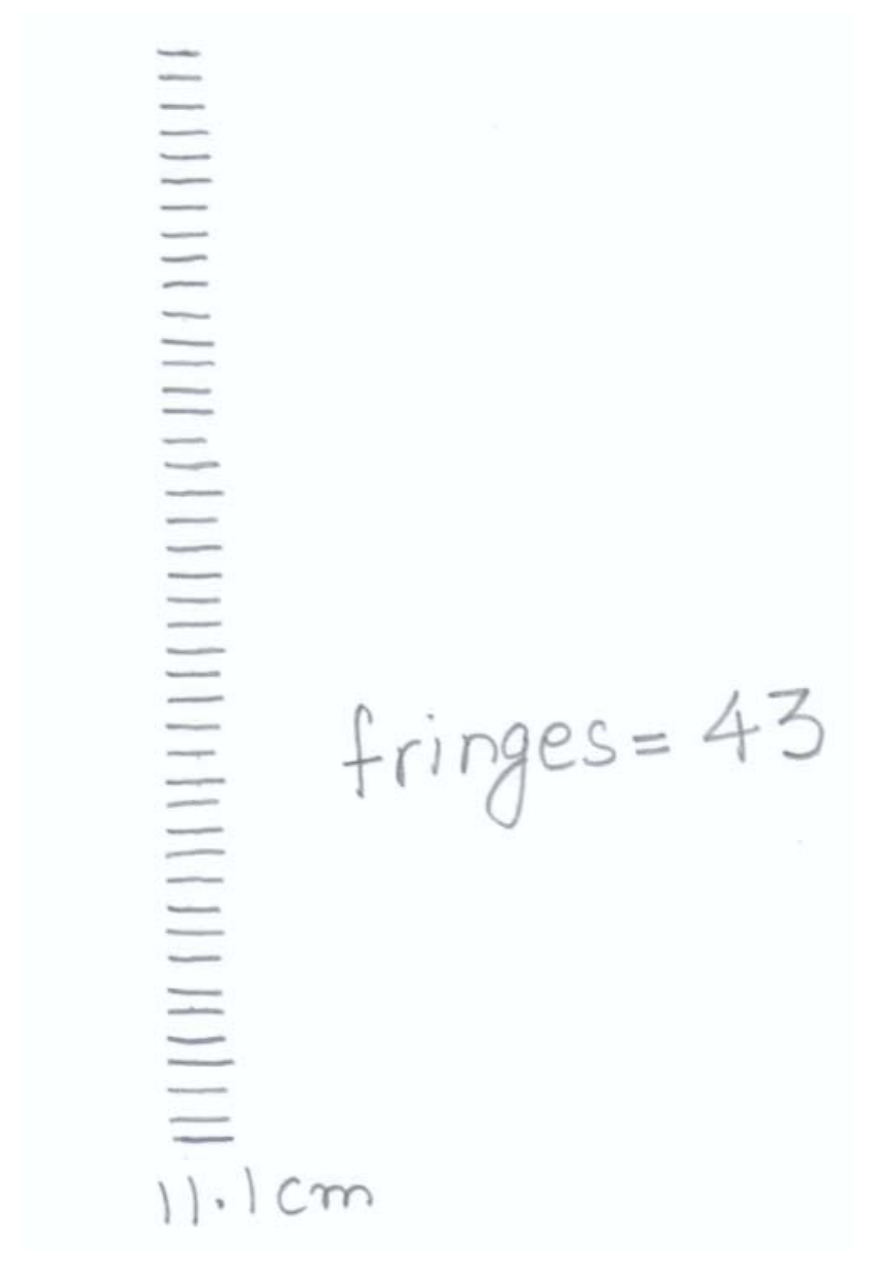
| (cm), | (cm), | (cm), | () | Speed of Sound in salt solution (m/s) | |
|---|---|---|---|---|---|
| 8.5 | 374.7 | 11.1 | 43 | 9.61 | 1714 |
Marking rubric — Total: 0.8. 0.2 for Pattern; 0.4 for the complete table: −0.1 each uncertainty missing, −0.1 each unit missing, −0.1 missing. 0.2 for correct value of : 0.2 for each value of within 5% of expected value; 0.1 for each value of outside 5% but within 10% of expected value; 0 otherwise. The marks allocated for the table will be given if the values are implicitly observed in the results.
C5
Determine the salt concentration in the unknown solution.
NOTE: The unknown solution has 225 g of salt dissolved per one liter of mineral water i.e. .
Marking rubric — Total: 0.2. 0.2 for correct value of concentration: 0.2 for value within 5% of expected value; 0.1 for value outside 5% but within 10% of expected value; 0 otherwise. −0.1 uncertainty missing.
The sample measured answer and the red preparation note are distinct printed values, both retained.
D1
Draw a labeled sketch of the experiment you have designed for calculation of the refractive index of the corn-syrup. Use the space below relevant parameters needed and calculate the refractive index of the corn-syrup.
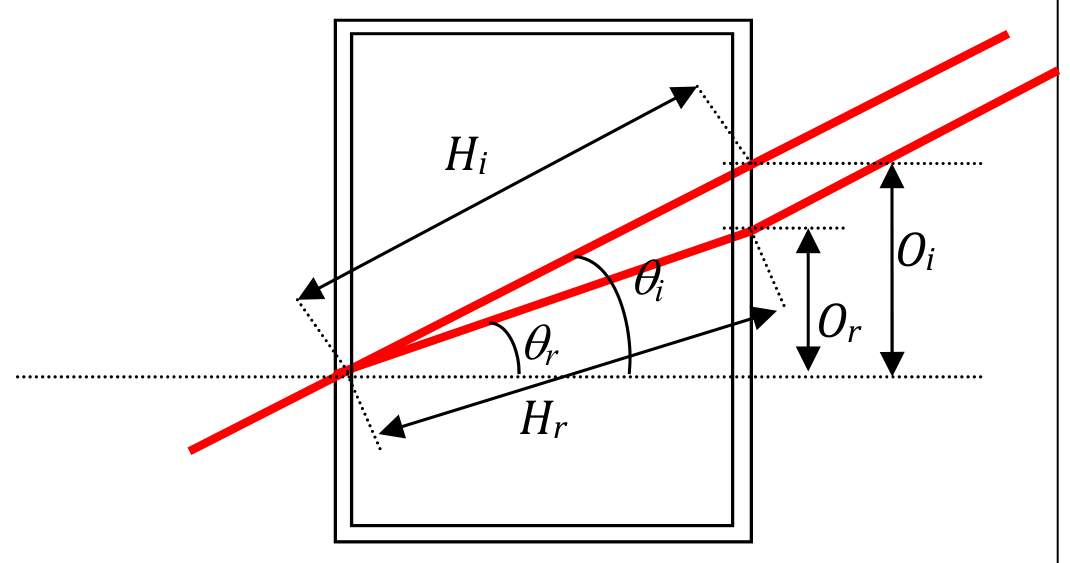
Assuming glass can be ignored.
Marking rubric — Total: 1.5. 0.5 for appropriate and properly labeled diagram; 0.5 for correct expressions related to the setup used; 0.5 for calculation (full 0.5 for value between 1.38–1.48; 0.3 for value between 1.34–1.38 or between 1.48–1.55; 0 for outside above mentioned range).
Source note: The numerical sine arguments 22.04 and 15.25 are printed without angle-unit symbols in the worked key; the native expressions are retained.
D2
Attach this Answer Sheet to the Screen (F) and mark diffraction patterns in the space below for corn-syrup. Note down the temperature of the corn-syrup and all other relevant experimental parameters needed to calculate the speed of sound in this solution.
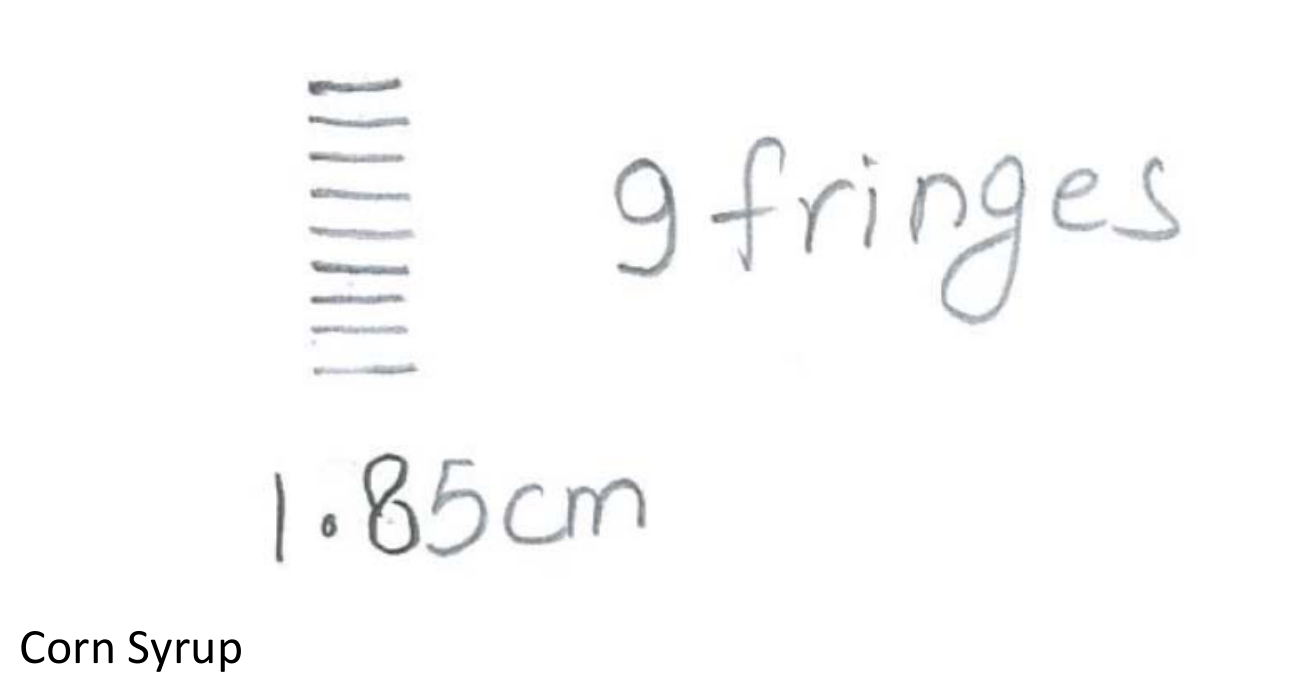
| (cm), | (cm), | (cm), | () | Speed of Sound (m/s) | |
|---|---|---|---|---|---|
| 8.9 | 360 | 1.85 | 9 | 10.47 | 1885 |
Marking rubric — Total: 1.0. 0.4 for pattern; 0.4 for tabulation of relevant parameters; 0.2 calculation of in corn syrup (0.2 for each value of within 5% of expected value; 0.1 for each value of outside 5% but within 10% of expected value; 0 otherwise).
Native blank answer sheets and writing sheets
Native answer-sheet companion. Its cover has four blank Student Code boxes, a blank “Additional Number of writing sheets” box, and “Do not write below this line.” The score table prints Part A 6.5, Part B 6.0, Part C 5.0, Part D 2.5, Total 20.0; “Marks Scored” is blank. Main answer sheets have blank Country and Student Code fields. They are numbered 2–15 of 15; the PDF then includes six unnumbered Writing Sheets, each with blank Country, Student Code, Question No and Page Number fields. The first four are plain blank writing spaces, and the final two include blank graph paper.
The native A1 answer form repeats equation (2) and the primary Figure 5 and asks to “determine A in terms of under small angle approximation condition.” That argument list differs from the primary question, which requests rather than . No answer is prefilled.
A2 is a blank fringe-marking area and a three-row table with , , and Temperature of the mineral water. A3 and A4 have calculation spaces and blank and fields. A5 has a blank field. B1 repeats the projection schematic from Figure 6(a) and its prompt, referring to equation (3) “from the question paper”. B2 has a blank standing-wave marking area and fields , , and Temperature of the mineral water; B3/B4 have blank and fields; B5 has a blank field.
C1 adds: “Tick in the box below for the experimental method that you have adopted for this question”, with empty boxes for Experiment A (Diffraction Method) and Experiment B (Projection Method). It repeats the labeling instruction and says “Answer Sheet C2 on page 10”, although C2 is actually on page 11. C2 defines – Salt Concentration, – Temperature of Salt Solution, – Speed of sound in salt solution, and states: “The third column can be divided into suitable numbers of column to record other relevant parameters.” Its native blank table is:
| Other relevant parameters — blank column to subdivide | |||
|---|---|---|---|
C3 repeats the question’s plotting/error-bar requirement and supplies the original blank plotting grid retained at C3 above. C4 has a blank pattern/calculation space and in unknown solution = [blank]; C5 has “Concentration of Salt in Unknown Solution =” [blank]. D1 repeats the labeled-sketch instruction, asks to record relevant parameters and their values, and has a blank field. D2 has a blank diffraction-pattern/calculation space, asks to note corn-syrup temperature and all other relevant parameters, and has “ in corn-syrup =” [blank]. The blank companion supplies no sample data or answers; the separate Marking Rubric does.
Теми и трудност
Оценена трудност: 4/5.
Вълни и звук · Оптика · Звук и акустика · Дифракция и разделителна способност · Пречупване · Суперпозиция и интерференция
Предпоставки: Гимназиална подготовка, Разширена олимпиадна подготовка
Оригинал в Архива: exp.pdf · официални решения: exp_sol.pdf · допълнителни данни: exp_anssheet.pdf