Съдържание
УсловиеPart A. Sample X. Spectral measurements (3,5 т.)Part B. Sample X. Laser measurements (5 т.)Part C. Sample Y. Several transmittance minimums (4,5 т.)Part D. Sample Z. Missed transmittance minimums (4,5 т.)Part E. Samples Y and Z. Internal structure of the period. (2,5 т.)ОтговориРешениеAPhO 2017, Експеримент — Задача 1. Photonic Crystal
Experiment — APhO YAKUTSK 2017 RUSSIA — Q1 Photonic Crystal (20 points, 5 hours) · 20 т.
Условие
Introduction
Photonic crystals are materials with periodic variation of refractive index on a scale comparable to the wavelength of light. In the optical spectrum of photonic crystals, narrow regions of wavelengths exist within which the light propagation is suppressed. These unusual optical properties are used for the development of diverse optical elements (optical filters, reflectors) on the basis of photonic crystals.
In this research work, you are invited to study the properties of photonic crystals based on porous (containing holes filled with air) films of anodic aluminum oxide. The structure of porous films of anodic aluminum oxide prepared by electrochemical oxidation (anodization) of aluminum can be represented as a system of disjoint cylindrical channels which are located perpendicular to the film surface (Fig. 1).
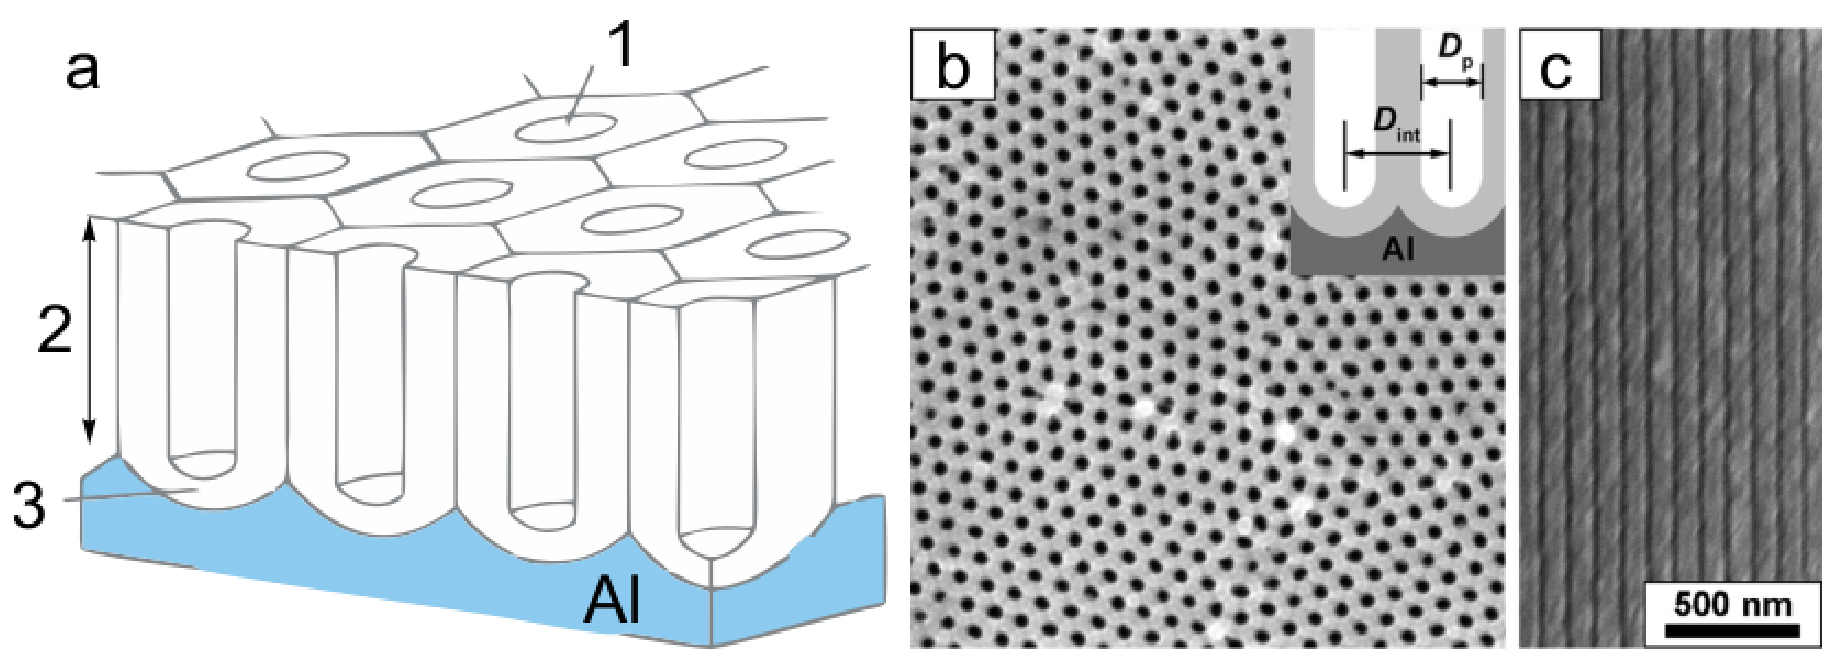
Pore diameter and interpore distance depend on the conditions of electrochemical treatment allowing one to obtain structures with variable porosity along the normal to the surface of the oxide film by changing the voltage during anodization (Fig. 2).
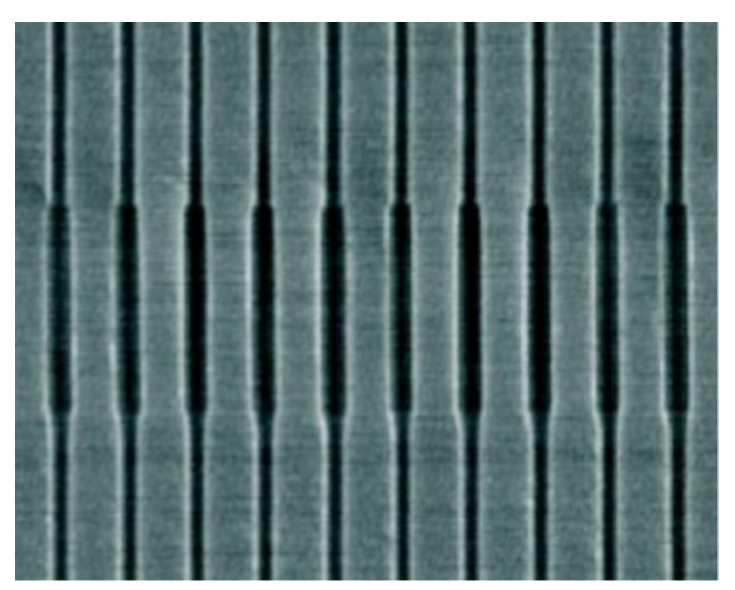
The pore diameter of the samples studied in this work is less than 30 nm. Porous medium with such a small pore diameter becomes continuous for the electromagnetic waves within the optical range and, as a consequence, it can be characterized by effective (volume-average) refraction index.
Variation of the oxide film porosity leads to the variation of the refractive index. It should be noted that the refractive index of the studied samples periodically changes only in a single direction: along the normal to the surface of the film. Therefore, the studied samples are one-dimensional photonic crystals.
It should be pointed out that the thin films of anodic aluminum oxide with uniform diameter are optically transparent whereas photonic crystals become colored due to the light interference within their layered structure.
During this research, you will perform optical studies of three samples of photonic crystals based on anodic aluminum oxide (AAO) with the structures of various complexities.
Equipment
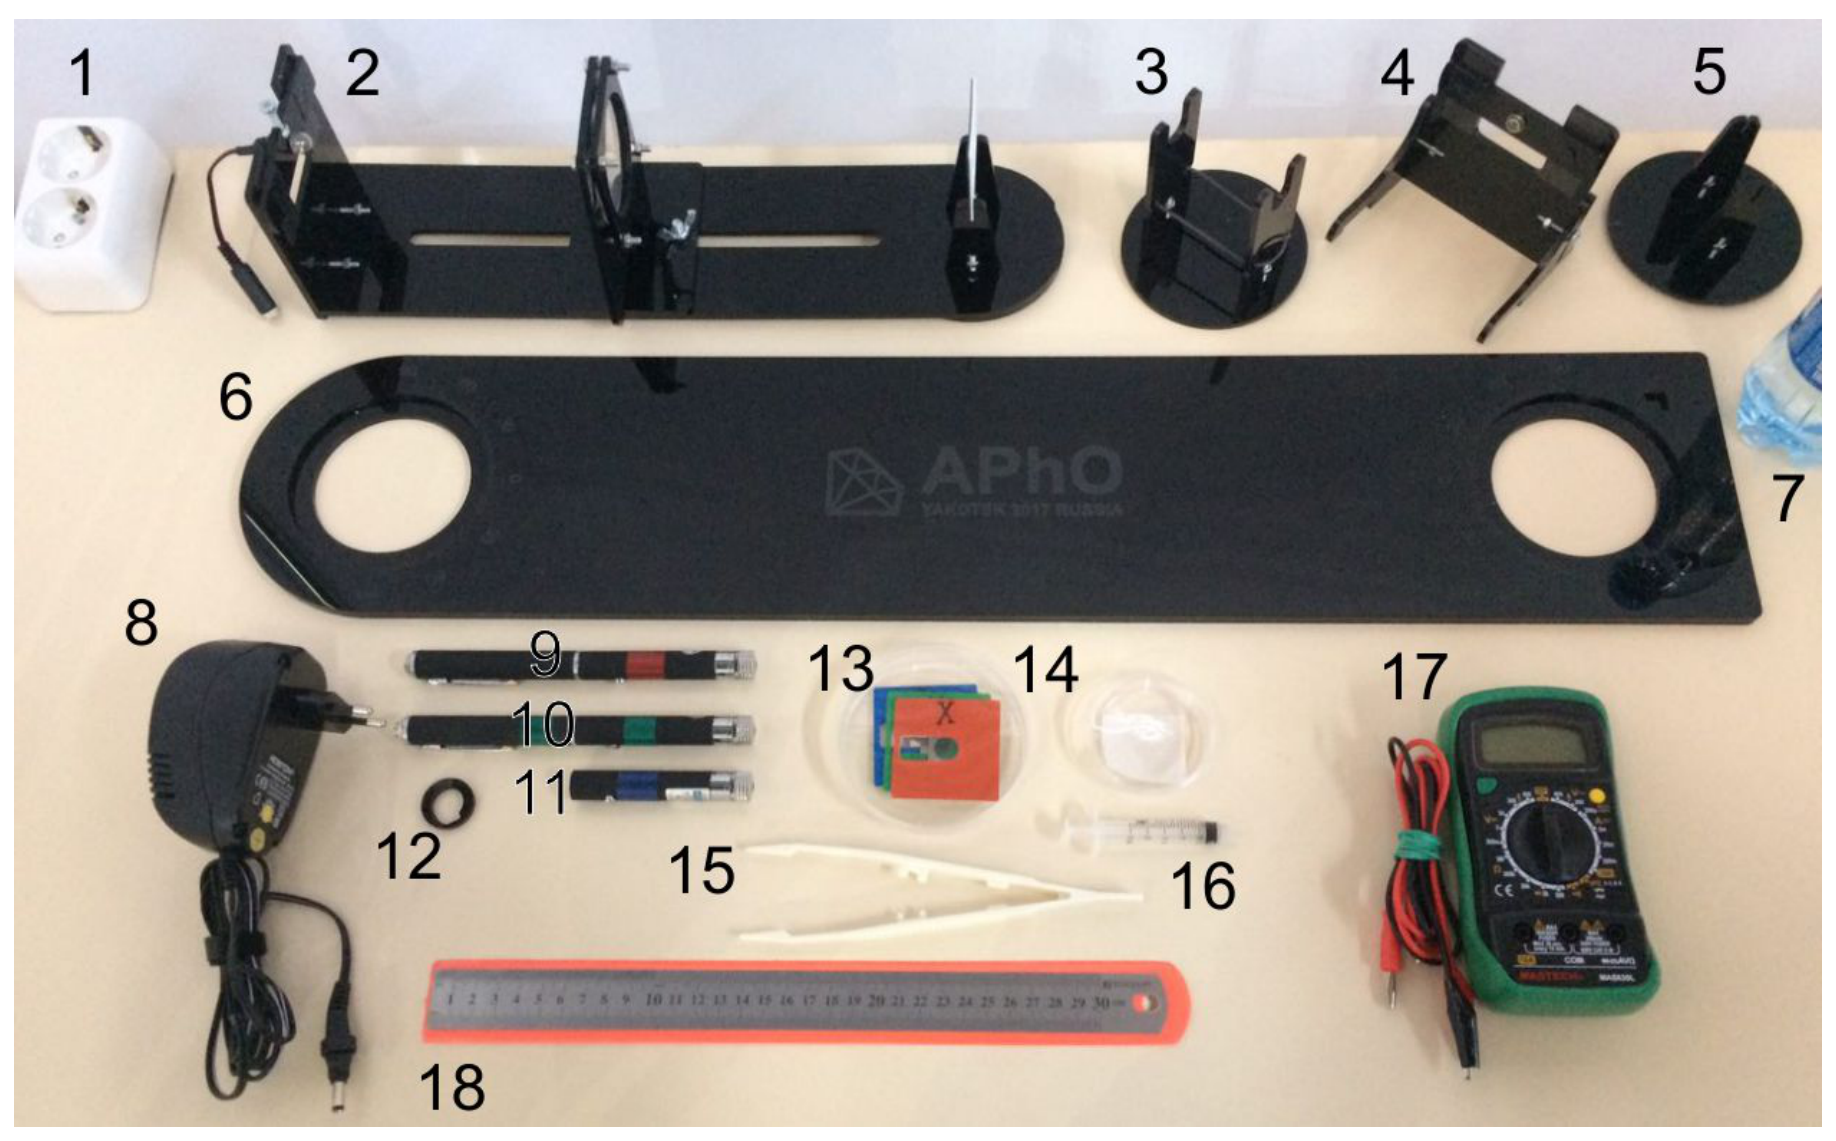
- Electrical outlet
- Diffraction arm for spectral measurements
- Laser holder with rubber band
- Photodiode with holder
- Sample holder
- Main optical bench with protractors
- Water in bottle
- DC adapter (power supply)
- Red laser (wavelength 659 nm)
- Green laser (wavelength 530 nm)
- Blue laser (wavelength 400 nm)
Lasers are dangerous! Do not point lasers at your eyes or look into the laser beam under any circumstances! Beware the reflected beams!
- Laser button lock
- Petri dish with three photonic crystal samples in square color frames
Photonic crystals are very fragile! Do not touch the crystals! Hold the samples only by frame! New samples will not be provided!
- Petri dish with the coverslip
Glass is thin and fragile! Use tweezers to hold it!
- Tweezers to operate the coverslip
- Syringe
- Multimeter with connector wires
- Ruler
Diffraction arm
For spectral measurements, you will need diffraction arm (fig. 4) to obtain different wavelengths. Diffraction arm is composed of the filament lamp (L), a diffraction grating (DG) in the holder and a movable lens (F) between them. To install the diffraction arm place the disk into the left hole of the main bench.
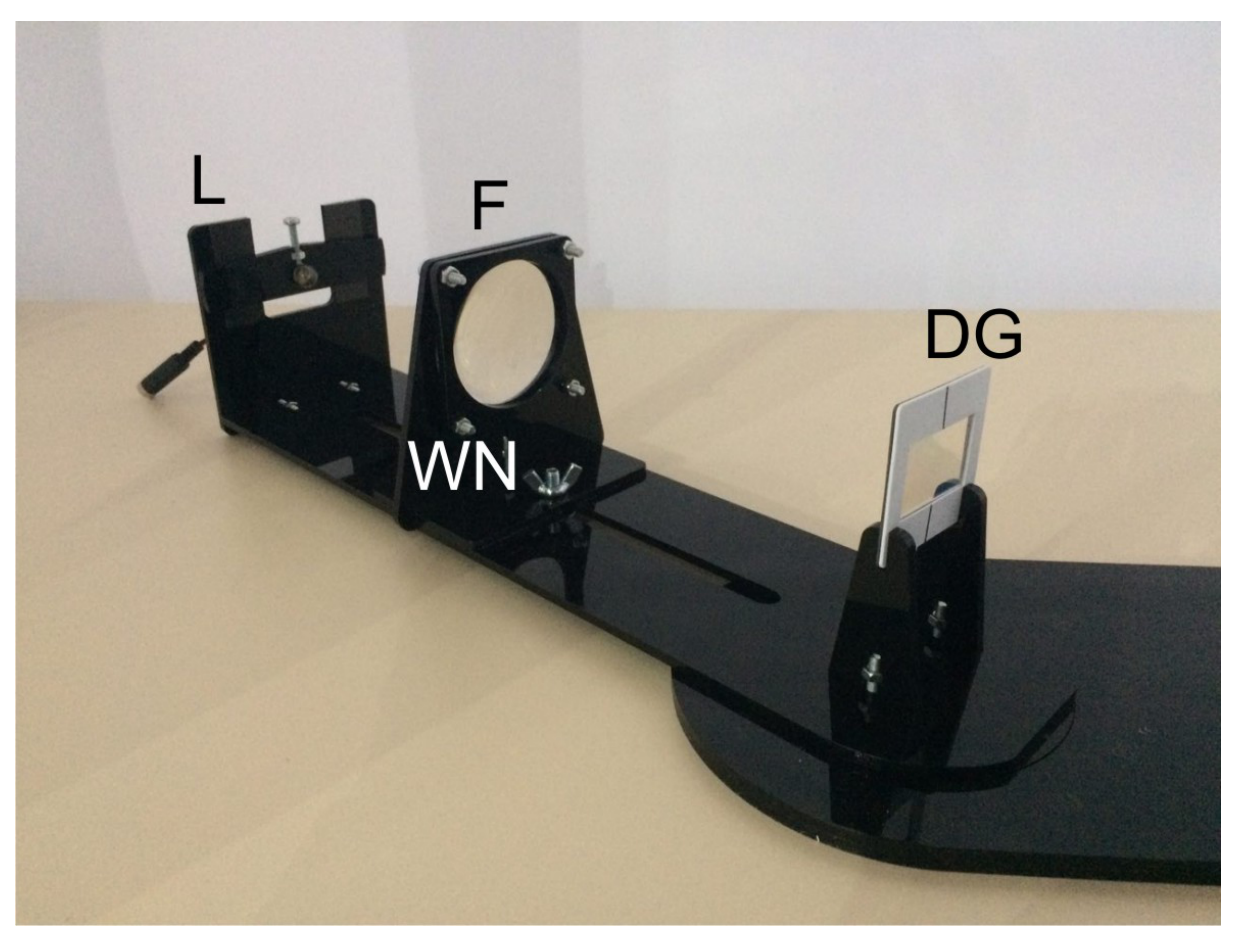
The lamp is initially centered, though you can adjust it if needed. Make sure the filament is vertical for a finer spectral line on the diffraction grating.
You can set a convergence angle of the beam by moving the lens. Untighten a wing nut (WN), slide the lens holder and tighten it again (do not overtighten it, a slight torque is enough to prevent the lens from an accidental movement).
Powering the lamp and lasers
To power light sources plug in the DC adapter into the outlet on the table. Connect the adapter to the socket of the lamp or the laser. Polarity is important for lasers and it is set properly initially.
Lasers
You are provided with three lasers: red ( nm), green ( nm) and blue ( nm), marked with color tape.
Lasers are dangerous! Do not point lasers at your eyes or look into the laser beam under any circumstances! Beware the reflected beams!
Red and blue lasers share the powering attachment. To switch from red to blue laser unscrew the attachment from the red laser and screw it to the blue one (fig. 5a).
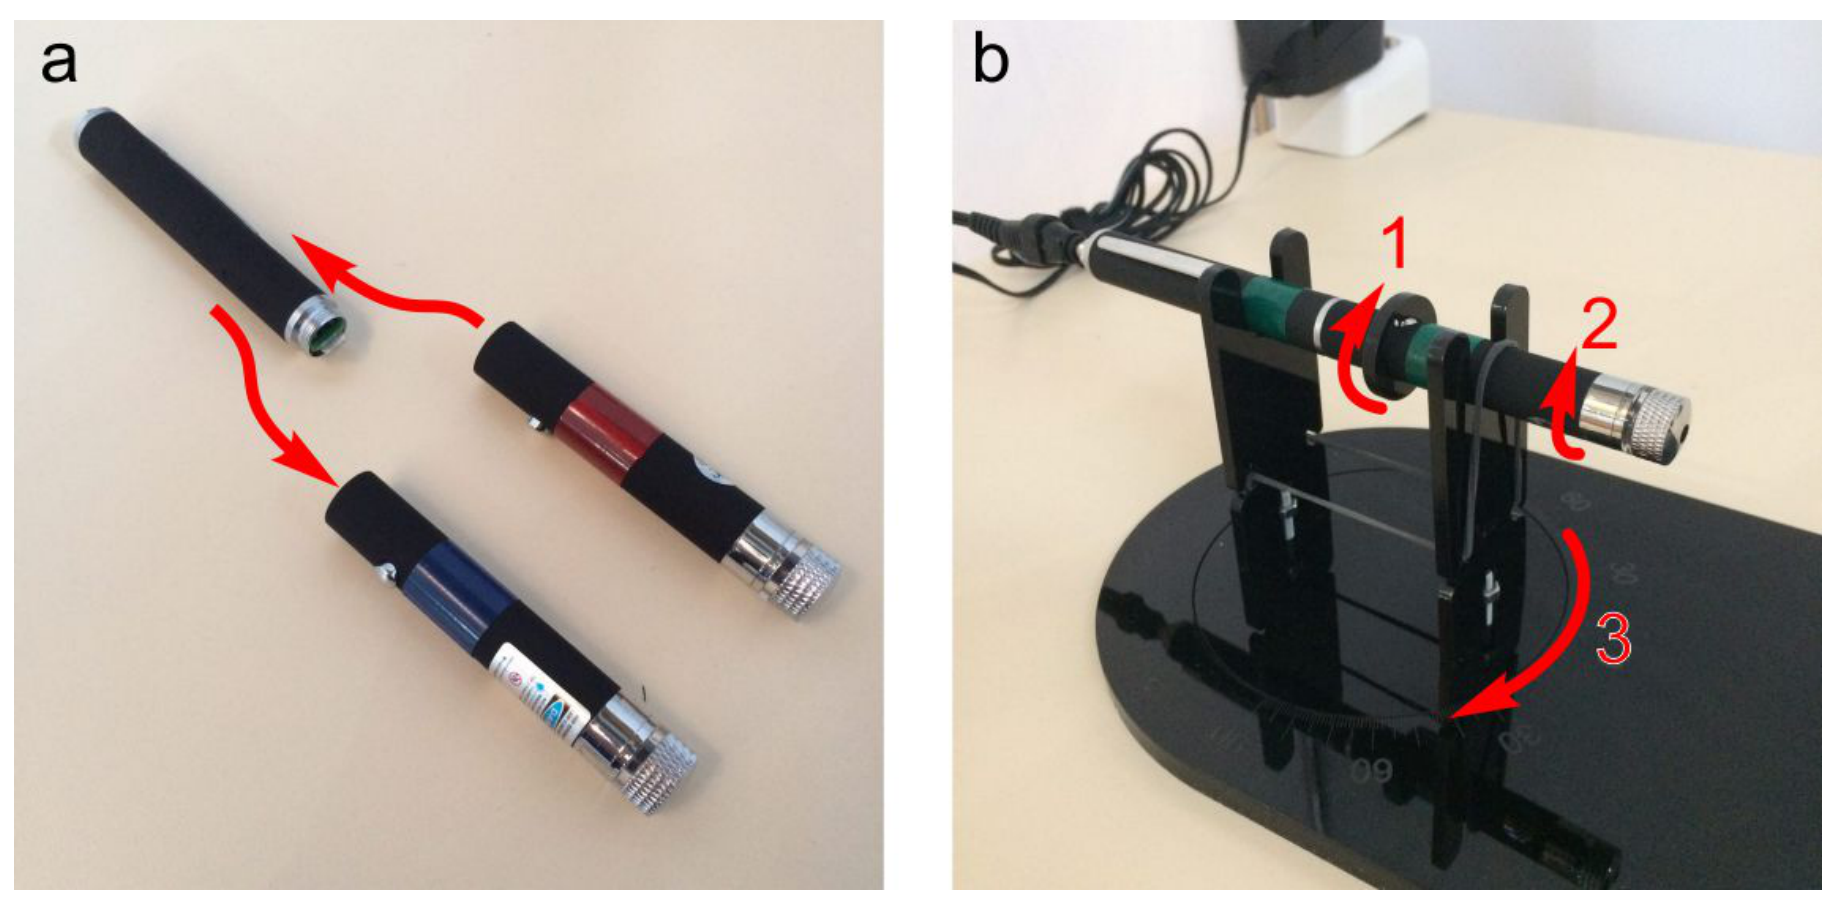
In photometric experiments put the button lock on the laser, place the laser onto the holder and fix it with the rubber band (fig. 5b). Put the holder disk into the left hole of the main bench. Rotate the button lock to turn on the laser (1).
You may need to adjust the laser beam. Start with rotating the laser around its axis until the beam lies in the horizontal plane (2). Then rotate the holder disk to align the beam with the optic bench (3).
Photodiode
For photometric experiments you will need lasers and photodiode to measure the transmitted intensity of the light. The photodiode holder has legs that may be inserted in the slots of the main bench (fig. 6a).
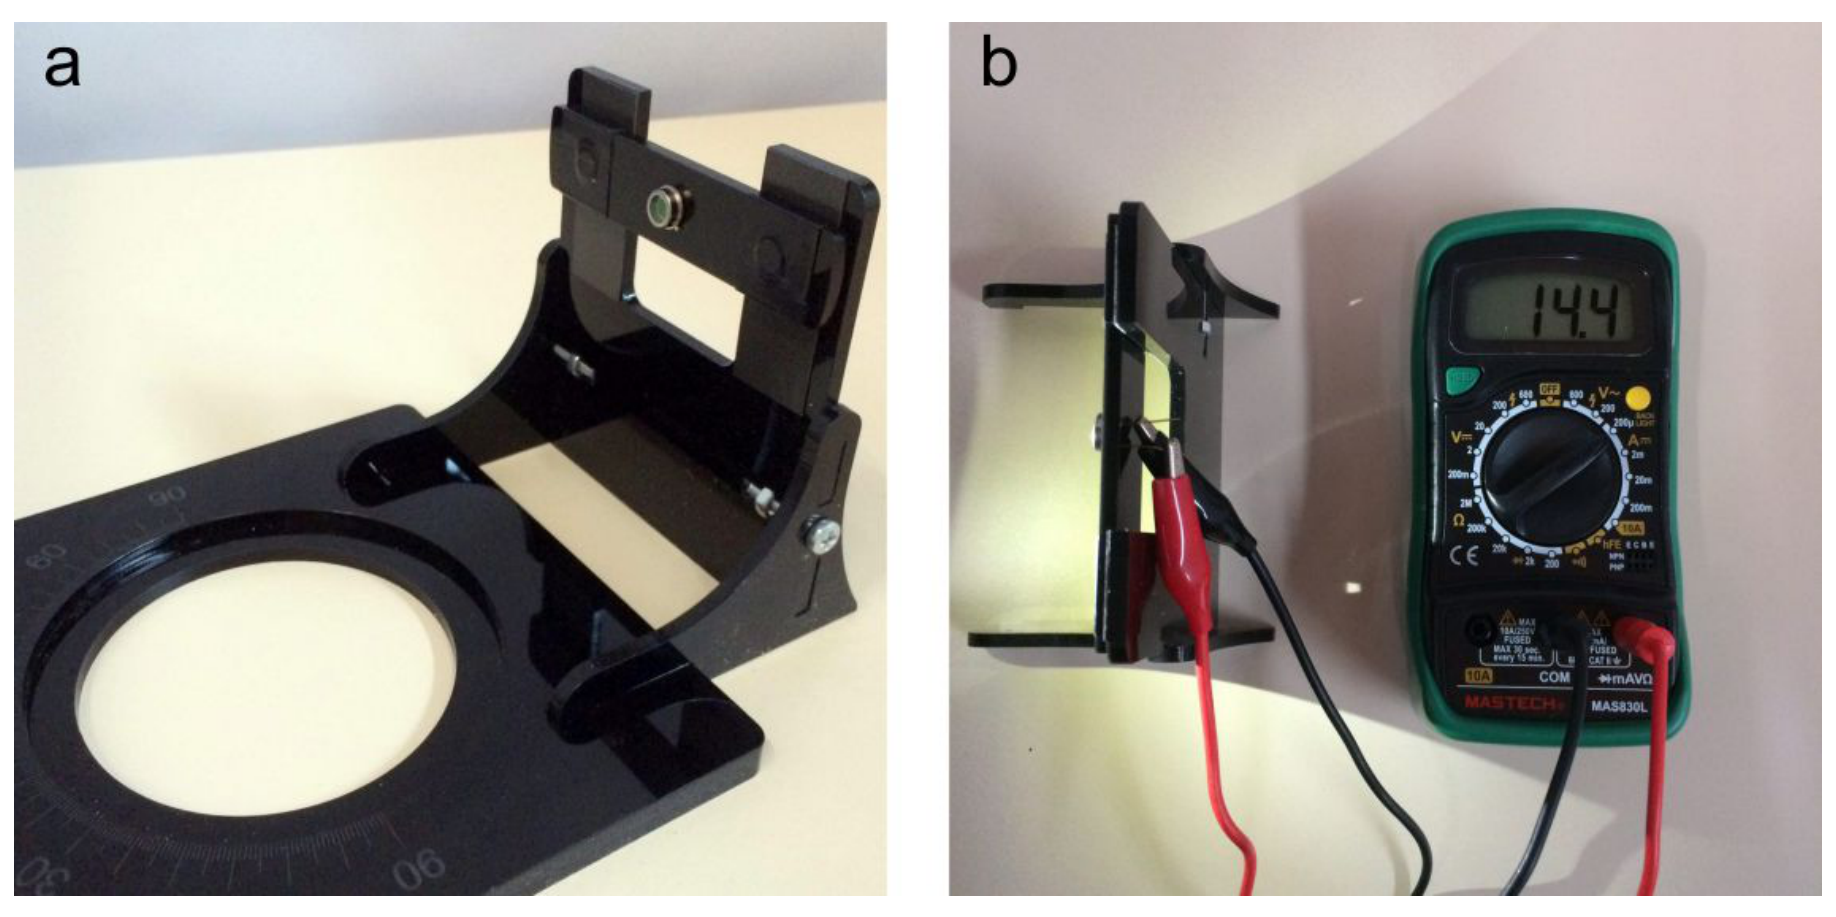
Photodiode is attached to holder with magnets and can be adjusted for the laser beam.
To conduct measurements with the photodiode connect it to the multimeter in DC current mode (μA) (fig. 6b). The current of the photodiode is proportional to the intensity of the incident light, so we will measure the light intensity in μA.
Photonic crystal samples
Photonic crystals are very fragile! Do not touch the crystals! Hold the samples only by the frame!
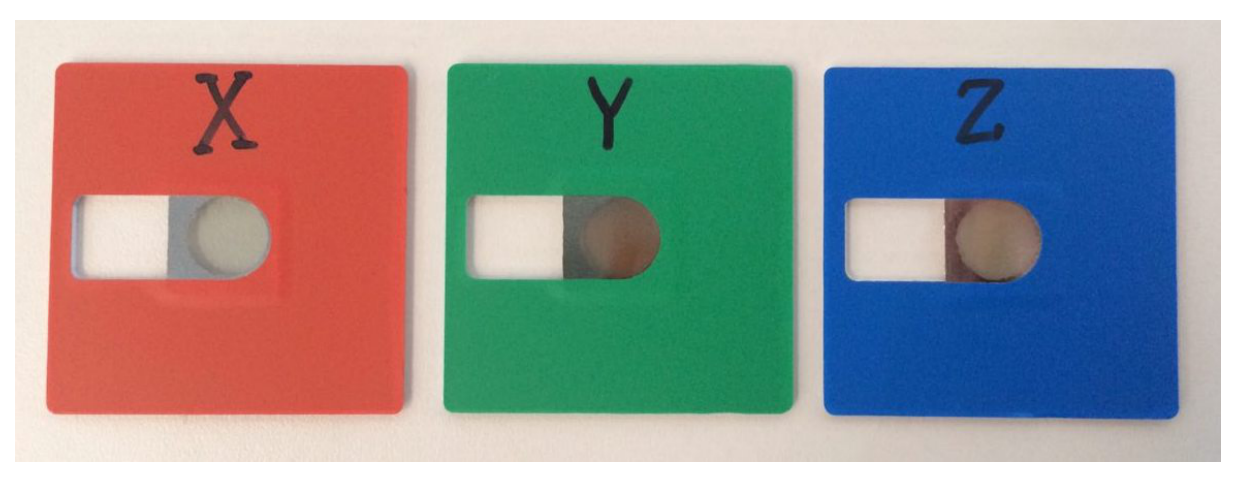
You are provided with three samples of different photonic crystals. They have frontfaces of different colors and a letter, sample name, (X, Y or Z) on the top. Make sure that when you place the sample into the holder, the light beam falls onto the frontface and the letter is on top. While conducting measurements, place the holder disk into the right hole of the main bench. Make sure to rotate the holder disk clockwise, so the reflected light beam is averted.
Bragg-Snell law
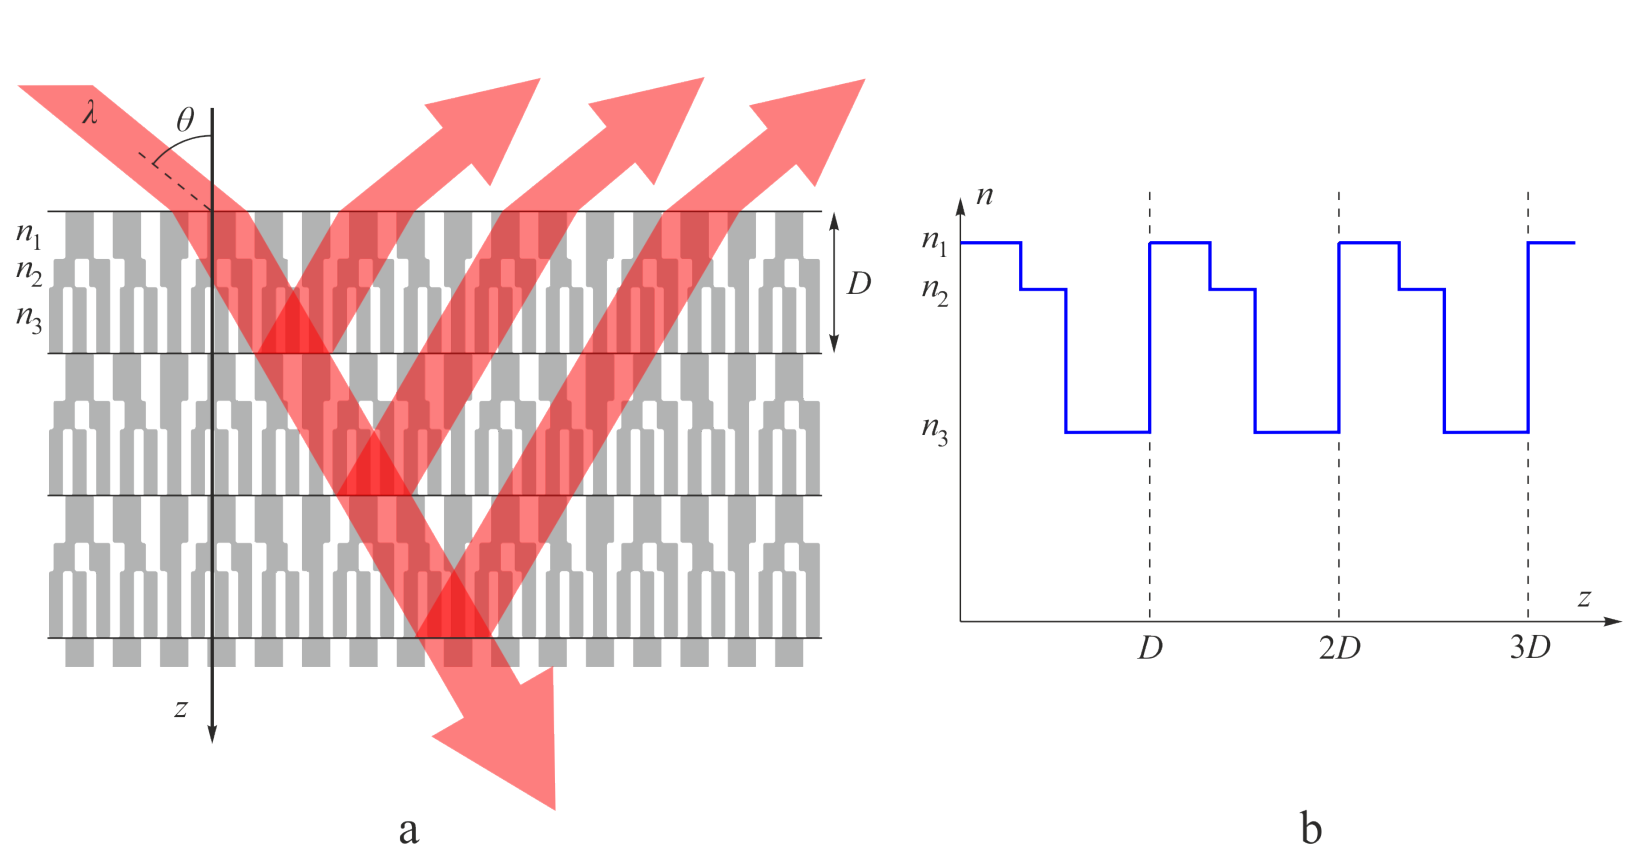
Photonic crystal samples being explored in this problem consist of layers with different refractive indices . The refractive index changes periodically along axis with period and does not depend on a wavelength . Let us denote the overall mean refractive index and refractive indices difference . In AAO crystals
We consider parallel monochromatic incident beam with the wavelength and constant intensity falling on the photonic crystal. The incidence angle is . The beams reflected from different layers interfere. As a result, mirror reflection has maximums at angles that satisfy the equation:
where is an integer number representing the interference order.
Equation (2) is called the Bragg-Snell law. Transmittance minimums are observed at the same angles . If angle is constant, and wavelength varies, Bragg-Snell law may be regarded as an equation for . Fig.9 shows sketches of reflectance and transmittance spectra. Each transmittance minimum corresponds to some integer value according to the Bragg-Snell law.
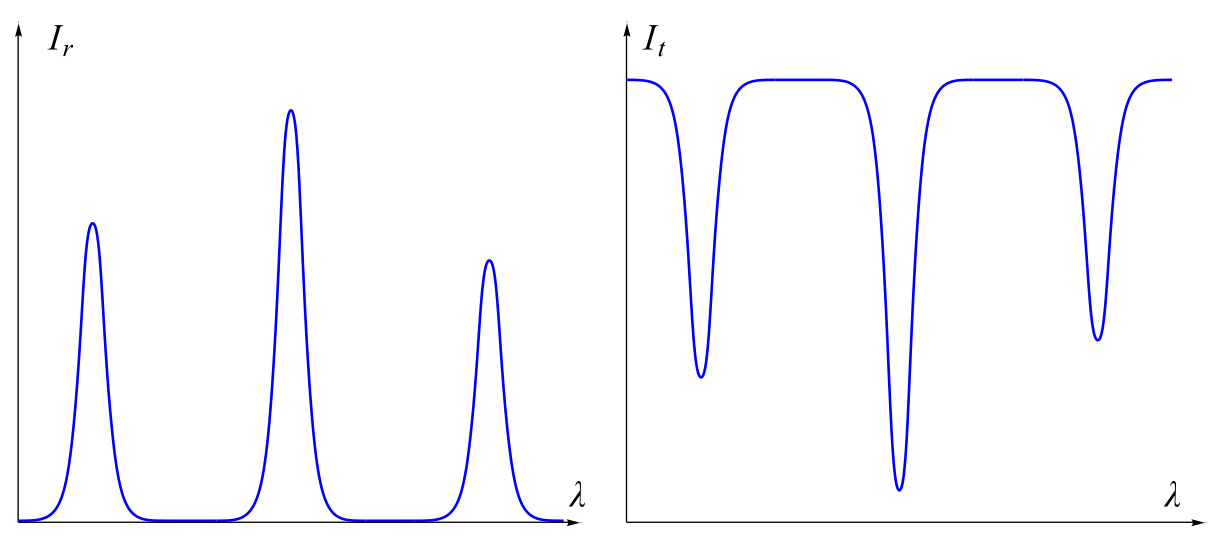
The wavelengths satisfying the Bragg-Snell law (2) will be called the wavelengths of transmittance minimums. The wavelengths of transmittance minimums depend on the incidence angle . The transmittance minimums wavelengths at will be called the normal wavelengths of transmittance minimums for a particular photonic crystal.
You do not need to evaluate errors in this problem.
Part A. Sample X. Spectral measurements (3,5 т.)
Sample X has a simple structure (fig. 10). Its period consists of two layers with the same thickness and with close refractive indices and :
Assemble the experimental setup for the spectral measurements. Place the diffraction arm into the left hole of the main bench;
Turn on the lamp. Look at the diffraction grating from the other end of the optical bench. Rotate the diffraction arm until you see the first diffraction order (a rainbow strip).
Install the sample holder into the right hole of the main bench (set the triangular mark on zero). Place Sample X in the holder (the light should fall onto the red frontface). Look at the rainbow strip of the diffraction grating through the sample.
If you rotate the sample clockwise at the right angle, you can see a dark region in the transmitted spectrum (fig. 12). This is the transmittance minimum corresponding to in the Bragg-Snell law. When you rotate the sample, the wavelength of the transmittance minimum changes.
By moving the lens, you can see wider or narrower part of the spectrum. For precise measurements place the lens in such a manner, that the lamp will be located in the focal point.
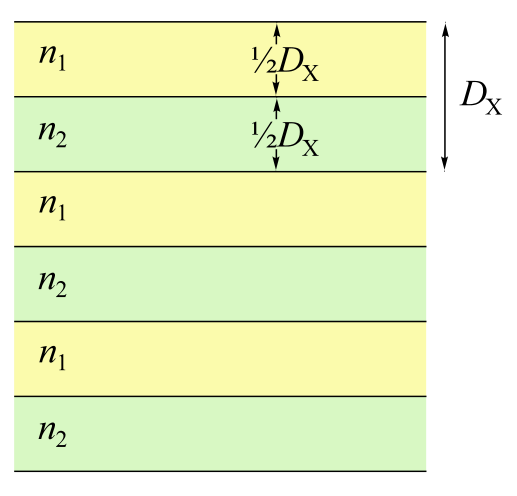
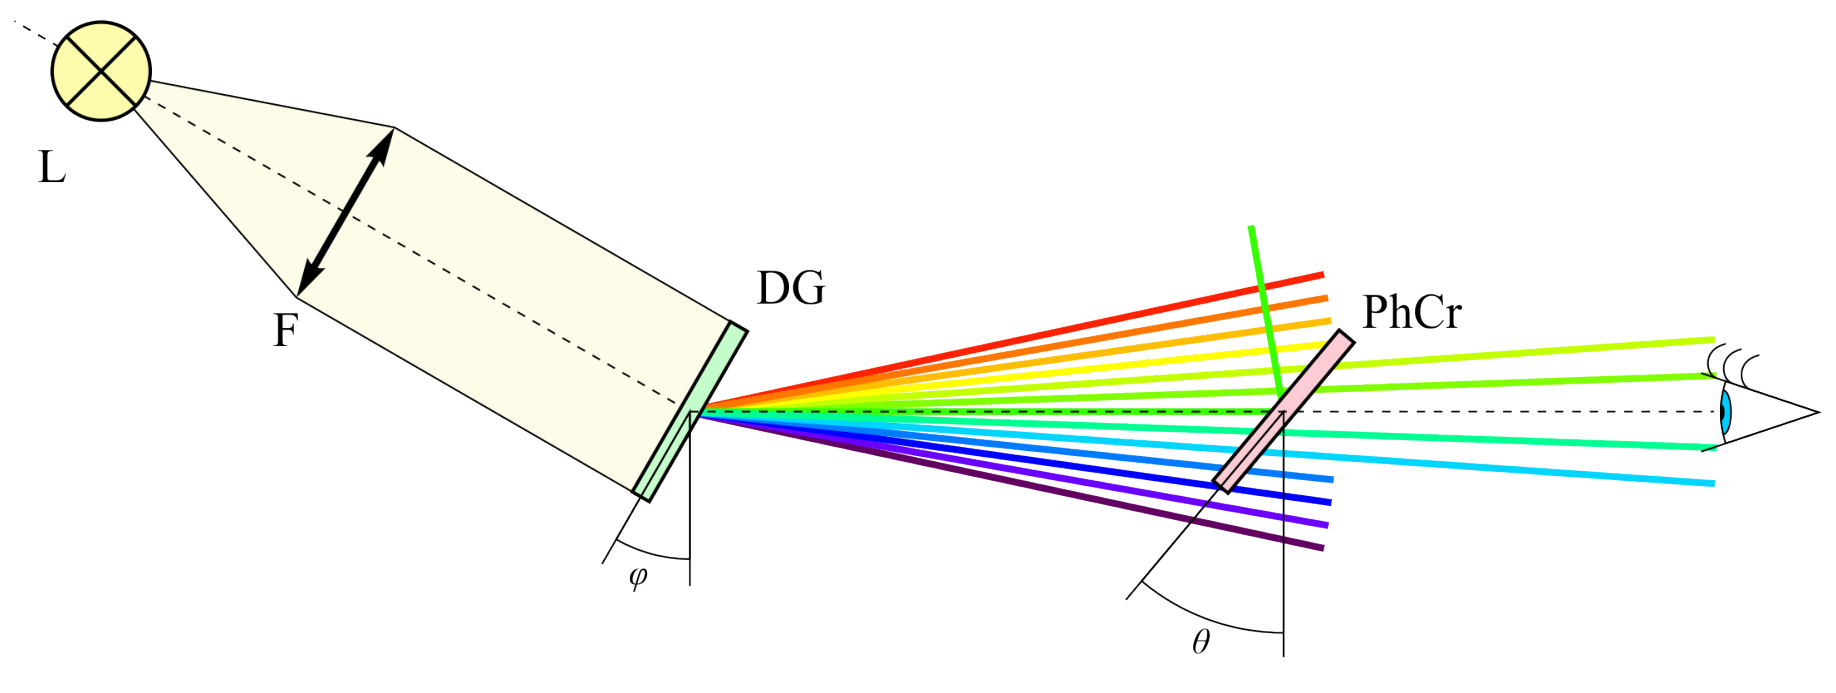
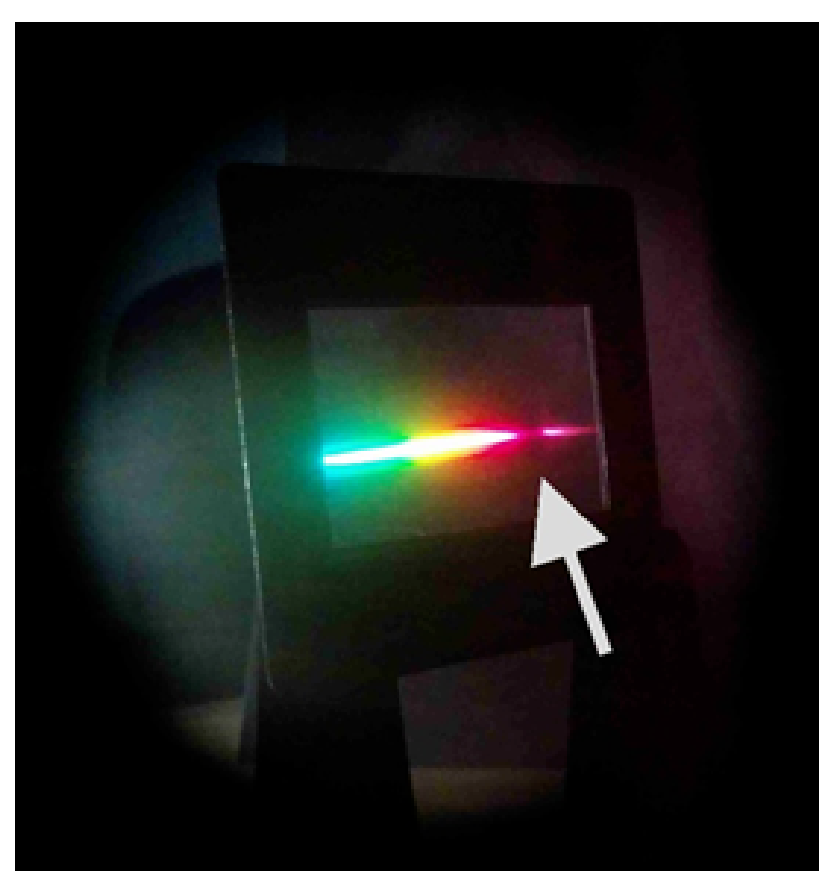
A.1 Light falls on the diffraction grating perpendicular to its surface. Write down the equation, connecting the diffraction angle and the wavelength . Grating period is nm. You can write down the answer without deriving it. [0,1 т.]
A.2 Measure the angle of incidence , at which you see the transmittance minimum, as a function of the diffraction angle . Take reading at such that transmittance minimum (dark region) can be seen in the middle of the grating window. [1 т.]
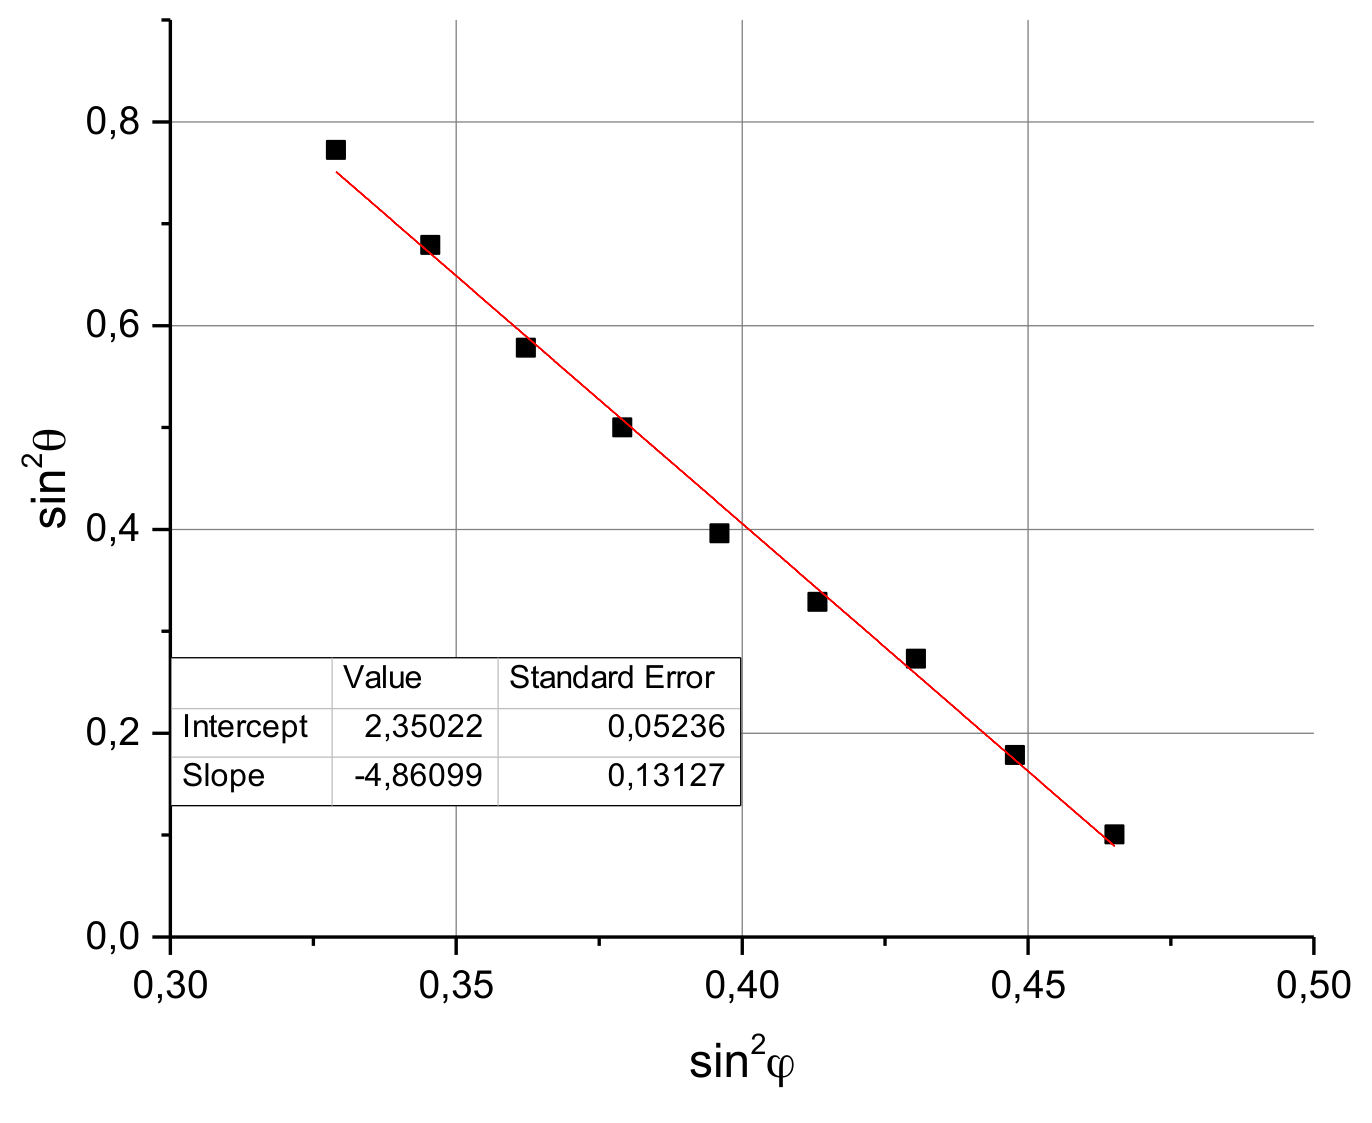
A.3 Find new coordinates instead of on to test that graph would be linear. Plot the graph in new coordinates. [1,5 т.]
A.4 Determine the sample period and the mean refractive index . [0,9 т.]
Part B. Sample X. Laser measurements (5 т.)
The porosity of the crystal is a fraction of the crystal volume filled with air (channels). Crystal effective refractive index can be expressed in terms of air refractive index and aluminum oxide refractive index :
If channels are filled with water, the refractive index of crystal changes:
where is the refractive index of water.
In this part we will determine the porosity of the photonic crystal by comparing the experimental data for dry and wet samples. We will use the setup for laser measurements.
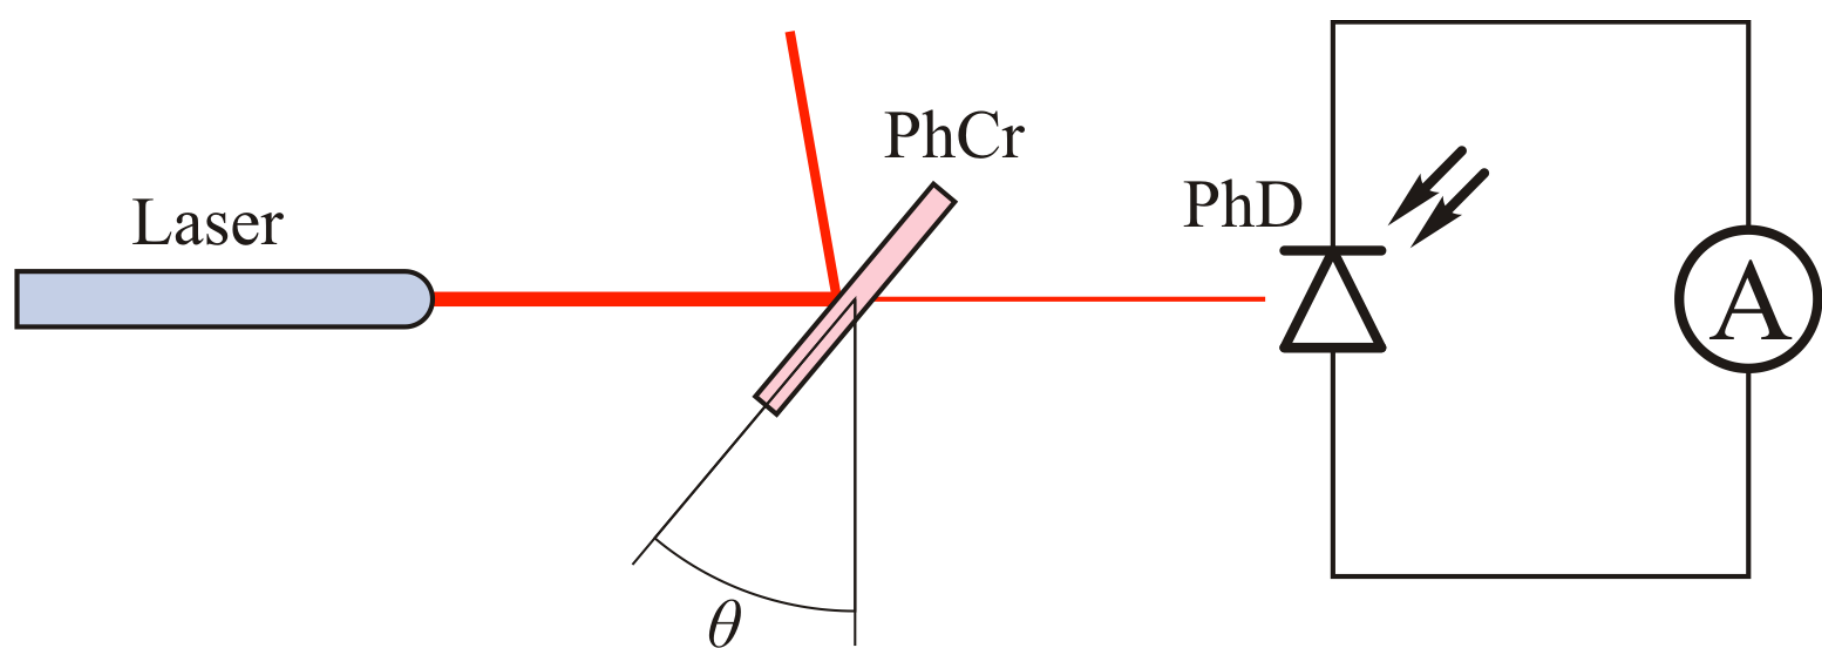
B.1 Choose the laser such that the transmittance minimum may be observed at laser wavelength at some sample rotation angle . Write down the wavelength of the laser you have chosen. [0,1 т.]
Use the chosen laser in all tasks of part B.
Assemble the experimental setup for laser measurements (fig. 13).
Do not stare into the laser beam directly! Keep track of reflected beams, they must not get into your eyes. Even short exposure may seriously damage your eyes. Do not hold your head on beam level when you conduct any laser experiments.
Before collecting any data in laser experiment, make sure that laser intensity is constant. If it is not, wait for 3-5 minutes.
B.2 Measure the intensity of laser light (in μA) transmitted through the photonic crystal as a function of . [1 т.]
B.3 Plot the graph . [1 т.]
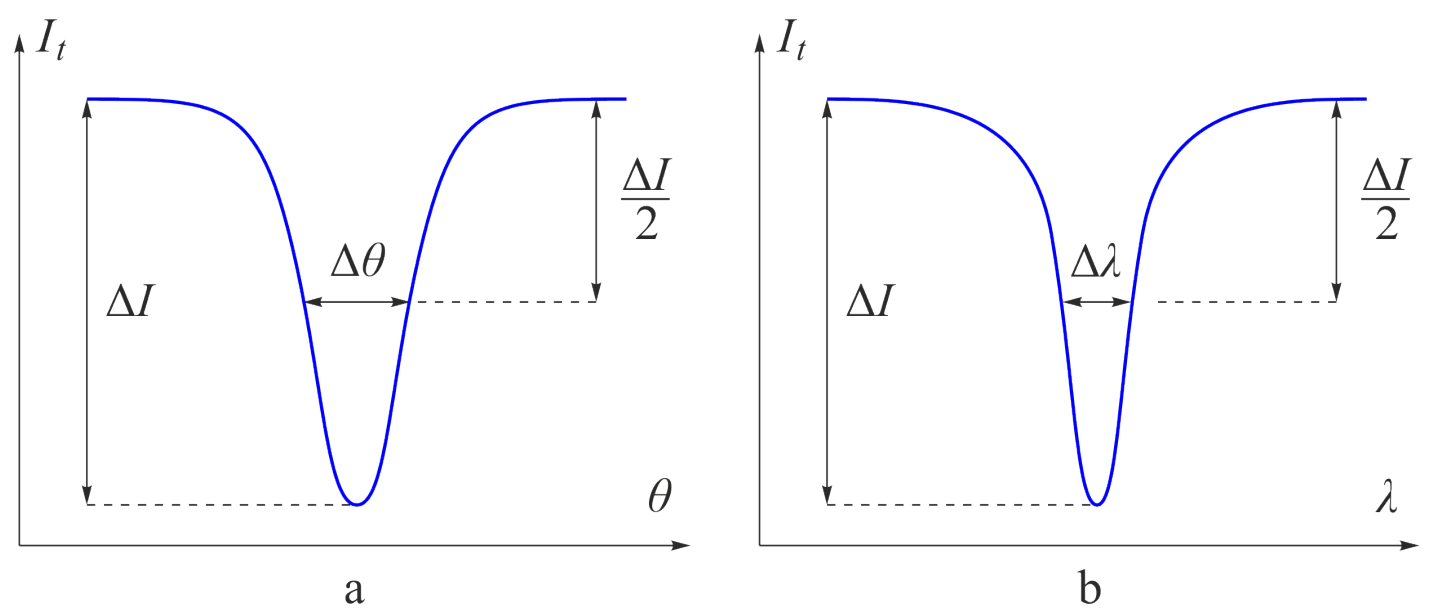
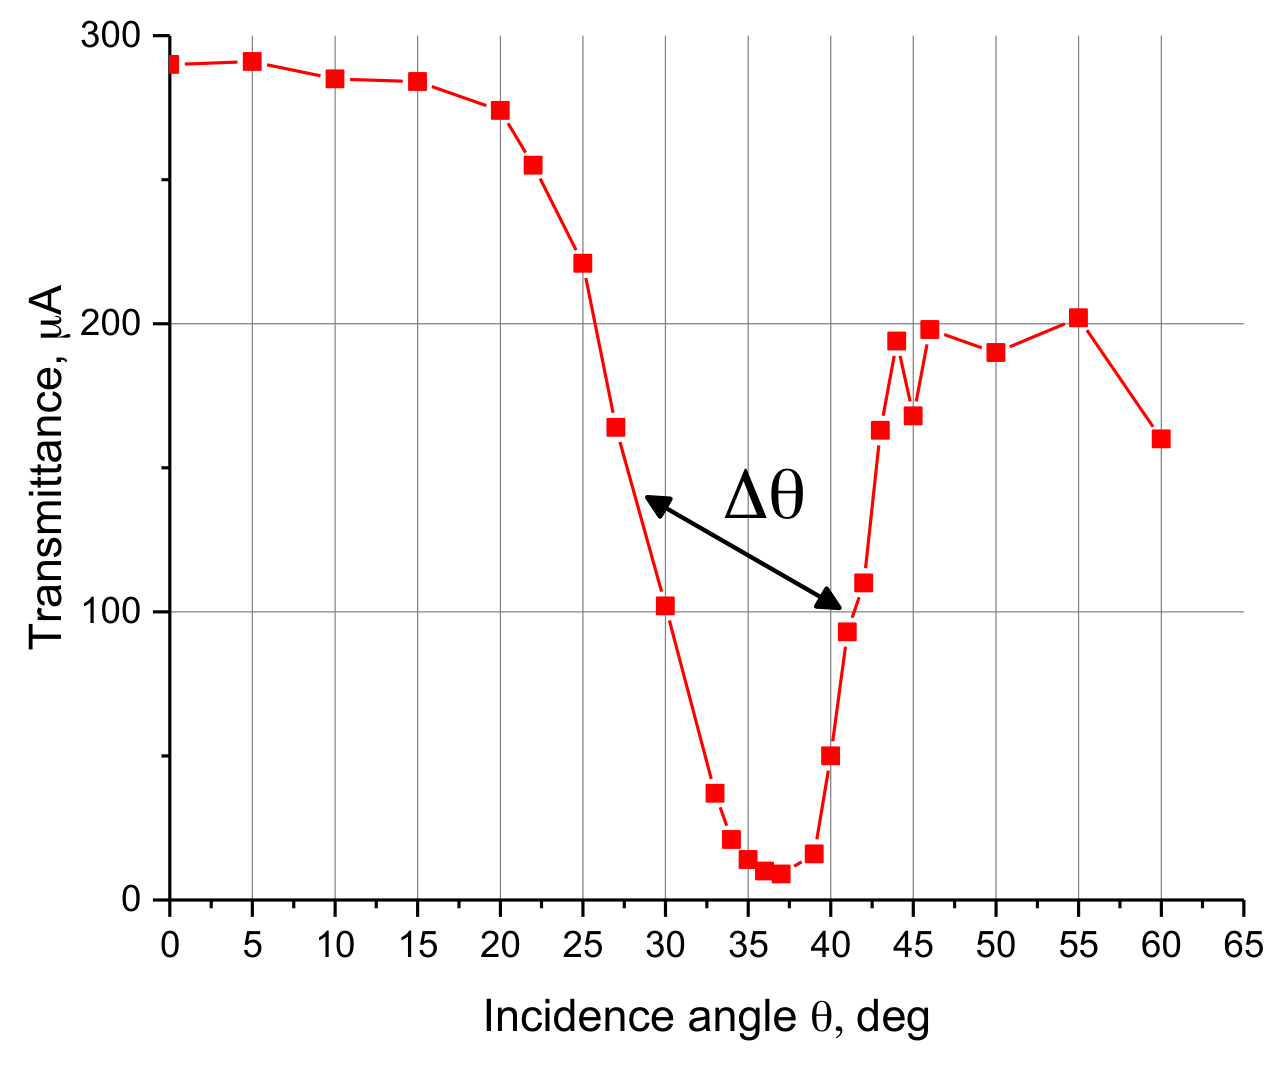
B.4 Determine the angle of incidence , corresponding to the transmittance minimum at the laser wavelength. Determine the width of the valley on plot at the level of half-depth (fig. 14a). [0,2 т.]
B.5 Using the Bragg-Snell law (2), determine the transmittance minimum normal wavelength for sample X. Use the value from part A, from B.4 and laser wavelength . [0,2 т.]
When light falls perpendicular to the crystal (), spectral width (fig. 14b) of transmittance minimum, corresponding to , can be expressed in terms of and as follows:
To estimate for the sample X, assume that relational spectral width of transmittance minimum does not change with rotation.
B.6 Estimate refractive indices difference of sample X. [0,6 т.]
Place some water on the face side of the sample X. Carefully place a coverslip over the sample to prevent water evaporation during the experiment. There is a solid oxide layer 15 nm thick on the back side of the sample which prevents water from pouring out.
Be careful! Samples are very fragile. Their width is a quarter of a hair diameter. Operate samples only by the frame. The coverslip is very fragile too! Hold it only with tweezers.
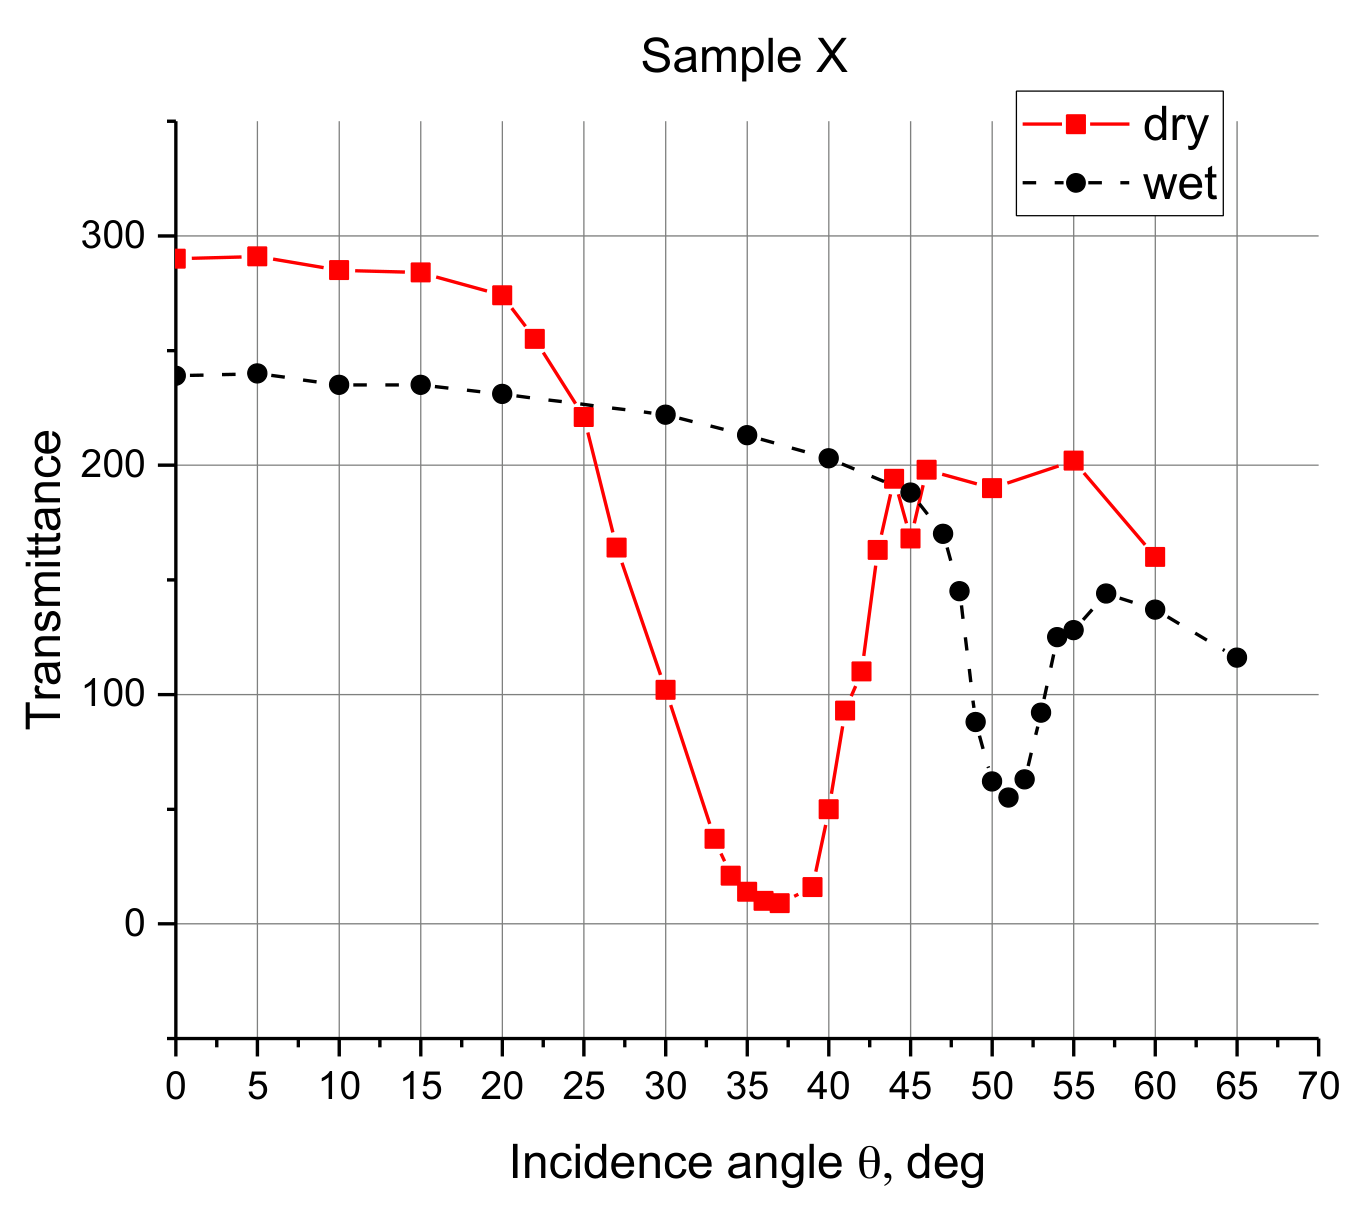
B.7 Determine the angle of incidence corresponding to the transmittance minimum of the wet sample at the laser wavelength. [0,3 т.]
B.8 Determine the mean porosity of the sample X and aluminum oxide refractive index . [1 т.]
B.9 Determine the mean porosities and of the layers in sample X. [0,6 т.]
Part C. Sample Y. Several transmittance minimums (4,5 т.)
Sample Y structure is more complicated than the one of sample X. Sample Y has 4 transmittance minimums in the visible spectral range (400–800 nm) corresponding to 4 consecutive integers in the Bragg-Snell law (2). The refractive indices of samples Y and X are the same .
C.1 Although there are 4 transmittance minimums for sample Y, you can observe only three of them in spectral measurements. Using spectral measurements (see part A), determine the normal wavelengths of these three transmittance minimums , , . [0,6 т.]
Now conduct laser measurements for the sample Y (see part B). Laser measurements let you determine normal wavelengths of transmittance minimums with greater accuracy. Moreover, you will be able to determine transmittance values which you will need in part E.
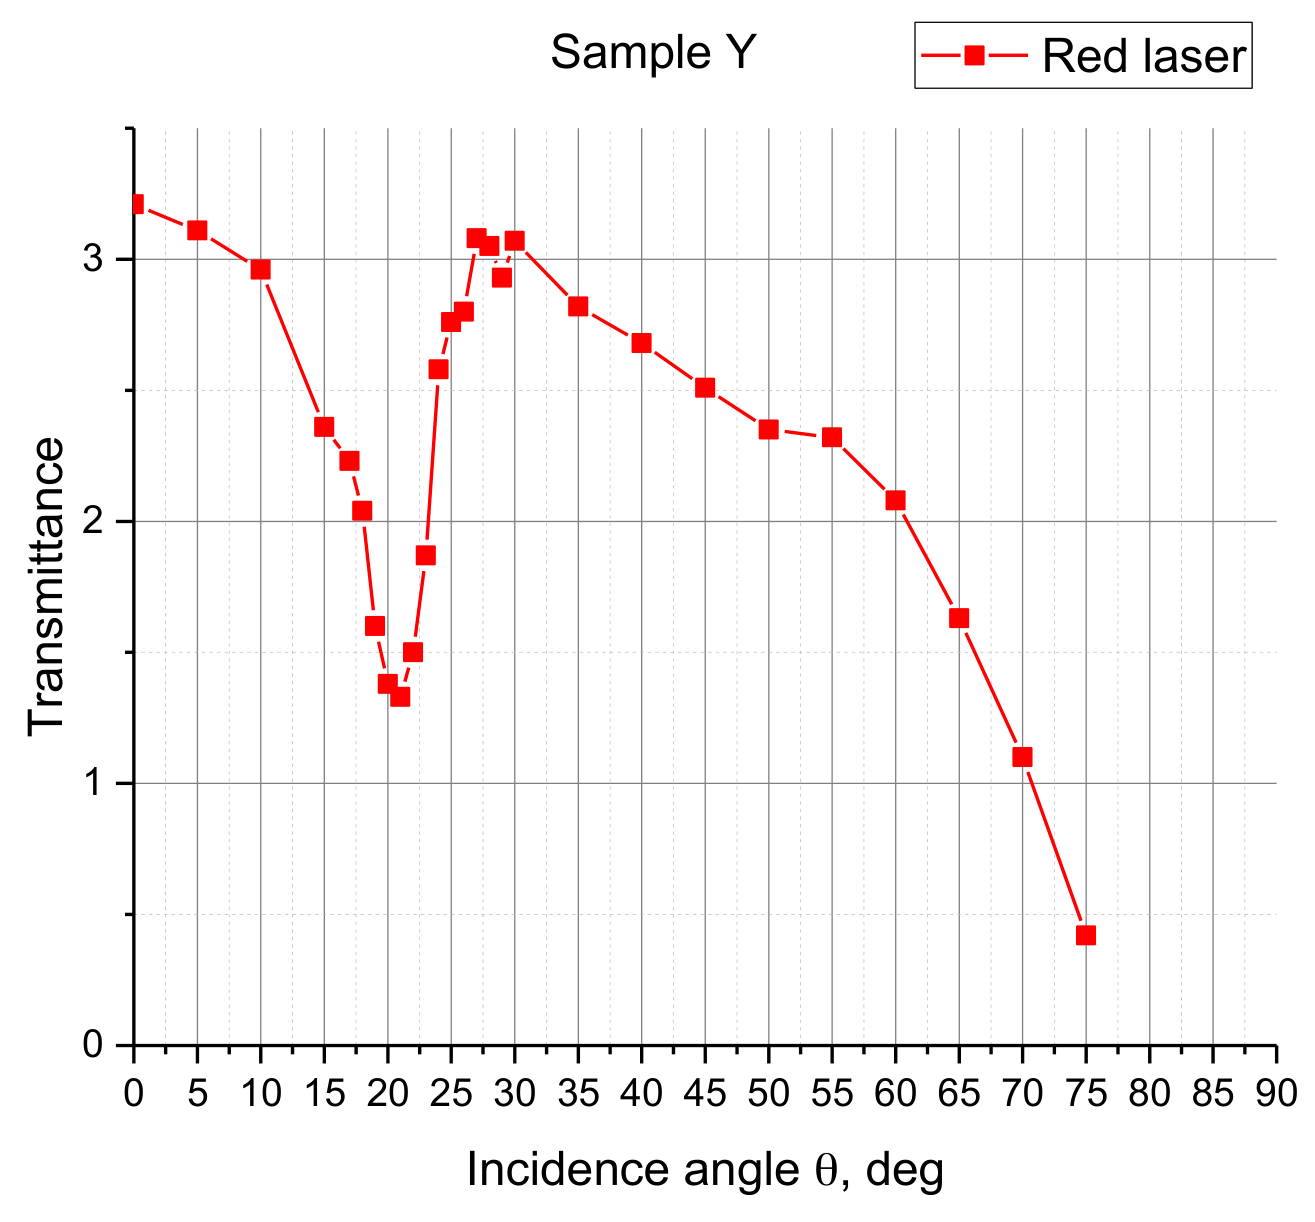
C.2 For red laser, measure transmitted light intensity as a function of the sample rotation angle . [0,5 т.]
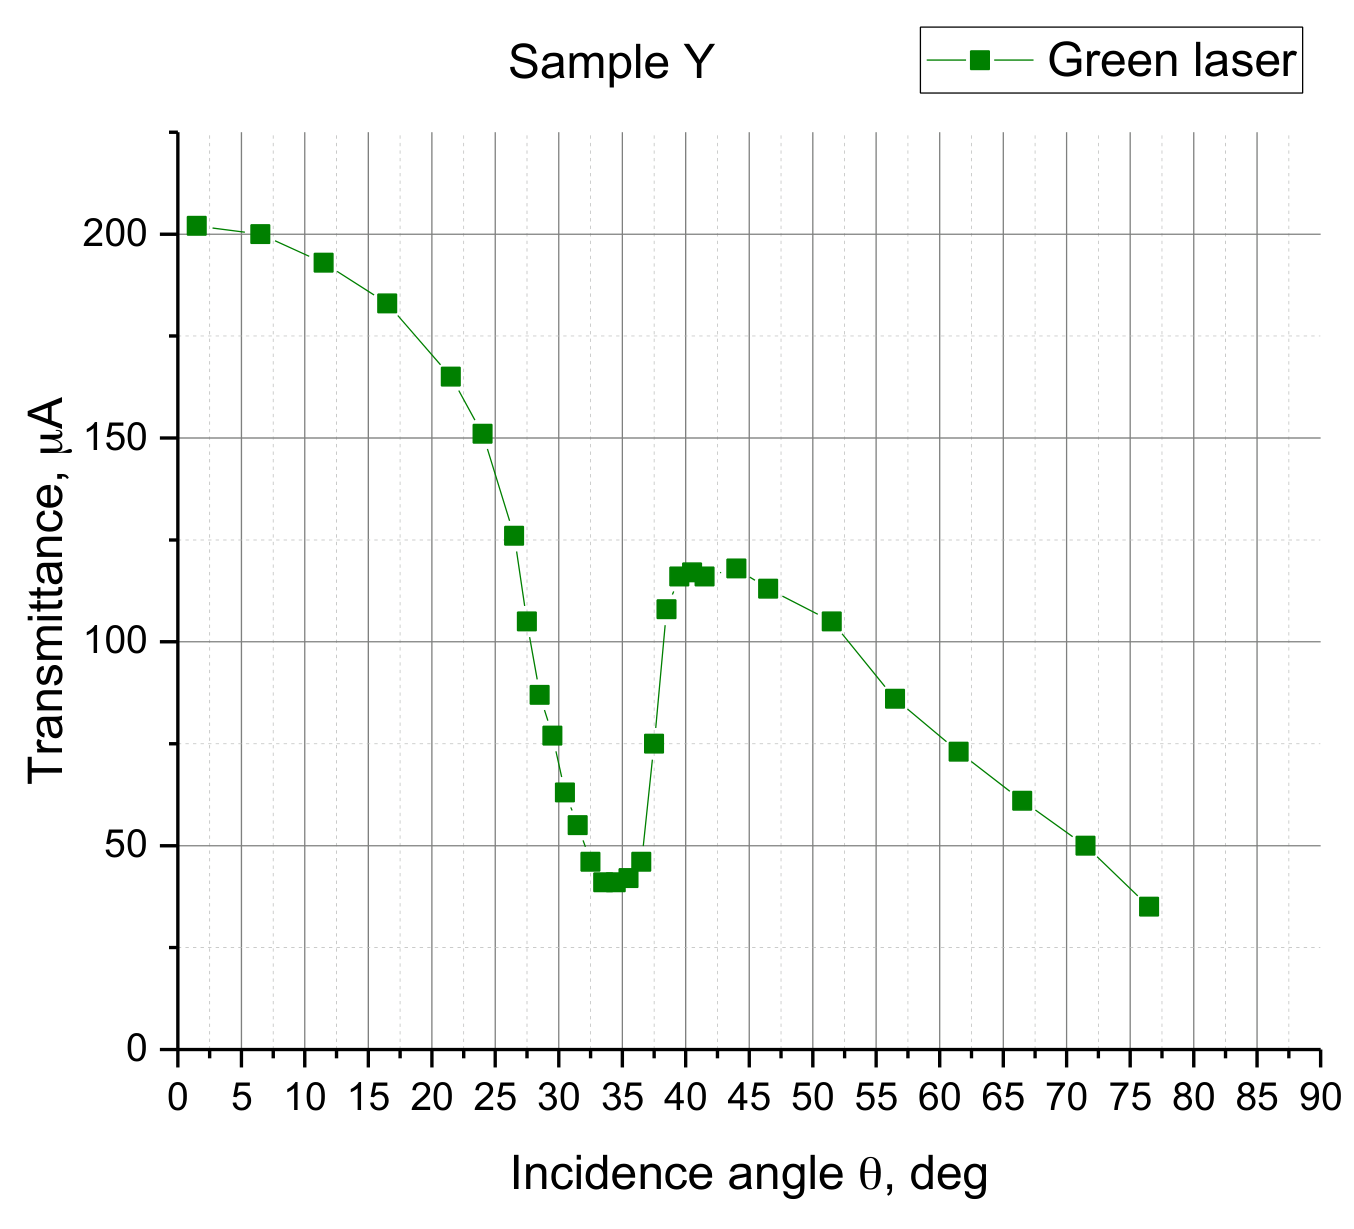
C.3 For green laser, measure transmitted light intensity as a function of the sample rotation angle . [0,5 т.]
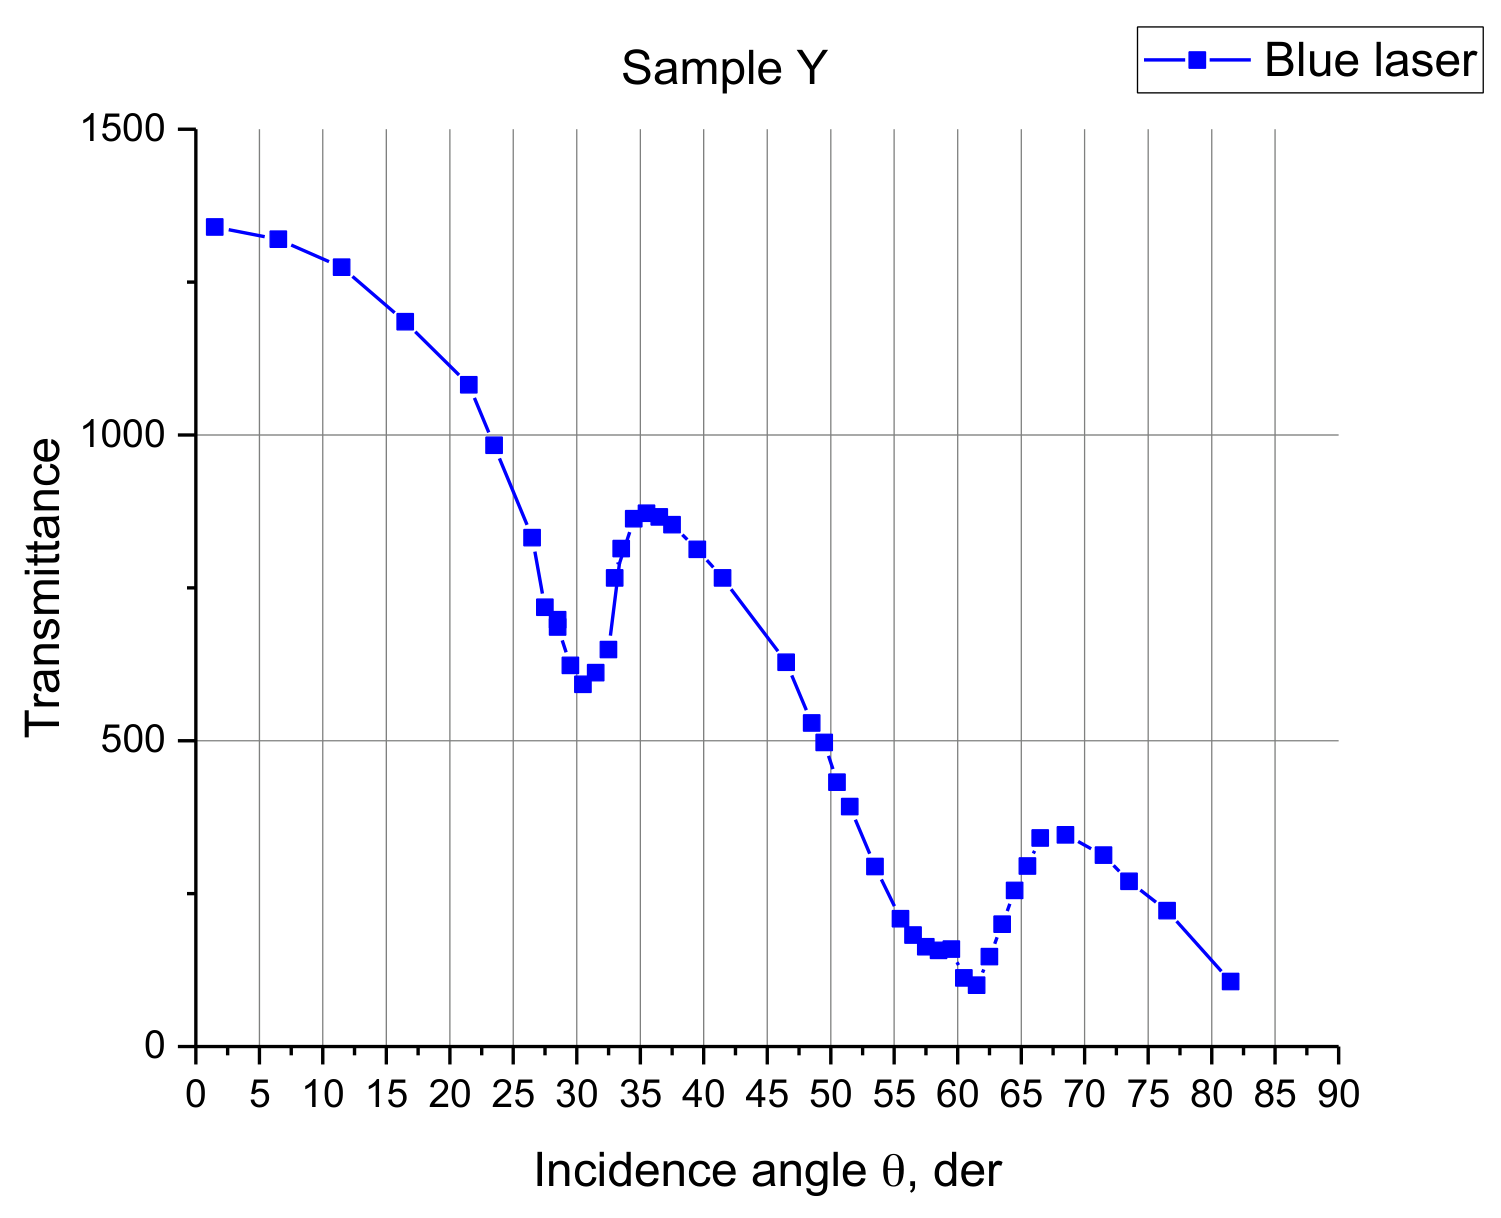
C.4 For blue laser, measure transmitted light intensity as a function of the sample rotation angle . [0,5 т.]
C.5 Using data obtained in tasks C.2–C.4, determine normal wavelengths of 4 transmittance minimums. [0,6 т.]
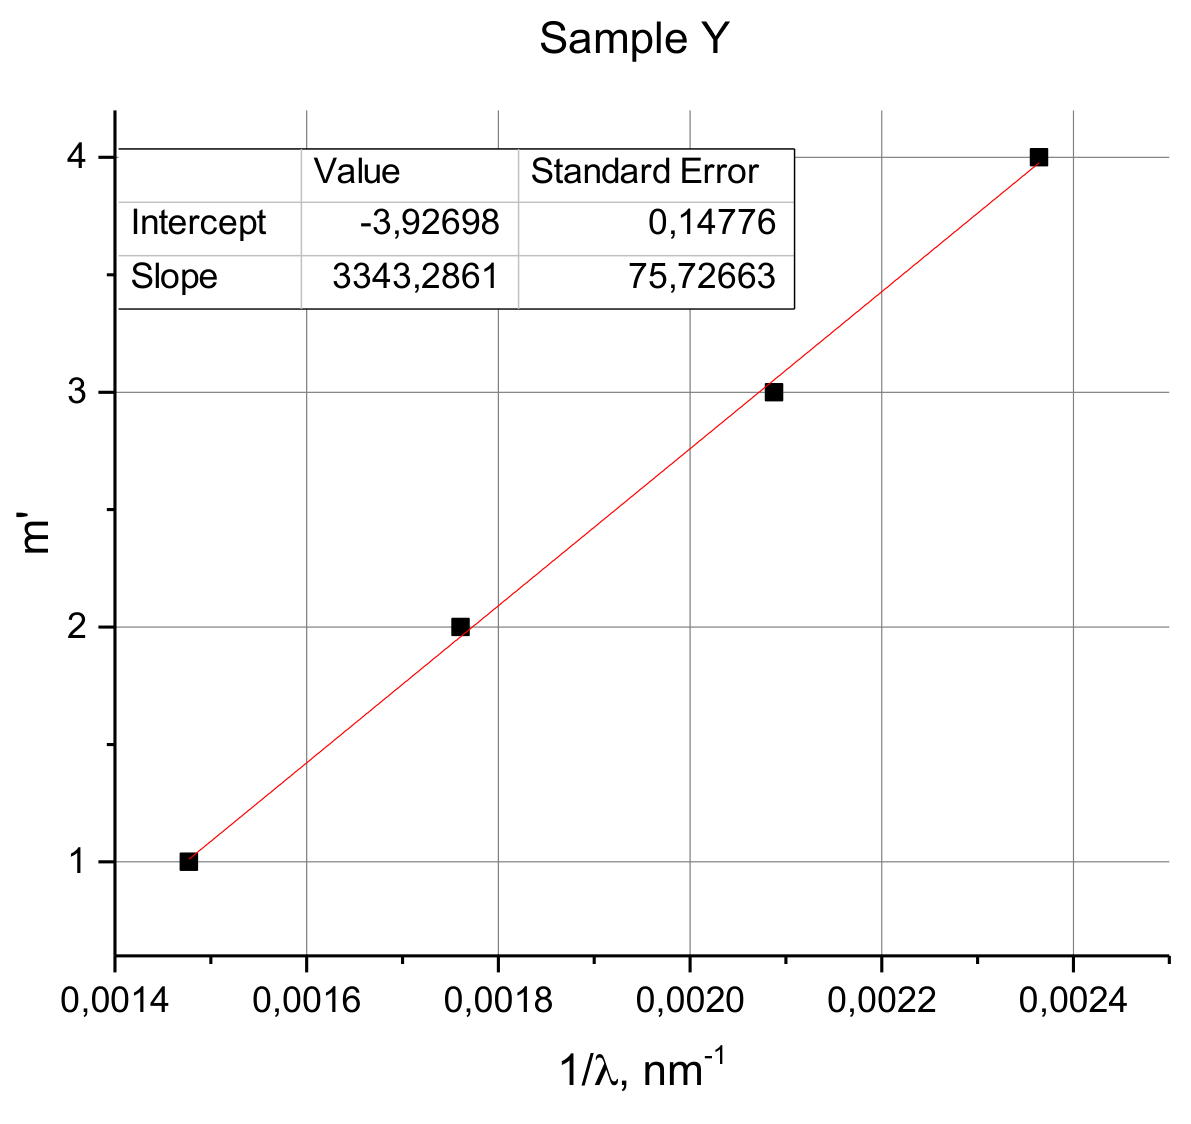
C.6 Determine integers corresponding to 4 normal wavelengths obtained in C.5. You may plot a graph if you need. [1 т.]
C.7 Determine the period of the sample Y in nanometers. [0,2 т.]
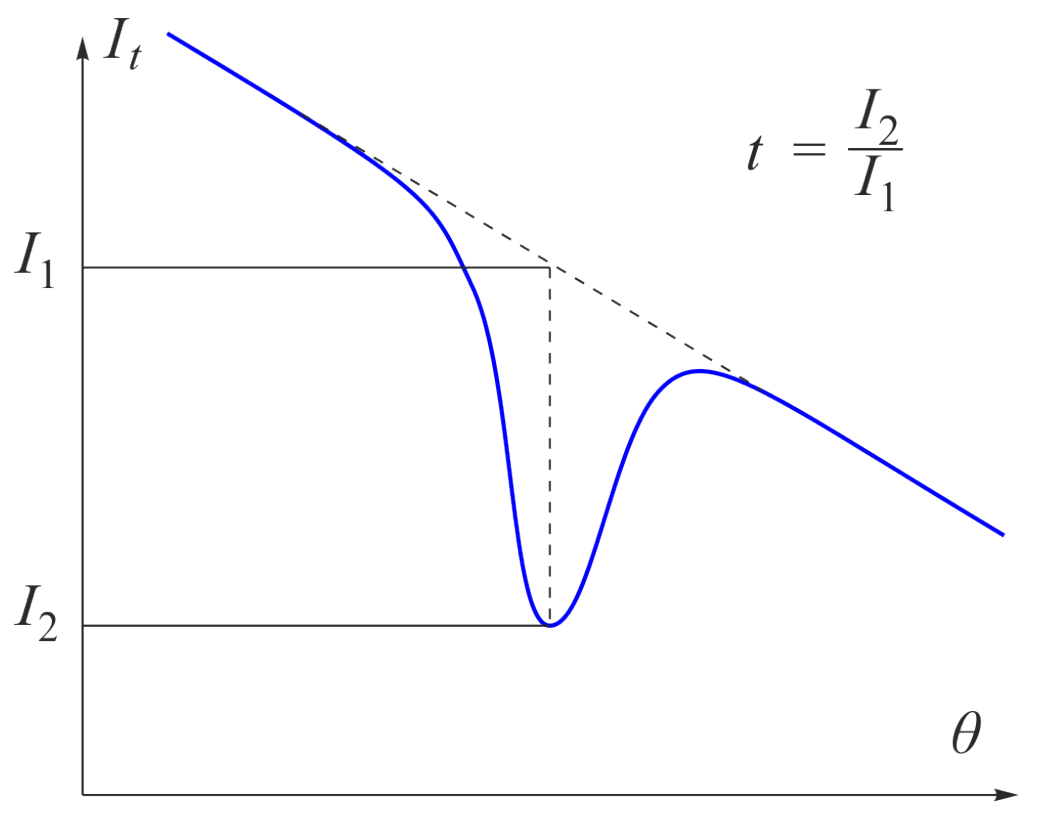
C.8 Determine the transmittance values of 4 transmittance minimums of the sample Y (fig. 15).
These values will be used in part E to determine the structure of the sample Y. You may plot graphs if you need it, though it is not required. [0,6 т.]
Part D. Sample Z. Missed transmittance minimums (4,5 т.)
The Bragg-Snell law (2) determines angles and wavelengths at which transmittance minimum may be observed. Transmittance values depend on the internal structure of the period. A sample may have a specific structure such that some transmittance minimums predicted by the Bragg-Snell law have and therefore can not be seen. We will call these transmittance minimums missed transmittance minimums. We will call minimums that are not missed visible.
Regard transmittance minimum as missed if it can not be seen in spectral or laser experiments at the position predicted by the Bragg-Snell law. The sample Y has no missed transmittance minimums. Conversely, the sample Z has 2 missed minimums in the visible spectrum. This means that not all visible transmittance minimums correspond to consecutive .
Mean refractive indices of the samples X and Z are the same: .
D.1 Determine normal wavelengths of visible transmittance minimums of the sample Z. Use spectral and laser experiments. Describe your experiments with sketches and equations. [1,2 т.]
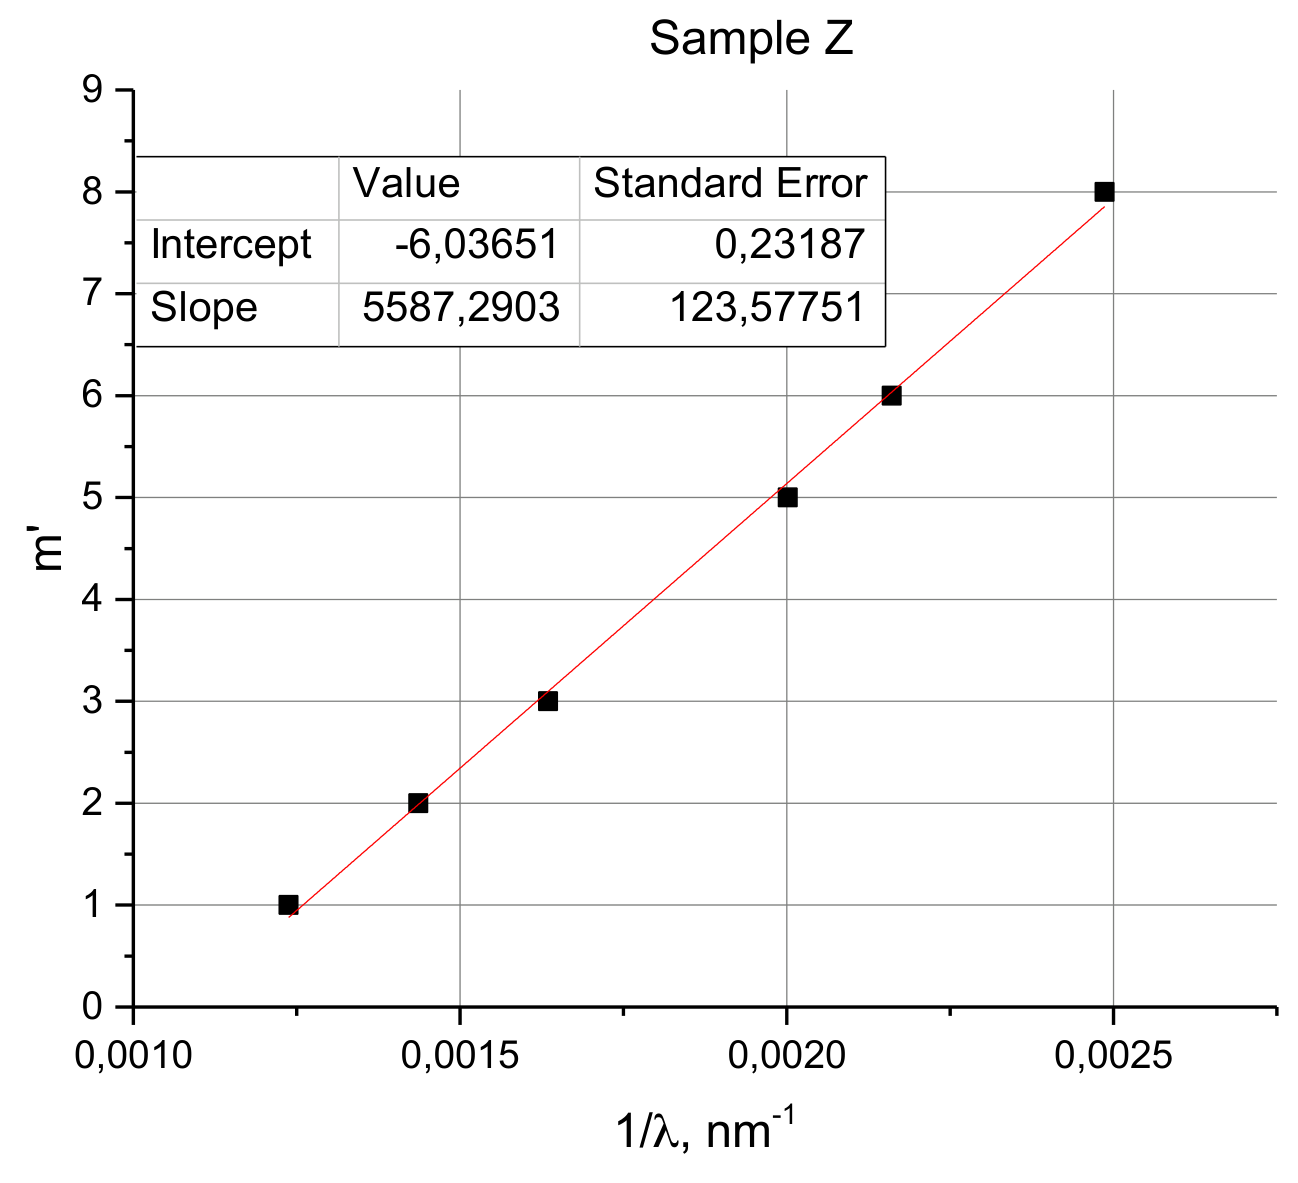
D.2 Determine integers corresponding to visible transmittance minimums. You may plot a graph if you need. [2 т.]
D.3 Determine period of the sample Z in nanometers. [0,3 т.]
D.4 Determine, which transmittance minimums are missing. Derive their in Bragg-Snell law and normal wavelengths . [1 т.]
Part E. Samples Y and Z. Internal structure of the period. (2,5 т.)
The Bragg-Snell law (2) describes angles and wavelengths, where reflectance maximums and transmittance minimums may be observed (fig. 9). Transmittance values depend on the internal structure of the period.
Simple theory for the reflectance values is discussed in this part. Normal incidence of light () is considered. Such being the case, the Bragg-Snell law simplifies:
where is the period of the crystal.
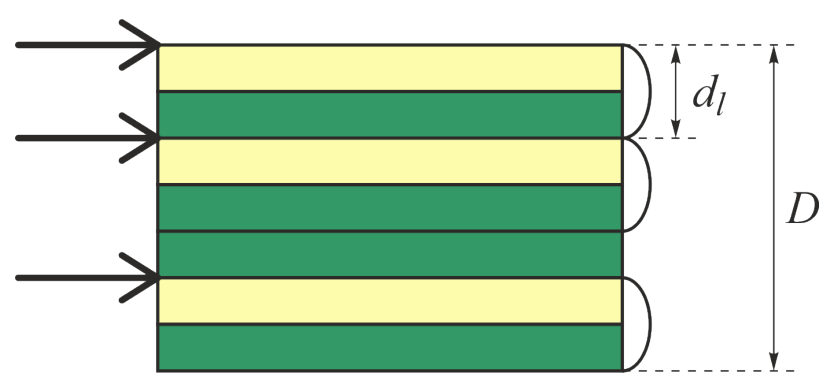
In the model we assume that light reflects only from boundaries where it travels from high to low refractive index layer. Reflective boundaries considered in the model are marked in fig. 16 with arrows.
The samples X, Y, and Z consist of the layers with the same thickness and 2 different refractive indices, so we will limit ourselves only to this particular case.
Let be the thickness of bilayer, crystal period, the distance between the beginning of the period and the reflective boundary .
For example, structure on Fig. 16 has crystal period , the distances to reflective boundaries are , , .
For the beam reflected from layer phase advance is
Considering interference between beams reflected from one period, we deduce that reflective intensity for reflectivity maximum of the Bragg-Snell law is:
where – imaginary unit.
The model considered above is not quantitatively correct. But it keeps the order of reflectance maximums: you can compare the magnitudes of maximums and say, which would be more intensive. If reflectance maximum is intense, transmittance value of transmittance minimum is low. If reflectance maximum is low enough, we consider it as missed transmittance minimum.
In the appendix there is a table with the values calculated according to equation (9) for the integer from 1 to 20. The intensity is calculated according to (9) for . In that case all the reflected beams interfere without phase shift to output the maximum intensity possible. Values are expressed in .
The structures of the samples Y and Z are in the table among others.

E.1 Compare transmittance values for the sample Y obtained in C.8 with the table in the appendix. Determine the structure of the sample Y. Write the name of the structure in the answer sheet. [1,2 т.]
E.2 Determine the structure of the sample Z. Write the name of the structure in your answer sheet. [1,3 т.]
Appendix
Possible variants of structures of samples Y and Z. Names of the structures are given under the pictures. Numbers in the table are .
| m | i5-5 | i3-3 | i2-1 | n-3 | n-6 | n-9 | hi5-5 | h5-5 |
|---|---|---|---|---|---|---|---|---|
| 1 | 1 | 3 | 11 | 3 | 1 | 0 | 1 | 0 |
| 2 | 0 | 0 | 33 | 7 | 1 | 0 | 0 | 0 |
| 3 | 1 | 6 | 11 | 56 | 1 | 0 | 1 | 0 |
| 4 | 0 | 0 | 33 | 56 | 2 | 0 | 0 | 0 |
| 5 | 2 | 41 | 11 | 7 | 6 | 1 | 2 | 0 |
| 6 | 0 | 0 | 100 | 3 | 48 | 1 | 1 | 0 |
| 7 | 5 | 41 | 11 | 100 | 48 | 2 | 3 | 0 |
| 8 | 0 | 0 | 33 | 3 | 6 | 5 | 6 | 0 |
| 9 | 41 | 6 | 11 | 7 | 2 | 45 | 36 | 11 |
| 10 | 0 | 0 | 33 | 56 | 1 | 45 | 1 | 72 |
| 11 | 41 | 3 | 11 | 56 | 1 | 5 | 32 | 15 |
| 12 | 0 | 100 | 100 | 7 | 1 | 2 | 10 | 2 |
| 13 | 5 | 3 | 11 | 3 | 100 | 1 | 1 | 0 |
| 14 | 0 | 0 | 33 | 100 | 1 | 1 | 2 | 0 |
| 15 | 2 | 6 | 11 | 3 | 1 | 0 | 0 | 0 |
| 16 | 0 | 0 | 33 | 7 | 1 | 0 | 1 | 0 |
| 17 | 1 | 41 | 11 | 56 | 2 | 0 | 0 | 0 |
| 18 | 0 | 0 | 100 | 56 | 6 | 0 | 6 | 7 |
| 19 | 1 | 41 | 11 | 7 | 48 | 100 | 28 | 27 |
| 20 | 100 | 0 | 33 | 3 | 48 | 0 | 25 | 23 |
Отговори
Part A. Sample X. Spectral measurements, A.1
Part A. Sample X. Spectral measurements, A.4 nX = 1.53, DX = 227 nm
Part B. Sample X. Laser measurements, B.1 red laser
The official solution writes the red laser wavelength as λ = 650 nm, while the problem lists the red laser as 659 nm.
Part B. Sample X. Laser measurements, B.4 θ1 = 37°, Δθ1 = 14°
Part B. Sample X. Laser measurements, B.5 707 nm
Part B. Sample X. Laser measurements, B.6 0.12
Part B. Sample X. Laser measurements, B.7 51 °
Part B. Sample X. Laser measurements, B.8 p = 0.31, nAAO = 1.72
Part B. Sample X. Laser measurements, B.9 p1 = 0.22, p2 = 0.41
Part C. Sample Y. Several transmittance minimums, C.1 682 nm, 574 nm, 485 nm
Part C. Sample Y. Several transmittance minimums, C.5 678 nm, 569 nm, 478 nm, 423 nm
Part C. Sample Y. Several transmittance minimums, C.6 m = 5, 6, 7, 8
Part C. Sample Y. Several transmittance minimums, C.7 1080 nm
Part C. Sample Y. Several transmittance minimums, C.8 0.42, 0.29, 0.22, 0.63
Part D. Sample Z. Missed transmittance minimums, D.1 808, 696, 611, 499, 462, 402 nm
Part D. Sample Z. Missed transmittance minimums, D.2 m = 7, 8, 9, 11, 12, 14
Part D. Sample Z. Missed transmittance minimums, D.3 1802 nm
Part D. Sample Z. Missed transmittance minimums, D.4 m = 10 (559 nm) and m = 13 (430 nm)
Part E. Samples Y and Z. Internal structure of the period., E.1 n-6
Part E. Samples Y and Z. Internal structure of the period., E.2 hi5-5
Решение
Part A
A1. According to diffraction grating formula
, where , thus
A2.
| , º | , º |
|---|---|
| 35 | 61,5 |
| 36 | 55,5 |
| 37 | 49,5 |
| 38 | 45 |
| 39 | 39 |
| 40 | 35 |
| 41 | 31,5 |
| 42 | 25 |
| 43 | 18,5 |
A3. Using Bragg-Snell law (2) from the task:
and (1s) we get
where intercept is taken from Fig.1
where slope is taken from Fig.1
A4. Taking slope and interception point from the Fig. 1 from (4s), (5s) we get:
Part B
B1. Minimum can be observed only in the red zone, so we use red laser with wavelength
B2-B3.
B4. From the Fig. 2 we find minimum at with width of
B5. Using (2s) we get
For the normal wavelength we can write
B6. Using (6s) we determine
B7. Minimum for the wet sample is at .
B8. Using (2s) for and one can obtain
Using (4) and (5) from the task we determine
B9.Taking and we get
Equation (4) yields
Part C
C1. For the normal incidence () we can observe three minima at angles , , therefore .
C2.
C3.
C4.
C5. Using (6s), we calculate normal wavelengths for an arbitrary order
| m’ | |||
|---|---|---|---|
| 659 | 21 | 678 | 1 |
| 530 | 34 | 569 | 2 |
| 400 | 57 | 478 | 3 |
| 400 | 30 | 423 | 4 |
C6. According to (2s) dependence should be linear:
where intercept is taken from Fig.7
| m | |
|---|---|
| 677 | 5 |
| 568 | 6 |
| 479 | 7 |
| 423 | 8 |
C7.
where slope is taken from Fig. 7
C8. Let be the half-sum of intensities to the left and to the right from the minimum, and be intensity in the minimum. Transmittance .
| t | |
|---|---|
| 677 | 0.42 |
| 568 | 0.29 |
| 479 | 0.22 |
| 423 | 0.63 |
Part D
D1. One can find up to 6 maximums:
| 808 |
| 696 |
| 611 |
| 499 |
| 462 |
| 402 |
D2. According to (2s) dependence should be linear:
Dependence will be linear if we take =1,2,3,5,6,8 for visible minimums (see fig.8).
From fig. 8 .
| 808 | 1 | 7 |
| 696 | 2 | 8 |
| 611 | 3 | 9 |
| 499 | 5 | 11 |
| 462 | 6 | 12 |
| 402 | 8 | 14 |
D3.
where slope is taken from Fig. 8
D4.
Missed minimums correspond to order m=10 and 13:
| 10 | 559 |
| 13 | 430 |
Part E
E1. We recognize the sample Y by such feature, that 2 central transmittance minimums are deeper than 2 side transmittance minimums. So, it is n-6.
E2. For the sample Z and are missing, are not. So, it is hi5-5.
Оригинал в Архива: exp.pdf · официални решения: exp_sol.pdf