APhO 2021, Експеримент — Задача 1. Elasticity of cantilever
Elasticity of cantilever (10 points) · 10 т.
Условие
Please read the general instructions in the separate envelope before you start this problem.
I. Introduction
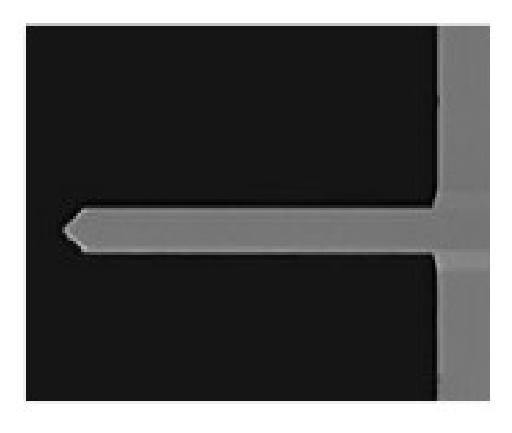
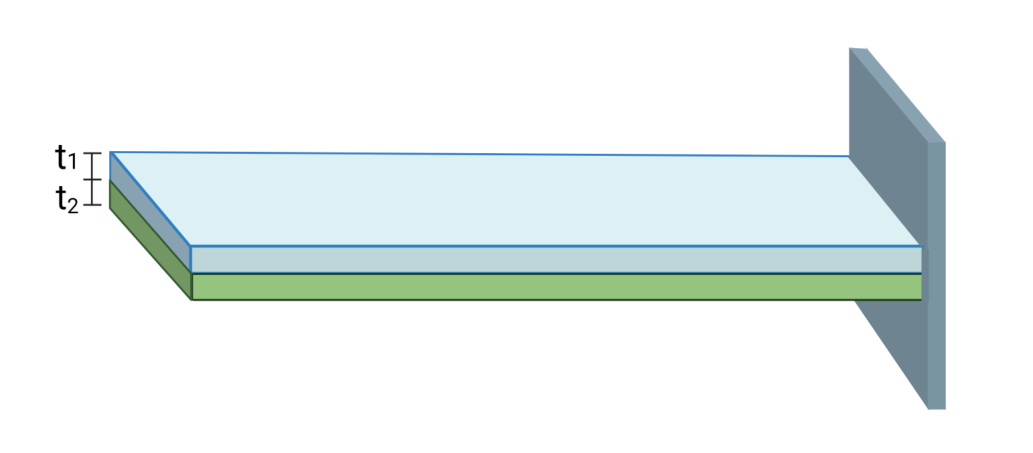
Cantilever beam is one of the common mechanical structures (see Figure 1). It is not only exploited as the main structure to resist shear bending in structure design, but also often seen in the field of nano-engineering. To analyze the elasticity response of nanocantilever beam as well as to elucidate the relationship between stress and strain is important in applied physics. However, it is rather difficult to perform direct measurement of nanomaterials to their mechanical properties. It can be only obtained from the indentation test unlike the uniaxial tensile text in macroscale. For nanocantilever beam subjected to a force by employing an atomic force microscope or nanoindentation, the observation of the flexural deformation of the nanocantilever beam to infer its Young's modulus becomes one of the most important tools for measuring the mechanical properties of materials in microscale.
II. Introduction of the equipment
1A
Common
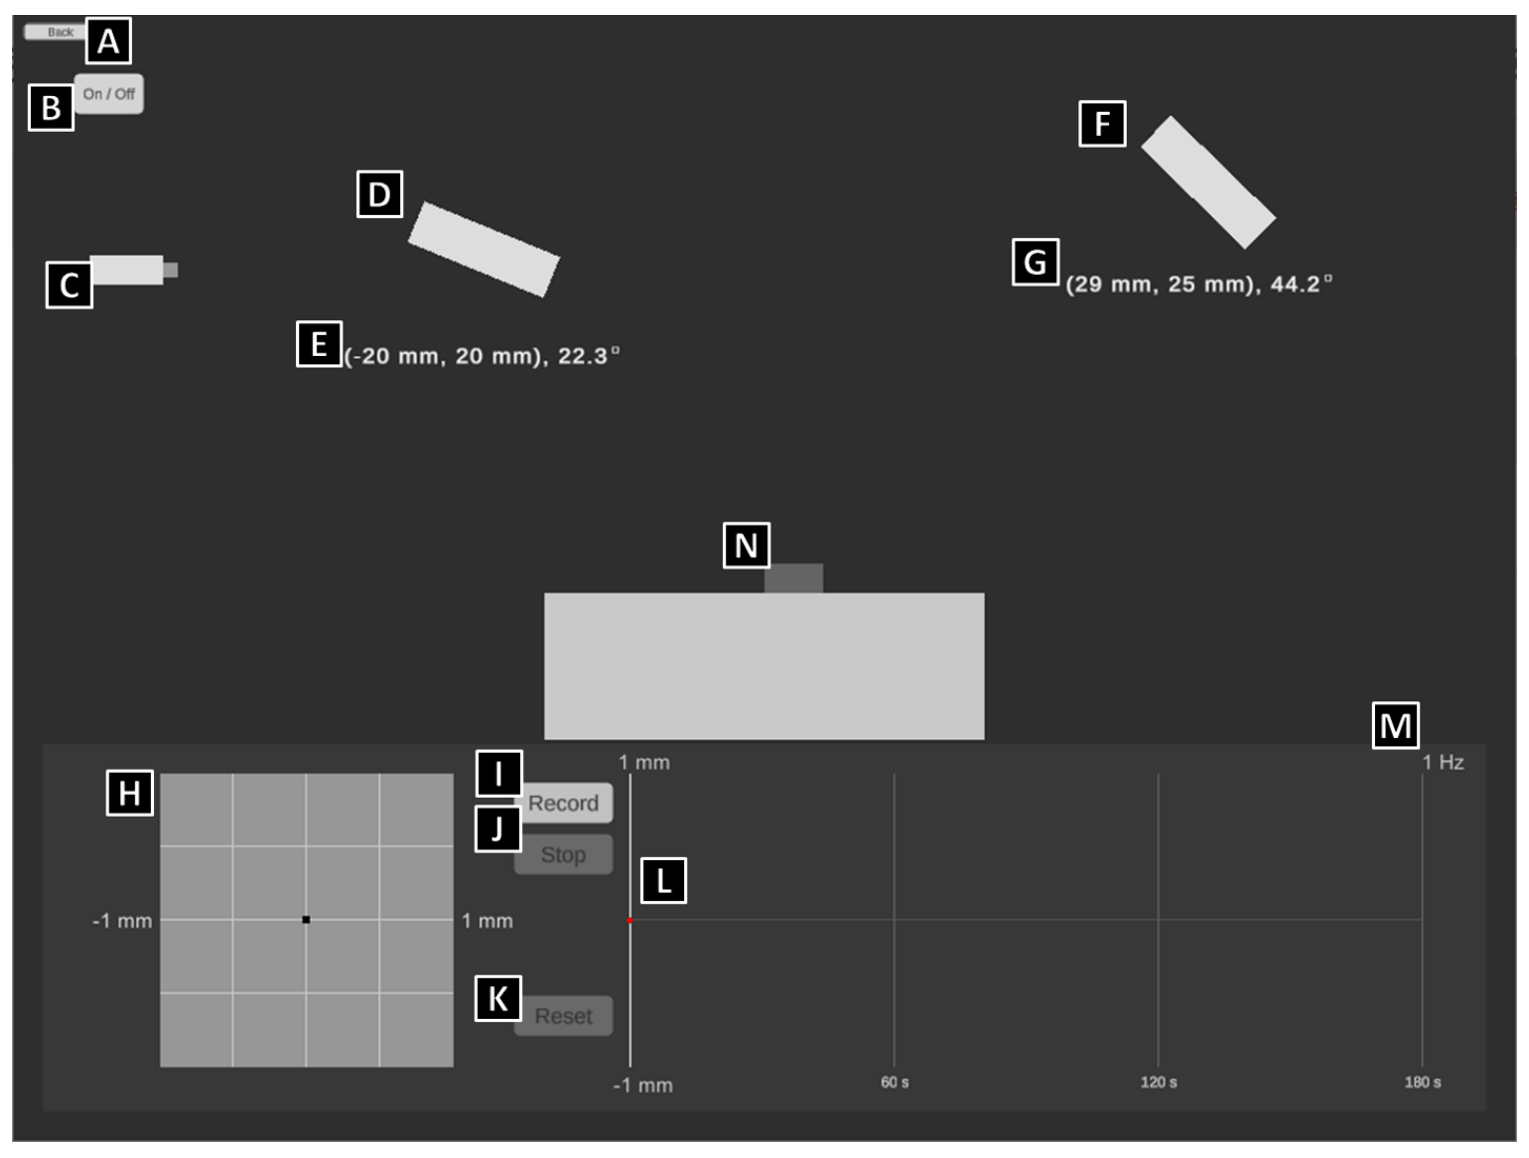
- A. Back to previous page
- B. Laser switch
- C. Laser emitter
- D. Reflector: you can control this device precisely by clicking the arrows next to it, or directly dragging it to move with the left mouse button.
- E. Position of the reflector: the coordinates are accurate to m, and the angle is accurate to 0.1°
- F. Position Sensitive Detection, PSD
- G. Position of the reflector: the coordinates are accurate to m, and the angle is accurate to 0.1°
- H. PSD recording system: you can control this device precisely by clicking the arrows next to it, or directly dragging it to move horizontally with the left mouse button. The boundaries of this system are within m both vertically and horizontally.
- I. PSD recorder: start-recording button
- J. PSD recorder: stop-recording button
- K. PSD recorder: reset-recording button
- L. PSD record history: the readings are accurate to m, which can be recorded with the longest duration of 180 sec. You can query the data with the left mouse button on the chart, or by clicking arrow keys on the keyboard.
- M. PSD record frequency: 1 Hz
- N. Nano-beam carrier: the coordinates at the left-top corner of the carrier are (0, 0), and the nano-beam would be installed on the left edge of the top.
1B
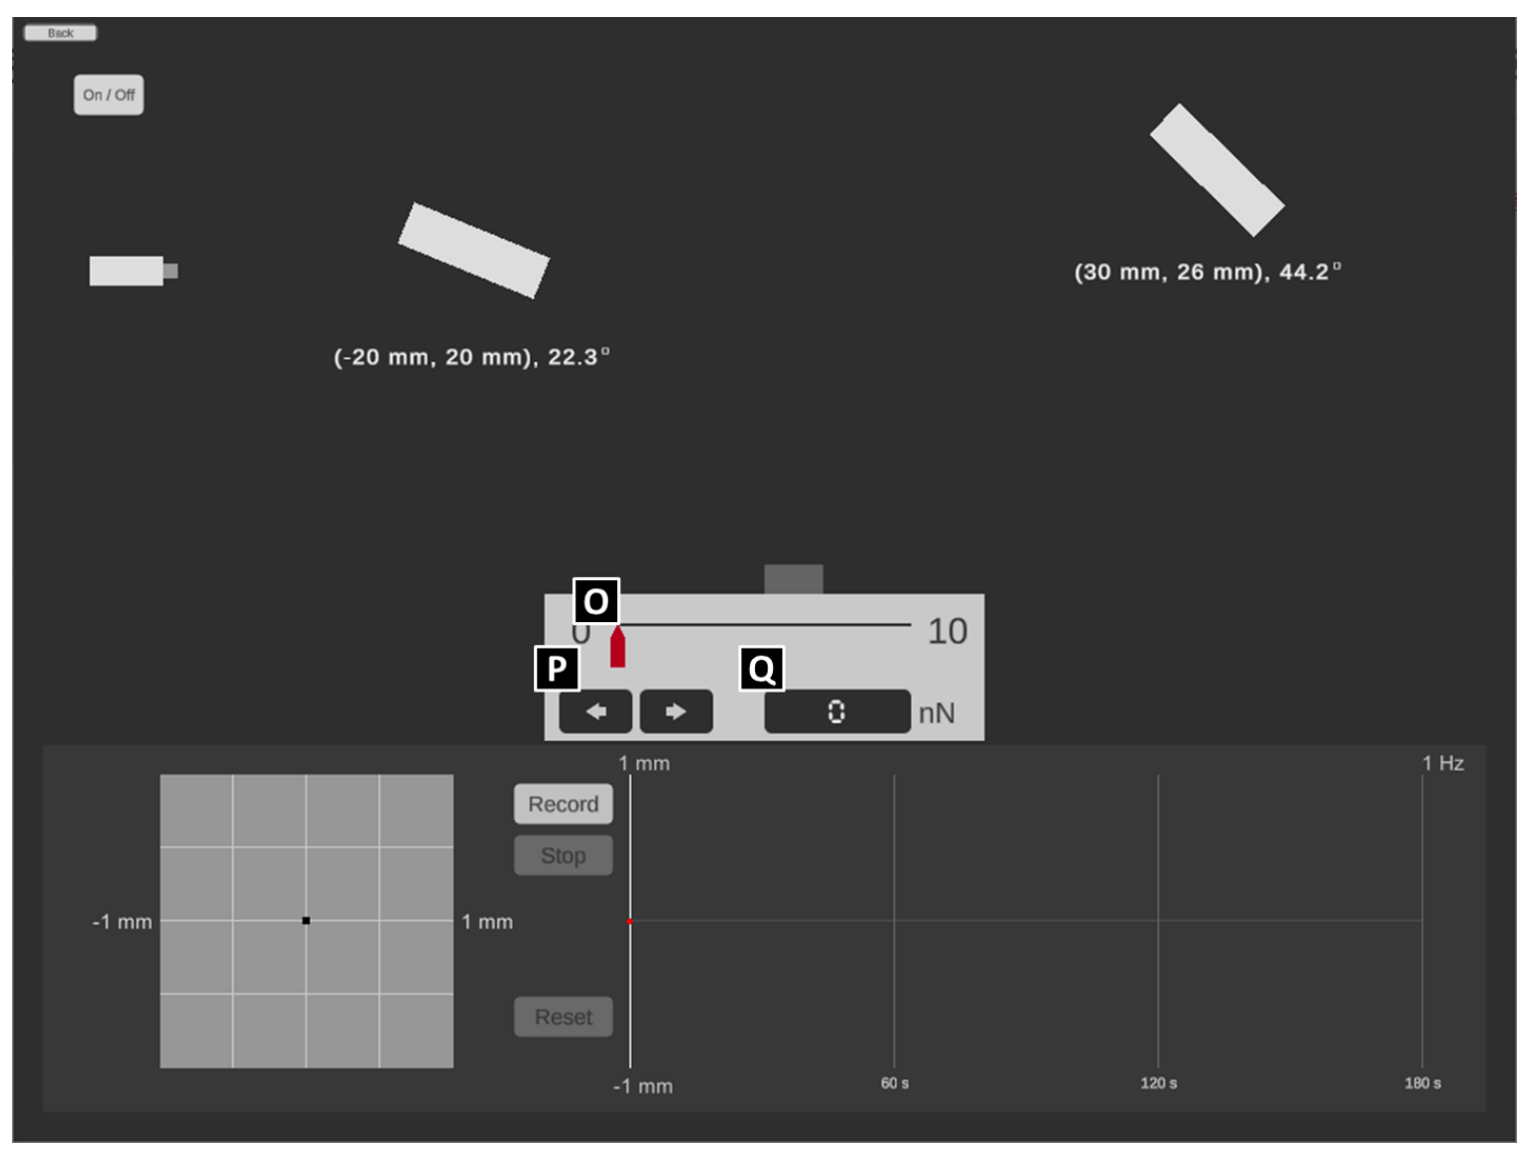
- O. the controller of the point load: you can control the force by dragging the red cursor to move horizontally.
- P. the micro-controller of the point load: you can control the force precisely by clicking the arrow buttons with the left mouse button.
- Q. the monitor of the point load: the precision is up to N
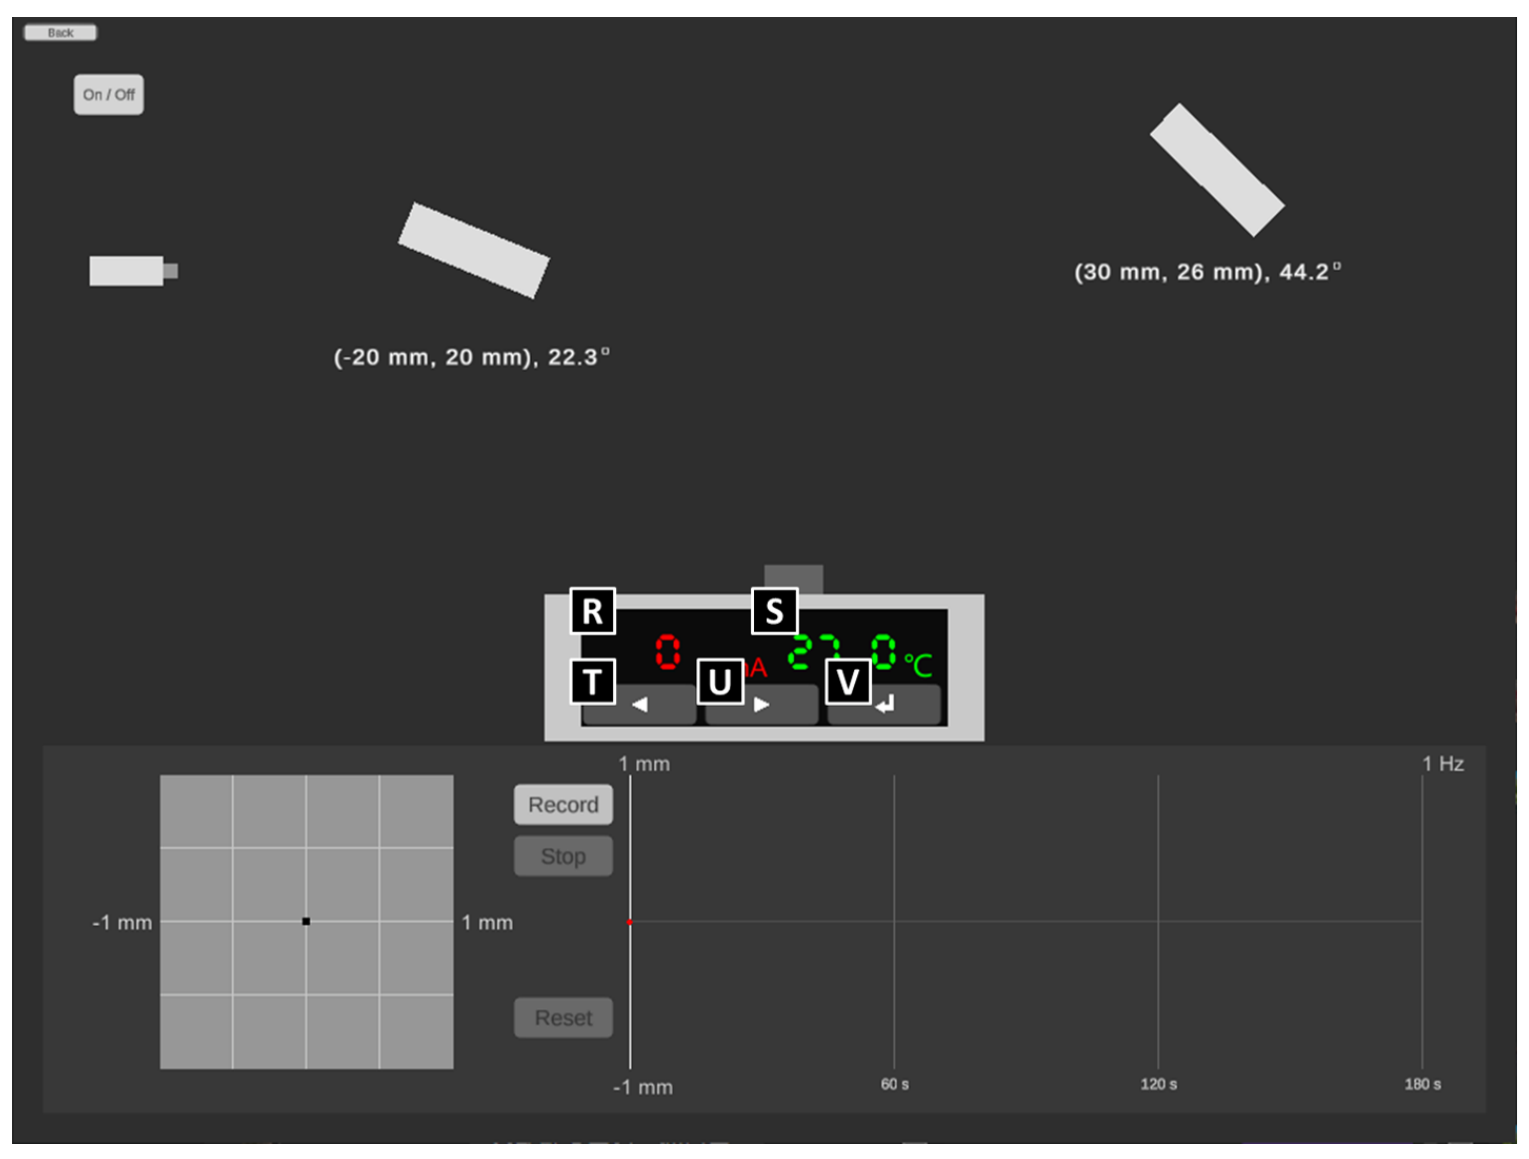
1C
- R. the monitor of the electric current of the heater with the precision up to A.
- S. the monitor of the temperature of the heater with the precision up to C
- T. the button to decrease current of heater: each click for A
- U. the button to increase current of heater: each click for A
- V. the button to set up the change of the electric current: please NOTE that the time to heat or cool down the sample is referring to the authentic experience of the real world and CANNOT be reset arbitrarily, which means the time to let the sample cool down will increase if the sample is over-heated by the excessive electric current.
1D
- W. sample switch: switch the test sample by directly clicking it with the left mouse button.
III. Experiment
Note:Please ensure the data and the answers must be expressed by scientific notation and SI unit. The unit of length should be meter.
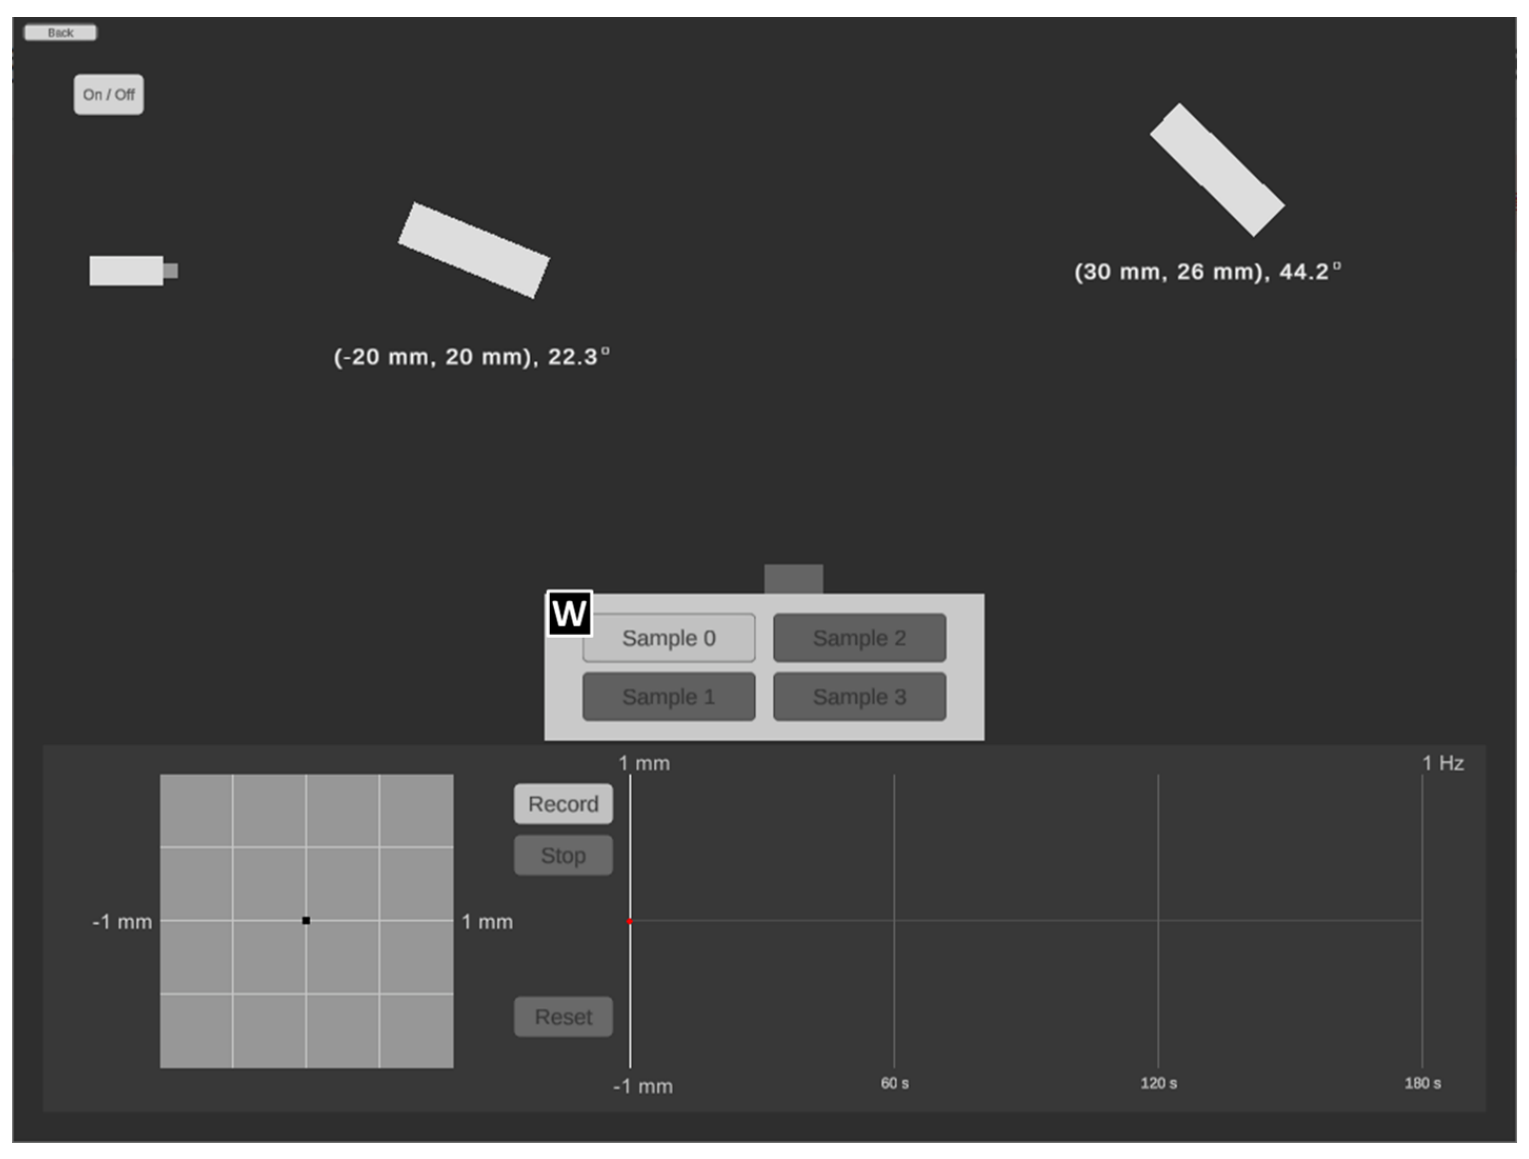
Part A. Alignment of light path (2,4 т.)
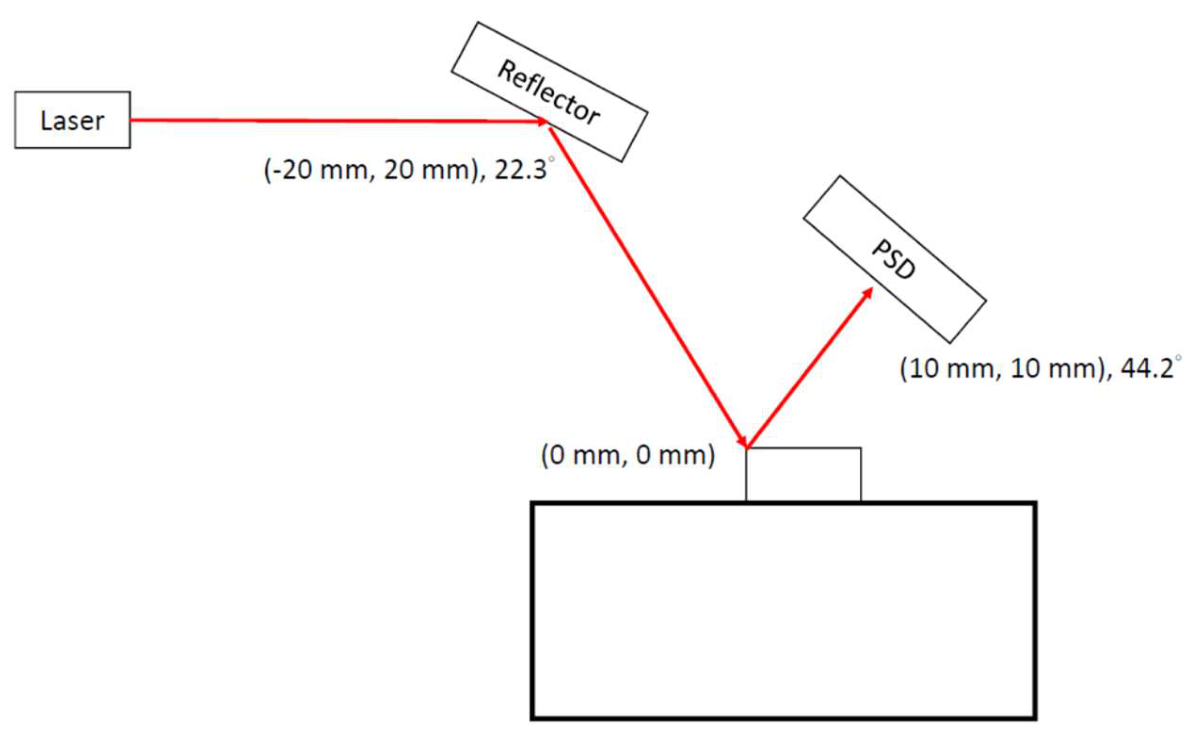
It is not an easy task to measure the deflection of nanocantilever beam at microscopic scale by using optical microscope directly. Therefore, by exploiting the straightness and reflection of laser we are able to measure the reflection by a position sensitive detection sensor (PSD). The length of the nanocantilever used in the present experiment is about m. Please use program 1A and answer question A.1 to A.3.
A.1 Please design a light path so that the laser spot hits the middle of the reflective area of the cantilever beam. Make sure the laser spot can stably appear near the origin of the PSD display screen and draw the relative position (coordinates and angles) of each component on the answer sheet. [0,6 т.]
A.2 Since the cantilever beam will be disturbed when the device turned on, it may take some time to reach a stable state. After the instrument is turned on, the figure of the position of the light spot on the PSD and time will be displayed at the bottom right of the program. Please record the position of the light spot on the PSD every 3 seconds under external disturbance after pressing the "Record" button. Please record at least 40 data points, and then press the "Stop" button to stop capturing data. [0,8 т.]
A.3 Please use the stable segment of the data obtained by A.2 to find the reference value of measurement of this cantilever beam under the fluctuation of the experimental environment. ( is the average value of ). [1 т.]
Part B. Deformation of cantilever beam and deduction of Young’s modulus (2,4 т.)
Note : For the convenience of the measurement, we assume the cantilever has reached its stable state under the influence of the environmental perturbation, i.e. the vibration of the optical components will not affect the measured value.
Note:Please ensure the data and the answers must be expressed by scientific notation and SI unit. The unit of length should be meter.
Note:In part B, calculation of the standard deviation in the data analysis is not required.
The Young’s modulus of the material of cantilever beam can be obtained by using an atomic force microscope or a nanoindentation tester to apply an external force to the free end of the cantilever beam. Through the measurement of deformation, the magnitude of Young’s modulus can be obtained. When a force is applied to a nano cantilever beam, if the amount of deformation does not exceed the elastic limit of the material, then the correlation between the force and the deformation of the free end can be formulated as follows:
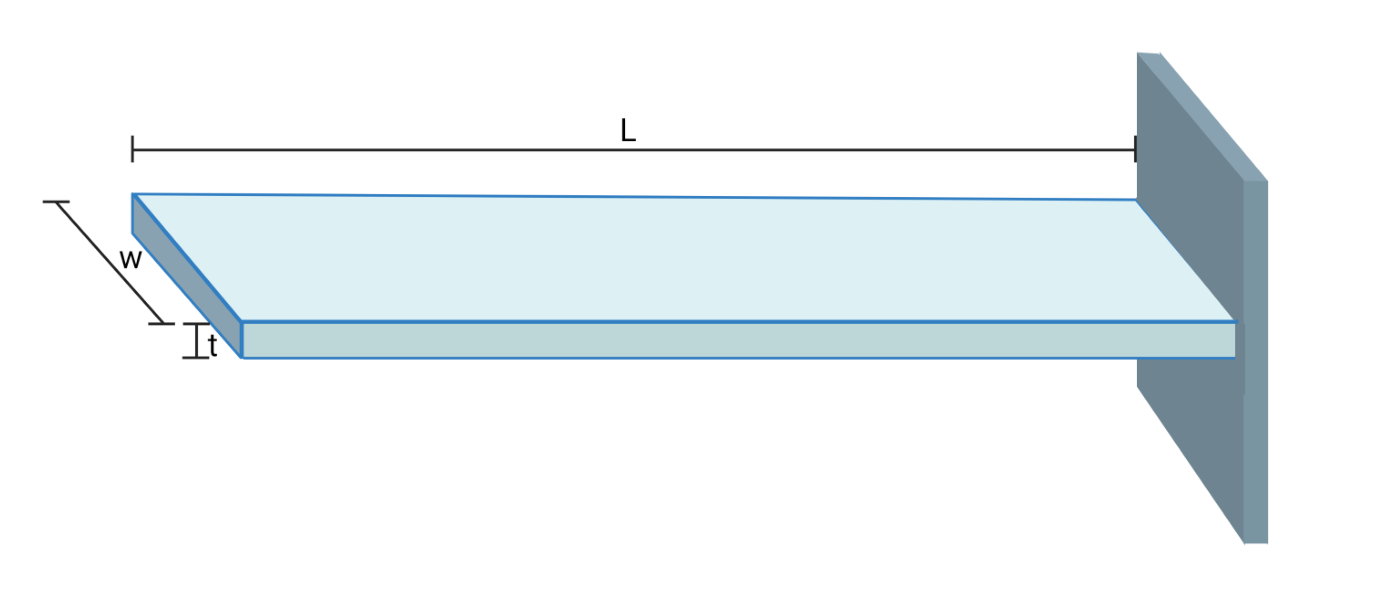
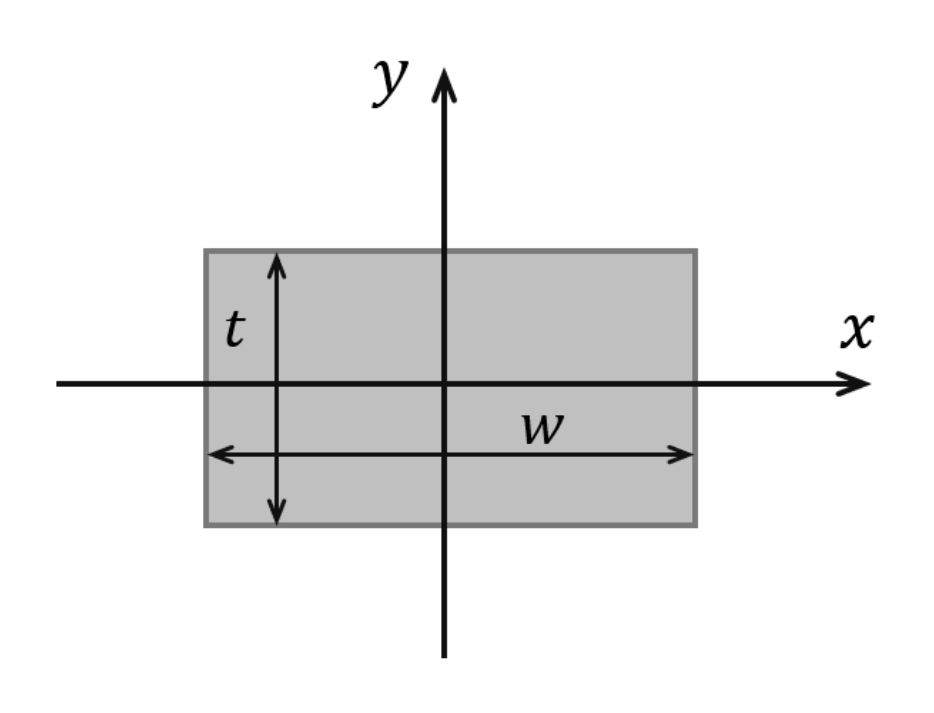
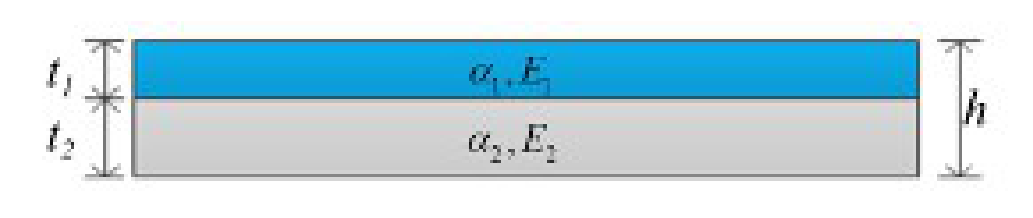
where is the force applied at the end point, is the Young’s modulus; is the area moment of inertia of the cantilever beam section, is the length of the cantilever beam, and is the magnitude of flexural deformation. The area moment of inertia is a physical quantity that reflects the influence of the cross-section size on the bending deformation of the cross-section of an object subject to bending deformation. The value of the area moment of inertia can be calculated by simple integration. As shown in Figure 2, there is a cantilever beam whose cross-section height is , the width is , and its area moment of inertia can be calculated by integral as follows:
The cantilever used in this experiment has an of m, of m, and of m. Silicon is used as the substrate material, and its standard Young’s modulus is Pa.
Please use program 1B and answer questions B.1 to B.3.
B.1 Please design the optical path when the external force is 0 N. Let the laser spot hit in the middle of the reflective area of the cantilever, and be sure about that the laser spot can stably appear near the center of the PSD display screen. Record the data on the table to obtain the measurement reference value . The position of the light spot on the PSD at this time is set as the displacement . Then apply five different magnitudes of external forces on the cantilever, and record the experimental results in the table on the answer sheet. [1 т.]
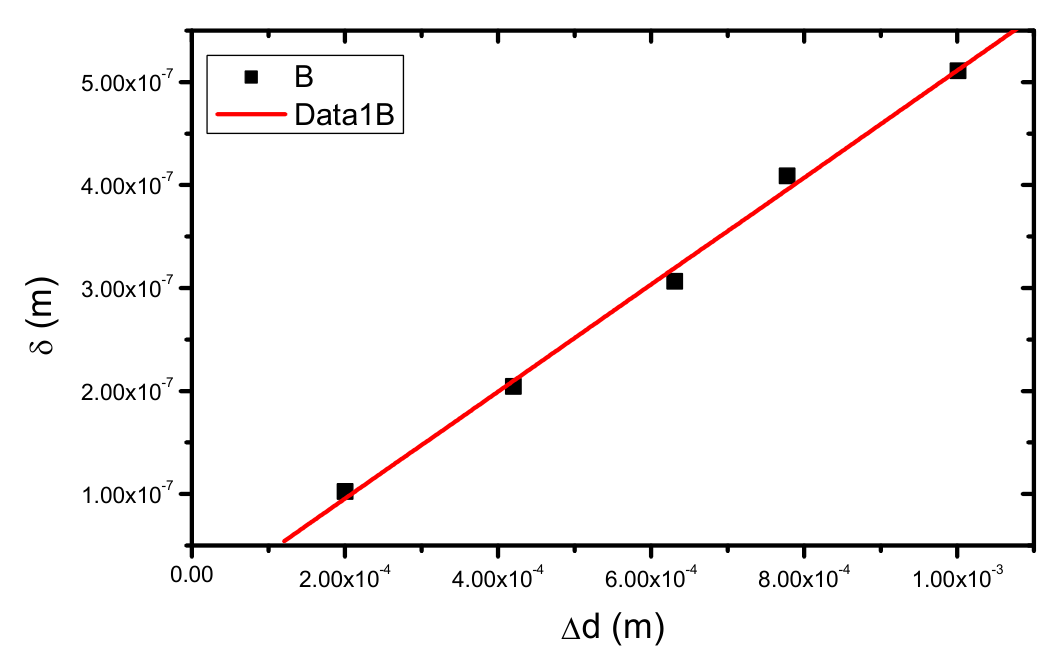
B.2 Fill in the table. Make a plot by taking the magnitude of flexural deformation as the -axis and (the average of light spot displacement on the PSD) as the -axis. [1 т.]
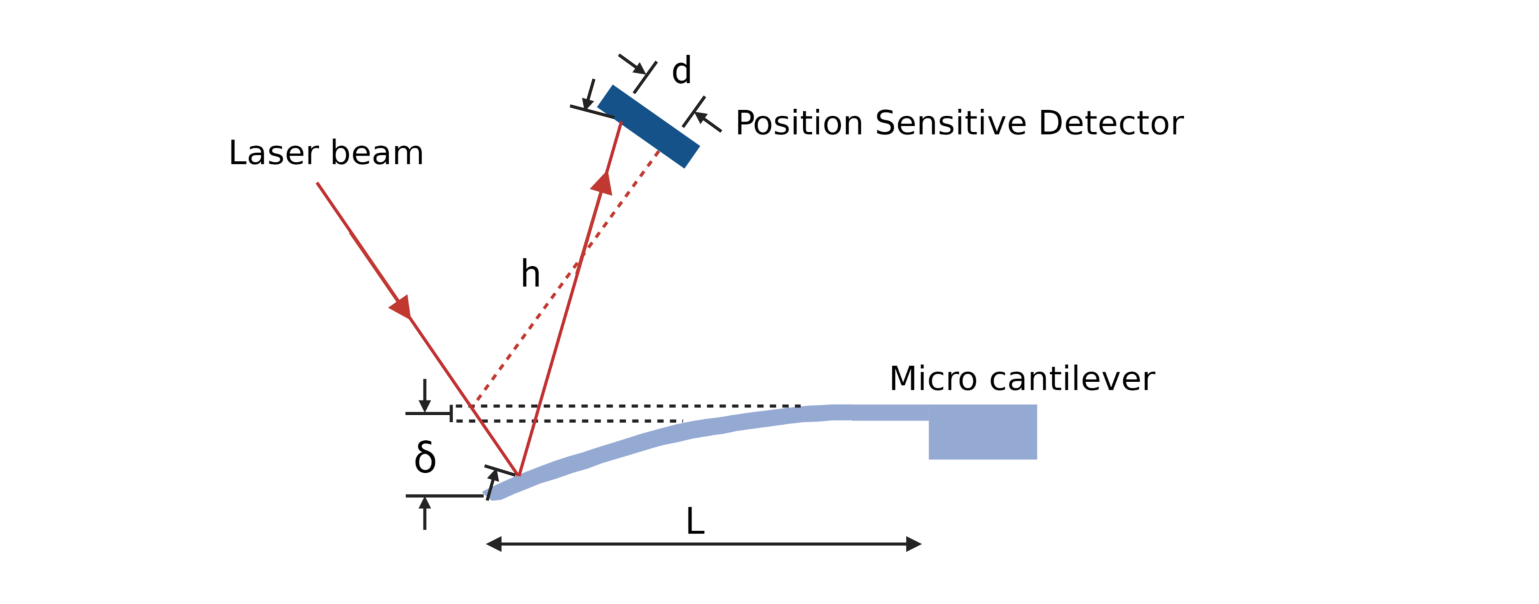
B.3 Please deduce the value value from the optical leverage relationship , as illustrated in Figure 3. [0,4 т.]
Part C. Double layer cantilever beam (2,6 т.)
Note : For the convenience of the measurement, we assume the cantilever has reached its stable state under the influence of the environmental perturbation., i.e. the vibration of the optical components will not affect the measured value.
Note:Please ensure the data and the answers must be expressed by scientific notation and SI unit. The unit of length should be meter.
Note : In part C, calculation of the standard deviation in the data analysis is not required.
Double layer cantilever beam is a structure often used in nano engineering application (e.g. IC Printed Circuit Board or nano brake). It consists of two layers of different materials which expand at different rate as they are heated. In Timoshenko beam theory, bending stiffness differences were considered. Figure 4 shows a double layer cantilever beam consists of two layers, with thickness and , thermal expansion coefficients and , Young’s modulus and .
According to beam theory, the strain for those two layers could be written as
where is the net force, is the temperature difference, is the width, is the radius of curvature. The net force needs to be balanced as shown in Figure 4. The relation between resultant moment and net force is written as follows:
The resultant moment can be written as a function of the bending stiffness and the radius of curvature , as follows:
is Young’s modulus and is moment of inertia. The boundary condition requires the strain to be continuous, that is . By this boundary condition, the following equation can be obtained:
The double layer beam structure is shown in Figure 5. Parameters for this experiment are listed as follows: is m, is m, is m, is m, thermal expansion coefficients are /K and /K; the area moment of inertia are m and m. The lower layer is silicon base, the Young’s modulus for silicon is Pa. Please use program 1C and answer question C.1 to C.3.
C.1 Please design a simple experiment diagram with light path. Let the laser beam show near the center of the reflected area. Record the data for room temperature, and find the measurement reference , and used this reference as . Then, increase the temperature to higher value, wait until the double layer beam stable then record the data. Try to do at least 5 different temperatures and record the data in the table of answer sheet. [1 т.]
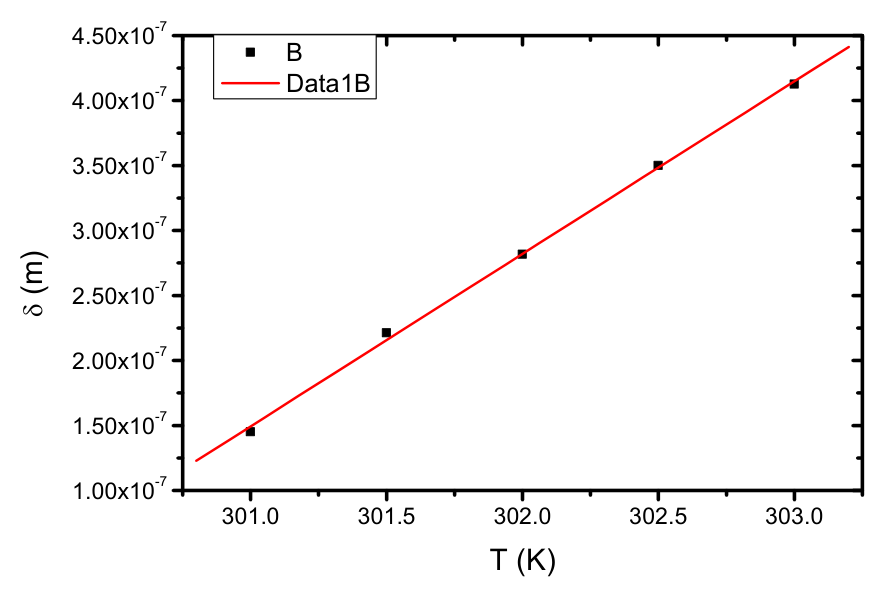
C.2 Fill in the table. Make a plot by taking the magnitude of flexural deformation as the -axis and the temperature as the -axis. By data analysis, find the slope. You can use the correlation between and in B.3. [1 т.]
C.3 Use data from C.2 to calculate the Young’s modulus for the upper layer material. [0,6 т.]
Part D. Test of molecular-absorption-induced bending of a cantilever beam (2,6 т.)
Note : For the convenience of the measurement, we assume the cantilever has reached its stable state under the influence of the environmental perturbation, i.e. the vibration of the optical components will not affect the measured value.
Note : Please ensure the data and the answers must be expressed by scientific notation and SI unit. The unit of length should be meter.
Note : In part D, calculation of the standard deviation in the data analysis is not required.
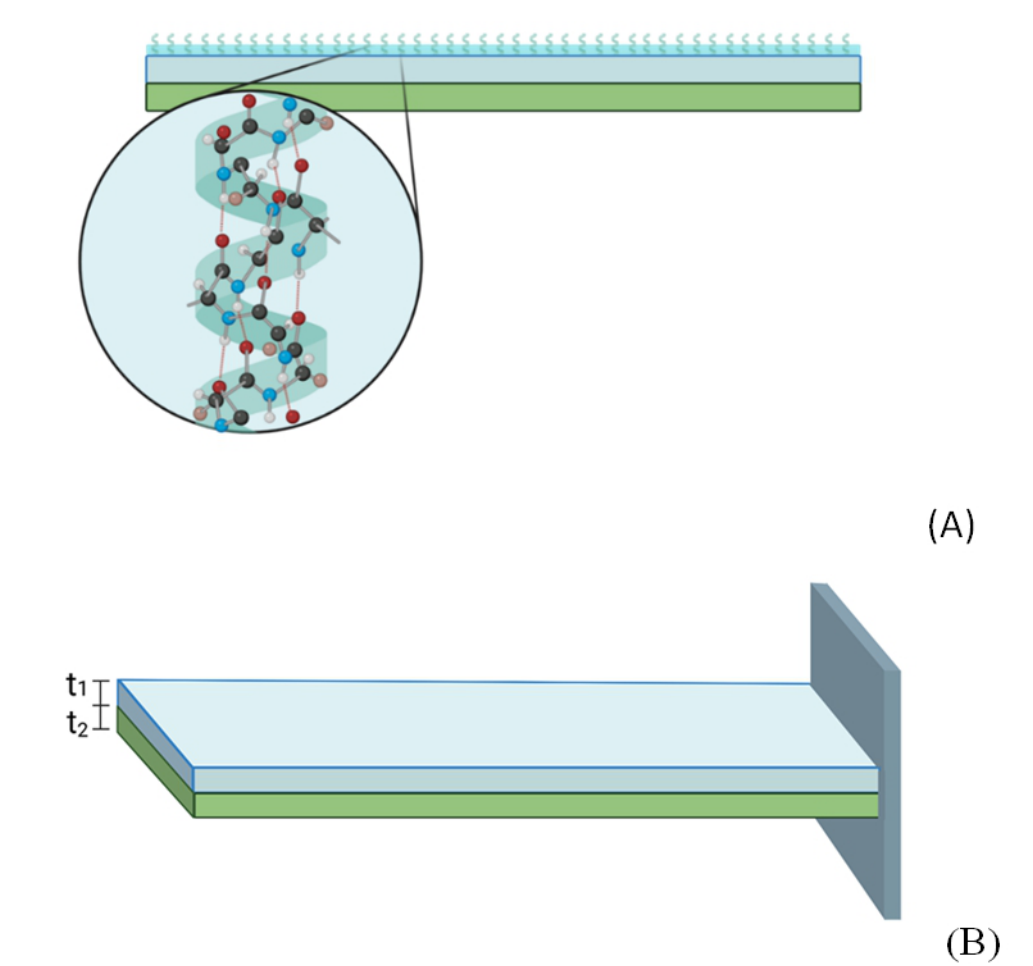
A composited cantilever beam can not only be used as a nano-actuators but also a nano-sensor. As an example, Figure 6 shows a nano-protein sensor consisted of a two-layer cantilever beam on which surface is integrated with microfluidic channels and coated with a protein layer. While a different bio-protein is absorbed onto the cantilever, due to the van-der Waal interactions between the molecules the protein attachment can induce a surface stress which distribution is specific to the uniqueness of protein, and consequently a detectable beam bending.
A schematic diagram of the two-layer cantilever beam used in this experiment is illustrated in Figure 6(B). The length is about m , m , m , and m . The lower layer is made by Si as substrate. The Young's modulus of Si is Pa. The coverage ratio () is for Sample 0, % for Sample 1. You can ignore the effects of the thickness and Young's modulus of the coated molecules on the cantilever beam because of their tiny amount and small . Assume the effective bending stiffness N·m. Please use program 1D and answer question D.1 to D.4.
D.1 Design an optical path for Sample 0, so that the reflected laser spot locates at the center of the reflection zone, i.e. the laser spot appears stable in the origin of the PSD screen. Record the base value measured in the tables of the data sheet. The displacement of the laser spot is set zero, at this position. Then repeat the experiment with Sample 1. Record your answers on the tables of the data sheet. Note that Sample 1 has the highest coverage ratio () in all samples. [0,6 т.]
D.2 Assume the function form of the magnitude of flexural deformation and coverage ratio () can be expressed as : . Estimate based on your data obtained in D.1. You can use the correlation between and in B.3. [0,6 т.]
D.3 Use Sample 2 and Sample 3, same molecule but different . Measure the spot displacement shown on PSD for both samples. Record your answers on the data sheet. [0,8 т.]
D.4 Please estimate of Sample 2 and Sample 3 (expressed in %). [0,6 т.]
Отговори
Part A. Alignment of light path, A.3 0.00006267 m
Official sample result: m (reference value with standard deviation); the value depends on the simulated measurement.
Part B. Deformation of cantilever beam and deduction of Young’s modulus, B.3 0.0005196
Official sample result (dimensionless); it depends on the measured data.
Part C. Double layer cantilever beam, C.2 m/K
Official sample slope printed as without a unit (δ in m against T in K).
Part C. Double layer cantilever beam, C.3 Pa
Official sample result N/m² (Pa).
Part D. Test of molecular-absorption-induced bending of a cantilever beam, D.2 -0.0789
Official sample result ; it depends on the measured data.
Part D. Test of molecular-absorption-induced bending of a cantilever beam, D.4 Sample 2: 0.738%; Sample 3: 0.298%
Official sample results.
Решение
Part A. Alignment of light path
A1. 0.6 pt
A2. 0.8 pt
| time (s) | position (m) | time (s) | position (m) | time (s) | position (m) |
|---|---|---|---|---|---|
| 3 | 48 | 93 | |||
| 6 | 51 | 96 | |||
| 9 | 54 | 99 | |||
| 12 | 57 | 102 | |||
| 15 | 60 | 105 | |||
| 18 | 63 | 108 | |||
| 21 | 66 | 111 | |||
| 24 | 69 | 114 | |||
| 27 | 72 | 117 | |||
| 30 | 75 | 120 | |||
| 33 | 78 | ||||
| 36 | 81 | ||||
| 39 | 84 | ||||
| 42 | 87 | ||||
| 45 | 90 |
A3. 1.0 pt
| (m) | (m) | (m) | standard deviation |
|---|---|---|---|
reference value of measurement (with standard deviation):
m
Part B. Deformation of cantilever beam and deduction of Young’s modulus
B1. answer sheet. 1.0 pt
| (N) | (m) | (m) |
|---|---|---|
| 0 | ||
| (N) | (m) | (m) |
|---|---|---|
B2. 1.0 pt
| (N) | (m) | (m) |
|---|---|---|
B3. 0.4 pt
Part C. Double layer cantilever beam
C1. 1.0 pt
| (K) | (m) | (m) |
|---|---|---|
| 300 | ||
| (K) | (m) | (m) |
|---|---|---|
| 301 | ||
| 301.5 | ||
| 302 | ||
| 302.5 | ||
| 303 | ||
C2. 1.0 pt
| (K) | (m) | (m) |
|---|---|---|
| 301 | ||
| 301.5 | ||
| 302 | ||
| 302.5 | ||
| 303 |
Slope:
C3. 0.6 pt
Part D. Test of molecular-absorption-induced bending of a cantilever beam
D1. 0.6 pt
| (m) | (m) | |
|---|---|---|
| Sample 0 | ||
| (m) | (m) | |
|---|---|---|
| Sample 1 | ||
D2. Assume the function form of the displacement and coverage ratio (CR) can be expressed as: . Estimate based on your data obtained in A9. You can use the correlation between and in A6. 0.6 pt
D3. 0.8 pt
| (m) | (m) | |
|---|---|---|
| Sample 2 | ||
| Sample 3 | ||
D4. 0.6 pt
Sample 2: 0.738%
Sample 3: 0.298%
Оригинал в Архива: E1 Q English.pdf · официални решения: E1 Solution.pdf