APhO 2023 — Задача 1. Problem 2: Interference from thermally deformed surface (thermos-deformation)
Автор: Olympiads XYZ · транскрипция на официалните материали
Проверена срещу оригинала на 13.9.2026 от същия модел, който я е транскрибирал (без независима проверка)
Experiment XXIII APhO Mongolia 2023 — Problem 2: Interference from thermally deformed surface (thermos-deformation) · 10 т.
Условие
When light interacts with matter, it gives rise to various phenomena. This experimental study focuses on investigating the diffraction of light from a light-deformed acrylic (PMMA) surface.
Acrylic is 5 times stronger than regular glass and is an organic material that can be used in a variety of applications. The liquid monomer of methyl methacrylate serves as the primary material for acrylic. The liquid state has lower density compared to the solid state. Various colorants and hardeners are added to the liquid monomer. The thermoforming temperature ranges from 160 to 190°C. Acrylic is an environmentally friendly material as it does not release any harmful chemicals. Therefore, it is commonly used in items such as children's toys, utensils, and equipment frames. Moreover, it is resistant to water.
Test equipment:
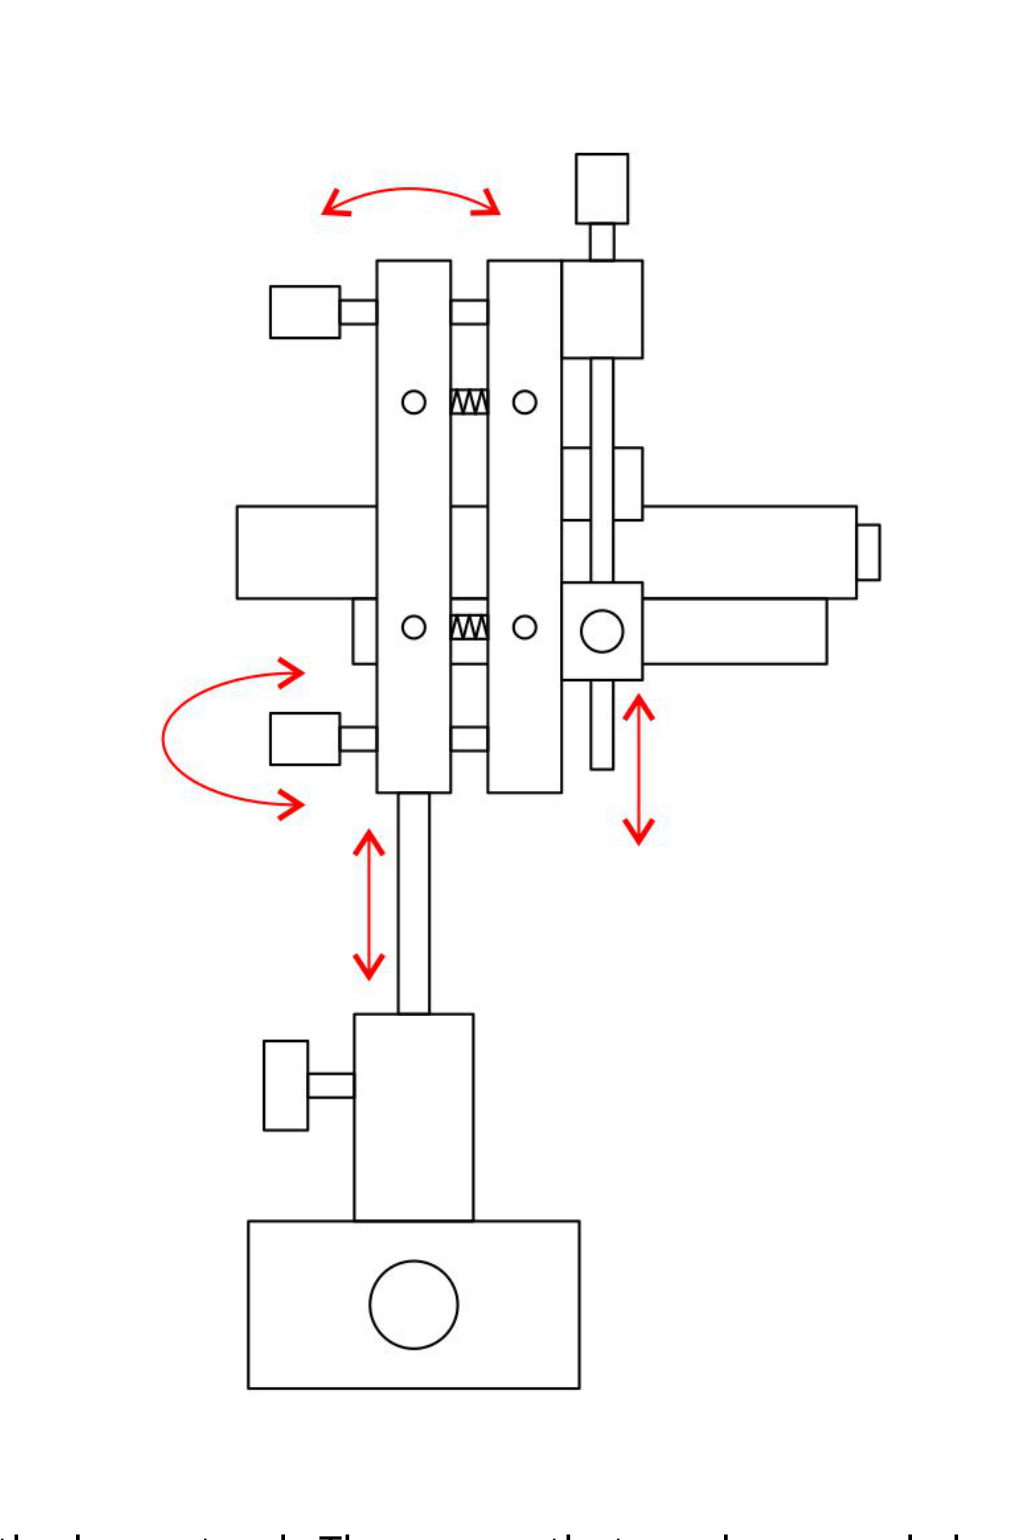
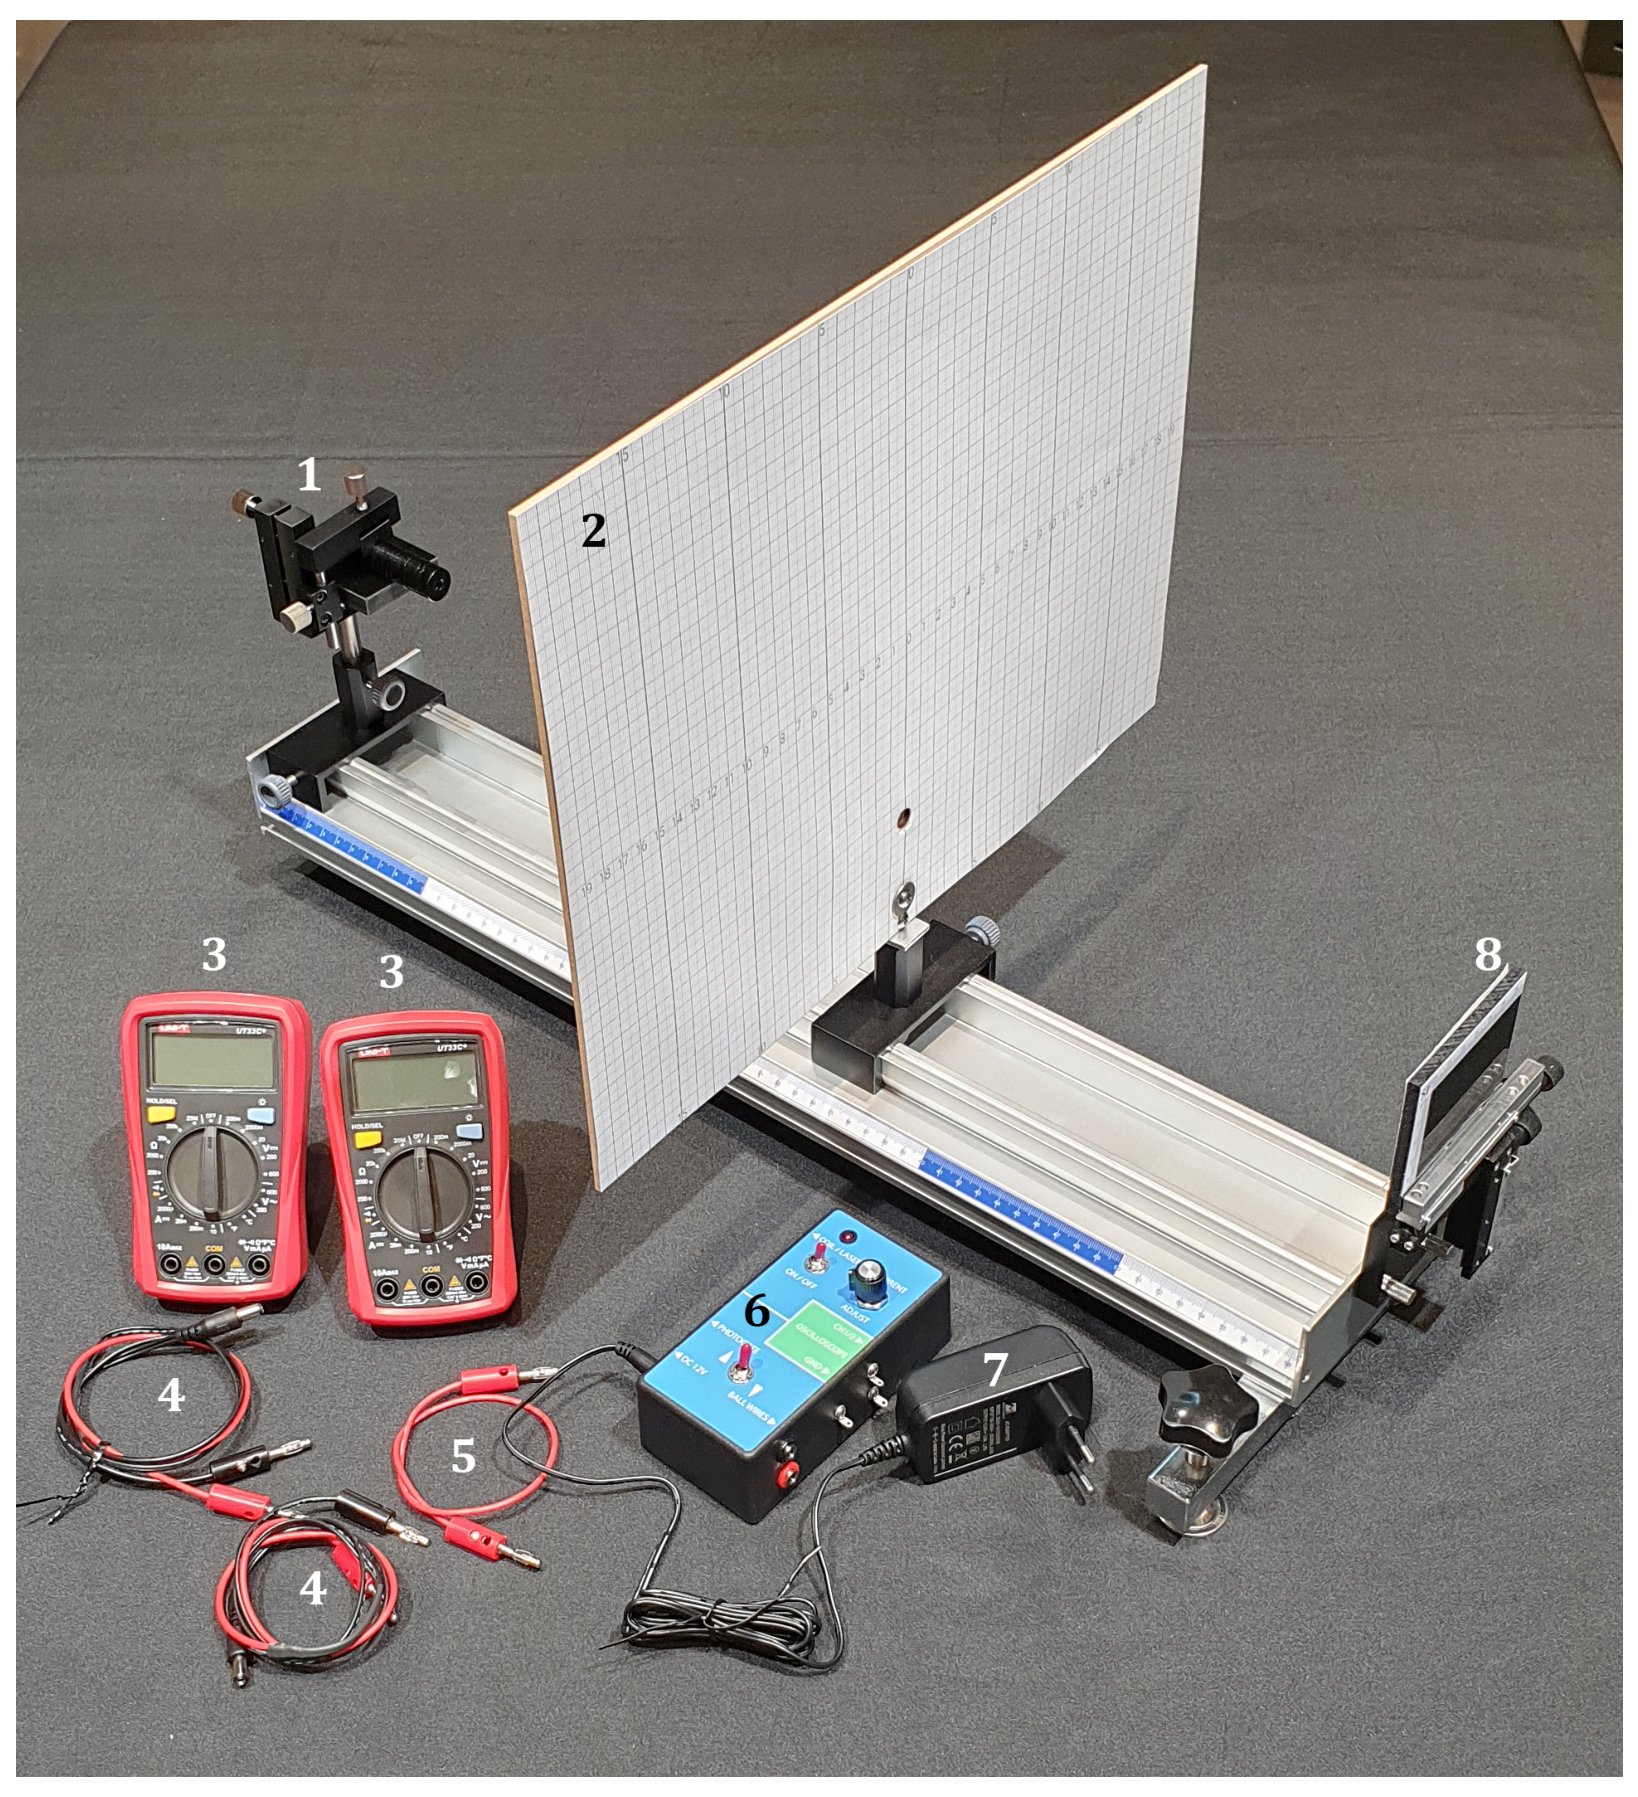
- Laser with voltage adjustment tool
- Screen with holes
- Two multimeters (one amperemeter and one voltmeter)
- Connecting wires for laser source and power control unit
- Connecting wires for multimeters
- Control box
- Power supply adaptor
- Acrylic (PMMA) target with adjustable stand
The experiment consists of two parts. The first part involves studying parameters such as angular diameter and number of fringes, and angular width between the interference fringes as a function of the power supplied to the laser.
The second part focuses on studying the parameters of the aperture (including diameter, height, and shape) that generates the interference pattern, as functions of the power supplied to the laser. Additionally, the parameters of the reference aperture will be determined.
Experimental tools
- Securely twist the string that was previously used to suspend the test ball onto the top fastener, detach the mechanical part, and place it on a soft mat.
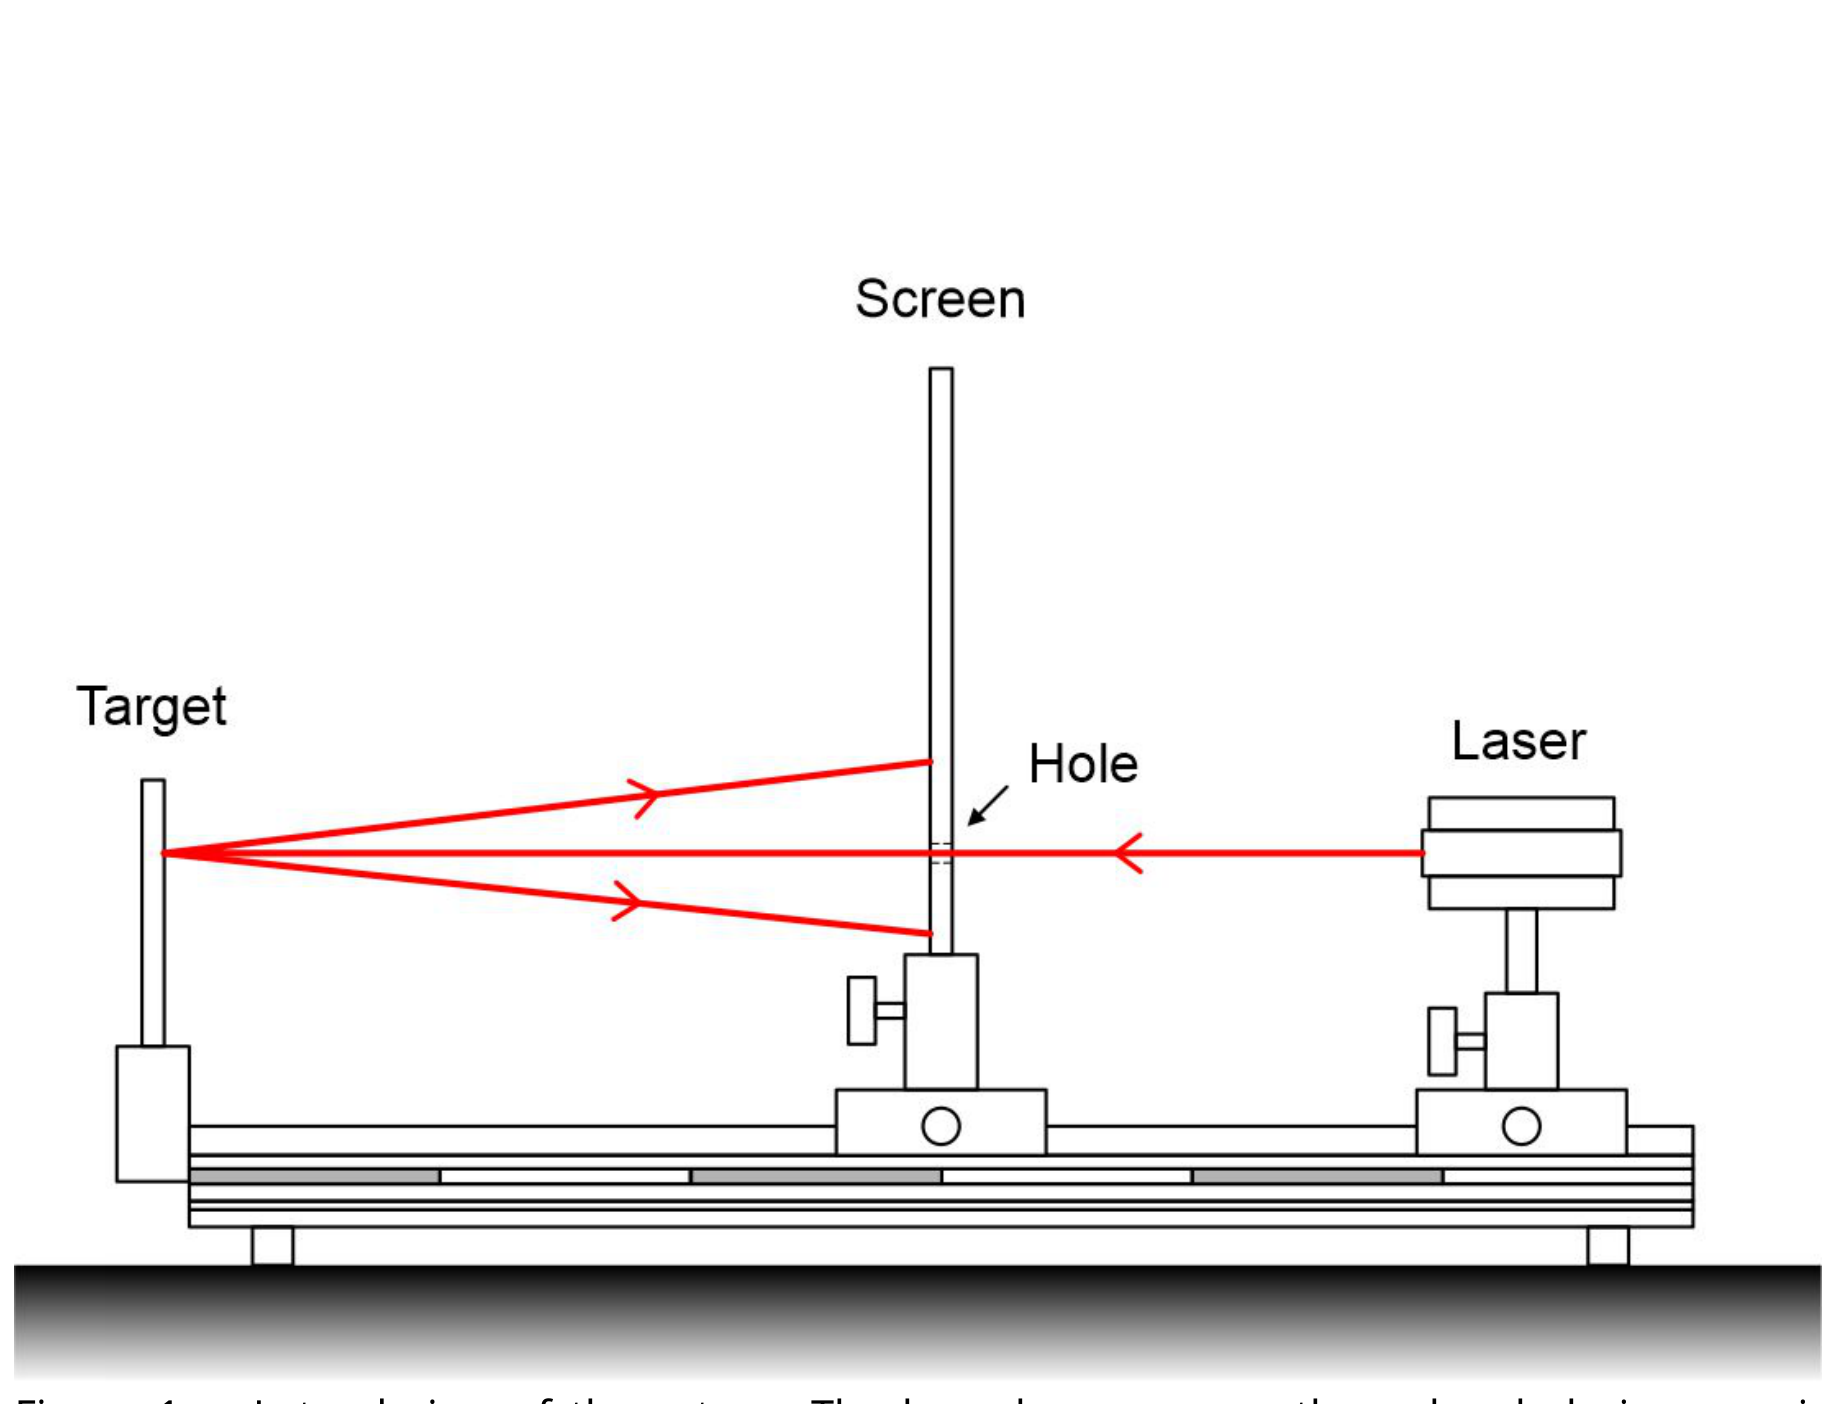
- Place the laser, screen and acrylic base on the optical bench as shown in the picture. Position the laser beam along the axis of the optical bench at the same level, allowing the beam to pass freely through the hole of the screen. Make sure that the beam is nearly perpendicular to the acrylic surface.
- Fix the acrylic plate with a magnetic holder. An acrylic white paper surface is used to focus the beam and pre-determine the shooting coordinates.
Note 1: During shooting, gradually increase the power starting from a low setting and make sure to avoid direct exposure of bright light to your eyes. Note 2: Ensure that the surface is thoroughly clean. Use the provided lens cleaning wipes to clean the shooting area, be careful not to wipe the acrylic surface with a rag, as it can easily become charged through friction and attract dust. 4. Position the flat plate with its opposite surface facing the laser beam, remove the sticker, and accurately determine the shooting point. Please be aware that if the surface is dirty or exposed to excessively bright light, the interference fringes may become distorted and oval, and additional fringes may also form. 5. Move the power switch to "ON" position. 6. By changing the voltage falling on the laser diode, increase the light intensity. Connect the multimeter to the laser circuit to measure DC current and DC voltage. Adjust the measurement range from the highest setting to the lowest. The voltage can be increased up to 45 V. 7. A laser beam is reflected directly on a non-transparent, glossy, flat acrylic surface. As the light intensity is gradually increased, the surface will begin to melt at a certain intensity value. Melted spots can be detected visually. 8. Rotate the screw in front of the laser around the axis to adjust the focus on the surface. 9. The light spot created by the reflected radiation from the surface should be created and observed on a flat screen positioned behind the laser. Observe how the shape and size of the spots change by increasing or decreasing the intensity of the light.
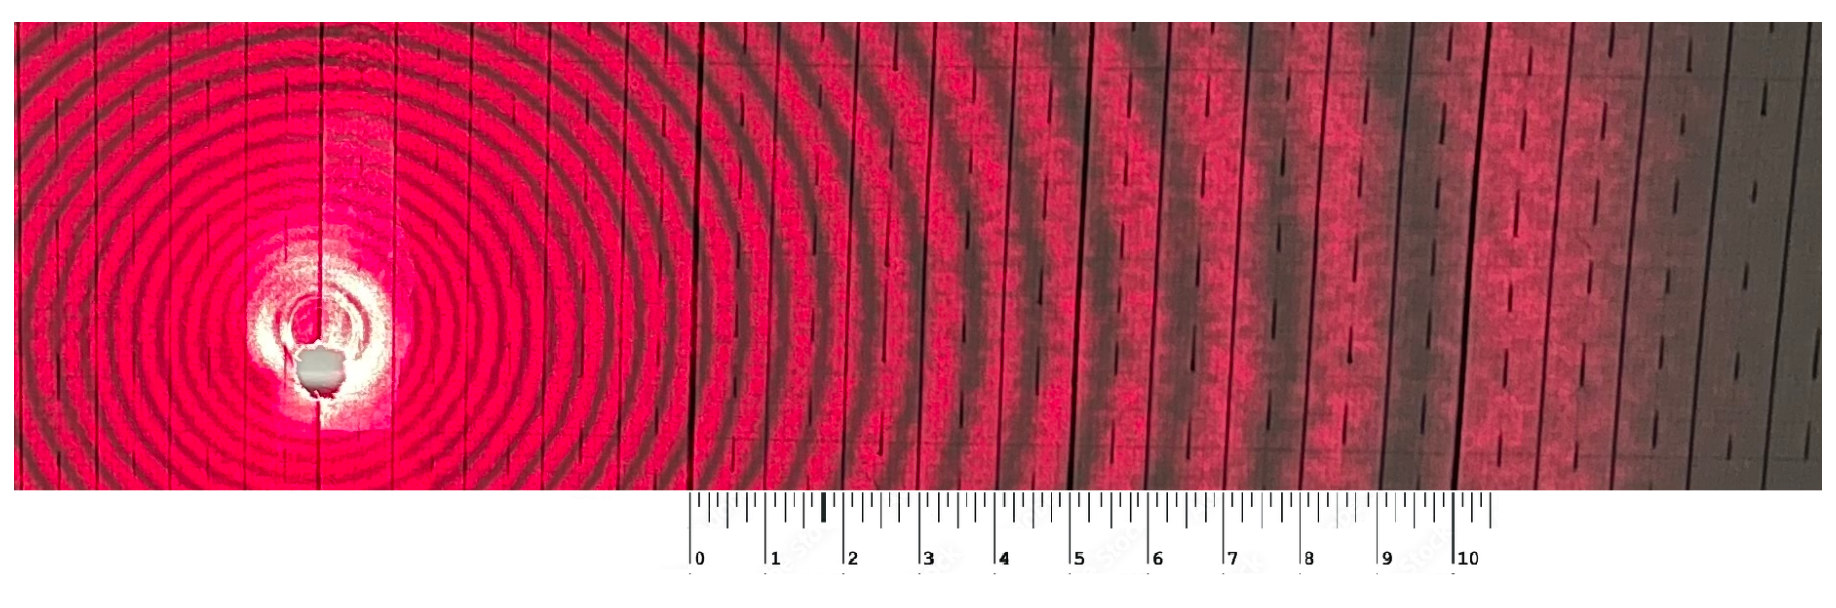
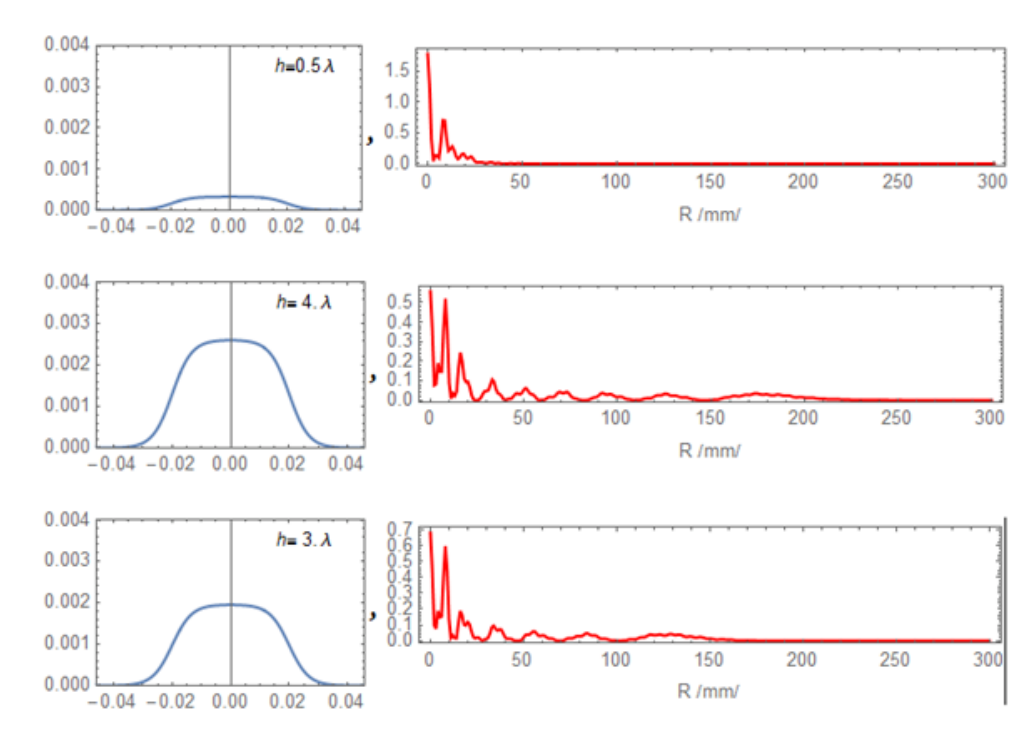
In Part D we will use the interference pattern to determine parameters of the thermal deformations. When the laser heats the surface this causes a deformation which creates an interference pattern on the screen as shown in the diagram below:
The graph in blue shows the cross section of the profile of deformation. The graph shown in red shows the intensity from the centre of the interference pattern. As the intensity increases, the height of the deformation increases and the number of bright interference fringes also increases. As we can see in the figure there is an empirical relationship between the height and the number of fringes which is
Part A The resulting pattern exhibits reversibility and shrinkage up to a certain power value. The upper boundary value corresponding to the thermo-elastic range which is known as yield strength should be determined. [0,8 т.]
A.1 Determine the power associated with this yield strength (). [0,3 т.]
A.2 Determine the diameter of the outermost bright fringe when the laser power is set to the level associated with the yield strength. [0,5 т.]
B.1 The diameter of the outermost light fringe and the number of fringes formed in this test are measured in relation to the power and the results should be recorded in an Answer sheet table. [1,5 т.]
B.2 Construct a graph depicting the relationship between the diameter of the outermost light interference fringe on the screen and the corresponding power level. [1 т.]
B.3 Plot the number of interference fringes on the screen is measured as a function of power. [1 т.]
C.1 Measure the angular width (an angle between the ray of th order fringe and the ray of th order fringe) and visible angle (an angle between the ray of th order fringe and -axis) of the dark fringe at a constant power level, depending on the number of the fringe, and record the results in Answer Sheet Table. [1,2 т.]
C.2 Plot a linear graph of the relationship between the visible angle vs order of fringe. [1 т.]
C.3 Find the slope and Y-intercept of the graph plotted in Task C.2. [0,5 т.]
C.4 Construct a graph of angular width as a function of the order of fringes. [1 т.]
Part D In this section we will use the interference pattern to determine parameters of the thermal deformations. When the laser heats the surface this causes a deformation which creates an interference pattern on the screen as shown in the diagram below: [2 т.]
D.1 By counting the number of the fringes determine the highest order of the fringes. Determine the height of the thermal deformation in terms of the laser wavelength as a function of the laser power. Plot a graph of your data. Hint: ensure your data includes the range of to . [1,4 т.]
D.2 What are the thermal deformation heights for the following input laser powers? Give your answers in units of the number of laser wavelengths.
- [0,6 т.]
Решение
Внимание: Непълно решение
No official solutions document is present in the archive for this experimental problem.
Оригинал в Архива: E2.pdf