APhO 2026, Експеримент — Задача 1. Water Clock Experiment
Experimental Exam — Q1: Water Clock Experiment · 10 т.
Условие
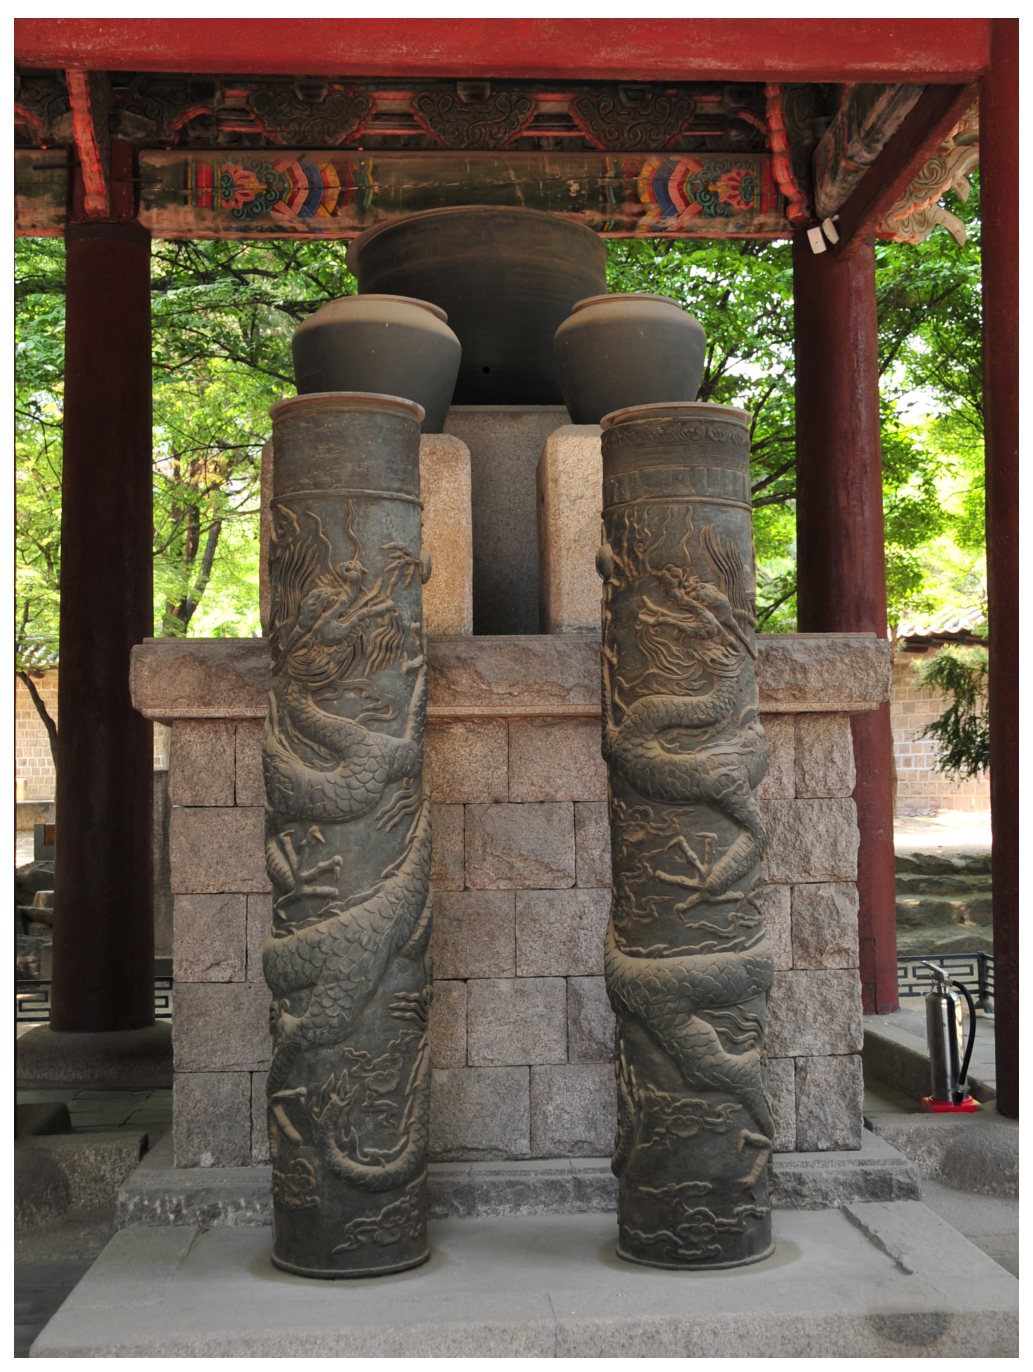
A. Introduction
Time can be measured using periodic or continuous physical processes. Before the development of modern atomic clocks, various methods were used for timekeeping, such as sundials, pendulum clocks, and water clocks.
A water clock measures time through the controlled flow of water. In this experiment, you will investigate the physical principles governing water flow and apply them to construct a water clock.
B. Experimental Components
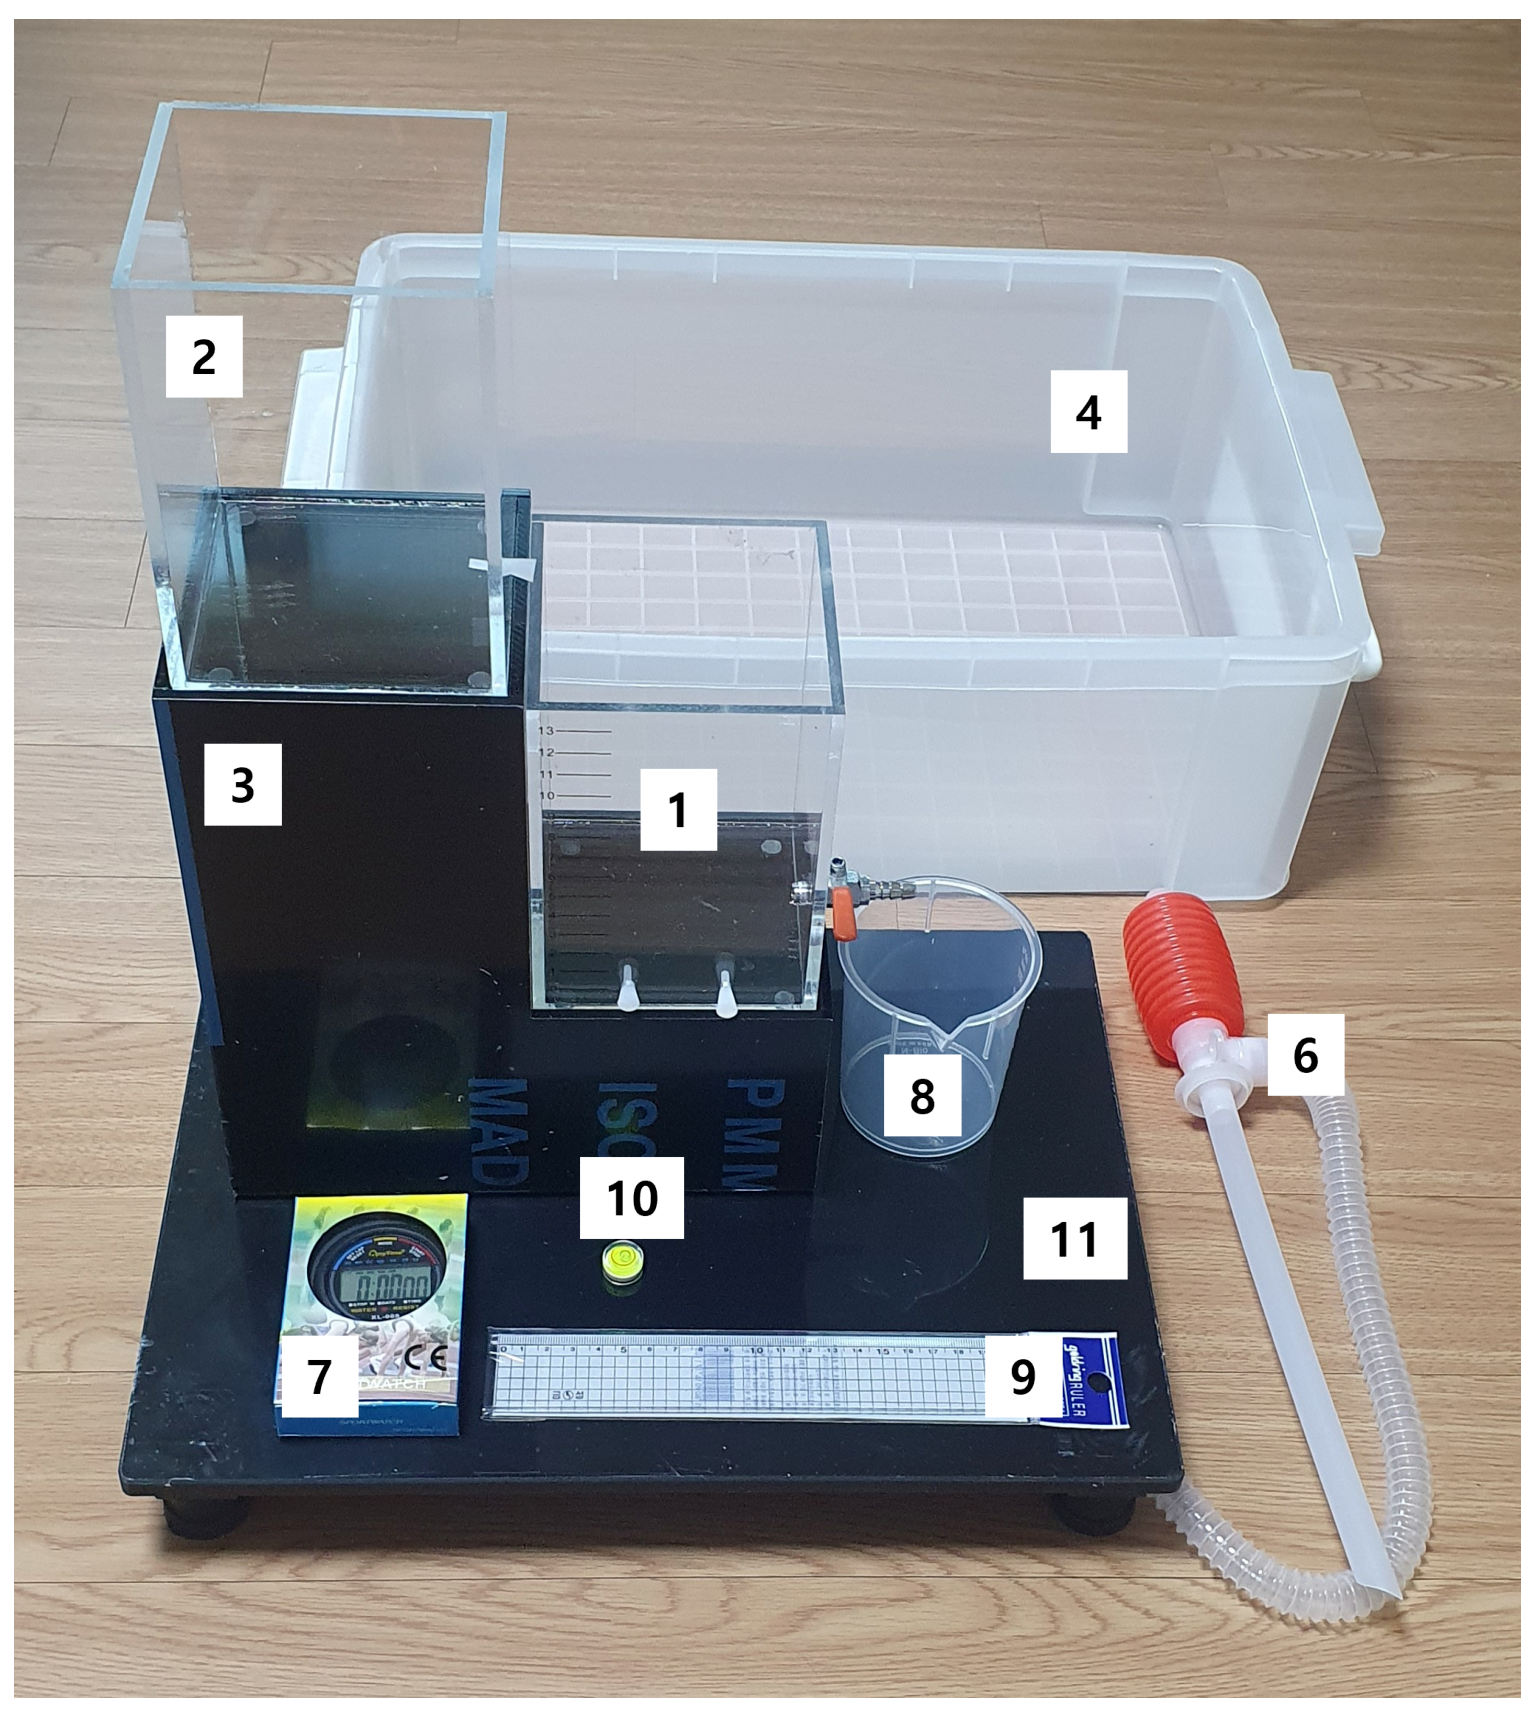
The following equipment is provided:
- Tank A (lower tank, equipped with a valve and two hole plugs)
- Tank B (upper tank, for water supply and a hole plug)
- Tank support
- Water collection container
- Two water bottles, 2 L each (Not shown in the picture)
- Siphon pump
- Stopwatch
- Beaker
- Ruler
- Spirit level (Bubble level)
- Adjustable support base
- Towel (Not shown in the picture)
*The towel is for a souvenir, please take it after the exam is over.
Adjusting support level
There are four screw pedal below the plate of adjustable support. You can change the heights each pedal by rotating it.
Siphon pump
If the water container fills up with a lot of water, you can remove it using a siphon pump. Insert the straight hose into the water, and put the flexible hose into the water bottle. Then, by applying force to the red handle, you can transfer the water into the water tank.
NOTE:
Ensure that the adjustable support and tanks are level before starting any measurements so that you can measure the heights correctly. Empty the collection container regularly to prevent floating of the apparatus. Dry your hands before writing on the answer sheet or handling other experimental equipment. Inform a supervisor immediately if leakage, malfunction occurs or losing the hole plug.
C. Experiment
Water discharge through a valve (5 pts)
- Place the adjustable support base in the water collection container.
- Set the adjustable support base horizontally by adjusting the screw pedals.
- Place tank support on the adjustable support.
- Place tank A on the tank support.
Tank A has three outlets: one diameter 5 mmhole, one 4 mm diameter hole and one 4mm diameter valve.
In part A, use only the valve.
A.1 Measure the internal dimensions of Tank A. Measure the width ,length and the spacing between the height markings on the tank. Note that the marking is from the center of the valve and the holes. [0,5 т.]
A.2 Fill Tank A with water to a height of 5.0 cm. Open the valve fully. Measure the time with uncertainty required for the water level to decrease from 5.0 cm to 4.0 cm. Use the mark on the tank for the heights. [1 т.]
A.3 Repeat the measurement in A.2 for at least four different initial water heights over 3 cm. At the lower initial heights, for example 1 to 3 cm, it takes too long for the experiment. For each measurement, record your experimental data and average time required for the water level from each height to decrease by 1.0 cm. [1,5 т.]
A.4 Find the average speed at which water flows out as it decreases by 1 cm from each initial height.
NOTE : You can use a calculator provided. [1 т.]
A.5 Assume that the average speed satisfies
Plot a suitable graph to determine the exponent . What is the exponent obtained from your graph?
Note that it is better to use the center value between initial and final heights to determine the exponent . [1 т.]
Water discharge through a hole (3 pts)
In this part, use the smaller hole in tank A, which has a diameter of 4 mm.
And the valve used in part A should be closed.
B.1 For at least five different initial water heights h, measure the time required for the water level to decrease by 1.0 cm. [1,5 т.]
B.2 Determine the average speed of the water leaving the hole for each initial water height.
Use the same method as in A-4. [0,5 т.]
B.3 Compare the average flow speed through the valve and through the hole .
Assume that,
Determine the constant . [1 т.]
Construction of a water clock (2 pts)
Construct a water clock using Tanks A and B.
Arrange the tanks as follows:
Tank A (with valve) is placed below. Tank B (with 5 mm hole) is placed above.
Tank B supplies water to Tank A.
Tank A discharges water through the valve which is fully open.
For stable operation, Tank A must remain full or overflowing by the supplied water from tank B.
C.1 Let be the minimum water height from the center of the hole in Tank B required to keep Tank A full or overflowing. Design an experiment by yourself and perform it. Record your experimental data and estimate by your experimental result. [1 т.]
C.2 Tank B must be refilled periodically to operate water clock. Design an experiment by yourself. Draw your experiment setup and write what did you measure. Determine the maximum time interval between refills experimentally while maintaining continuous operation of the water clock. [1 т.]
Отговори
A.1 W = 10.0 (± 0.1) cm, D = 10.0 (± 0.1) cm, marking spacing = 1.0 (± 0.05) cm
A.2 average time 13.1 – 13.9 s (full marks range)
A.5 x = 0.49 – 0.56 (full marks range)
B.3 0.82
Official value C2 = 0.82; full marks for 0.79 – 0.85.
C.1 hc between 4.0 cm and 5.0 cm (full marks range)
C.2 50 – 57 s (full marks range)
Решение
<2026 APhO, Experiment Marking Scheme>
Water Clock Experiment
A.1
W = ,
D =
Marking Spacing =
value within the range: 0.1 pt each
Significant figure (Total 0.2 pt)
| All values are represented well | 0.2 pt |
|---|---|
| One or two values are okay | 0.1 pt |
A.2
Number of repetitions,
| Over 5 | 0.4 pt |
|---|---|
| 3 – 4 repetitions | 0.3 pt |
| 2 repetitions | 0.2 pt |
| 1 measurement | 0.1 pt |
average value in a range of
| 13.1 – 13.9 sec. | 0.4 pt |
|---|---|
| 12.8 – 14.2 sec. but not in above range | 0.2 pt |
Calculate standard deviation,
| 0.2 pt | |
|---|---|
| 0.1 pt |
A.3
Number of repetitions for over 4 initial heights,
| Over 5 | 0.4 pt |
|---|---|
| 3 – 4 repetitions | 0.3 pt |
| 2 repetitions | 0.2 pt |
| 1 measurement | 0.1 pt |
Less than 4 initial heights,
reduce 0.1 pt from the repetition scores.
(i.e. Record 2 initial heights, but repeat 5 times for each height: 0.3 pt
0.4 pt for over 5 repetitions and -0.2 pt for lack of initial height)
NOTE :
If the number of repetitions varies for each measurement height, select the 4 with the most repetitions and calculate the average. Then, calculate the score using the rounded value.
(i.e. 3, 4, 5, 5 repetitions: average and rounded value is 4. then the score is 0.3 pt)
Compare experimental results of averaged time to the table,
If the value is in range A, 0.2 pt each,
in range B but not in range A, 0.1 pt each. The full score is 0.8 pt.
(If a student performs an experiment at 6 different heights, calculate points of 4 high scored experiments.)
| Int. heights (cm) | Range A (sec.) | Range B (sec.) |
|---|---|---|
| 4 | 14.7 – 15.7 | 14.4 – 16.0 |
| 5 | 13.1 – 13.9 | 12.8 – 14.2 |
| 6 | 11.8 – 12.6 | 11.6 – 12.8 |
| 7 | 10.7 – 11.3 | 10.5 – 11.6 |
| 8 | 9.8 – 10.4 | 9.6 – 10.6 |
| 9 | 9.3 – 9.9 | 9.1 – 10.1 |
| 10 | 8.6 – 9.2 | 8.5 – 9.3 |
| 11 | 8.1 – 8.7 | 8.0 – 8.8 |
| 12 | 7.8 – 8.2 | 7.6 – 8.4 |
| 13 | 7.5 – 8.0 | 7.4 - 8.2 |
Number of standard deviations less than 0.3,
| over 4 measurements | 0.3 pt |
|---|---|
| 3 measurements | 0.2 pt |
| 2 measurements | 0.1 pt |
A.4
Compare the calculated speed with table.
Full score 1 pt.
In range A, 0.2 pt each and in range B but not in range A, 0.1 pt each.
(Include 5 cm results, at least 5 calculations are expected. If the number of results is over 5, consider high scored 5 answers.)
| Int. heights (cm) | Range A (cm/s) | Range B (cm/s) |
|---|---|---|
| 4 | 50.9 – 54.0 | 49.9 – 55.1 |
| 5 | 57.3 – 60.8 | 56.2 – 62.1 |
| 6 | 63.4 – 67.3 | 62.2 – 68.7 |
| 7 | 70.3 – 74.6 | 68.9 – 76.2 |
| 8 | 76.5 – 81.3 | 75.1 – 83.0 |
| 9 | 80.5 – 85.5 | 79.0 – 87.3 |
| 10 | 86.9 – 92.2 | 85.2 – 94.2 |
| 11 | 92.0 – 97.7 | 90.3 – 99.8 |
| 12 | 96.6 – 102.6 | 94.8 – 104.8 |
| 13 | 99.4 – 105.5 | 97.5 – 107.7 |
A.5
Plot graph : 0.3 pt
graph : 0.1 pt
Plot details (total 0.5 pt)
| Labeling | 0.2 pt |
|---|---|
| Unit | 0.1 pt |
| Error bar | 0.1 pt |
| graph area covers over 70 % | 0.1 pt |
Answer
| 0.49 – 0.56 | 0.2 pt |
|---|---|
| 0.46 – 0.59 | 0.1 pt |
B.1
Compare data with table
In range A (0.2 pt each), In range B (0.1 pt each)
The full score is 1.0. pt and only consider 5 data sets of high scored.
| Int. heights (cm) | Range A (sec.) | Range B (sec.) |
|---|---|---|
| 4 | 12.7 – 13.5 | 12.5 – 13.8 |
| 5 | 10.2 – 10.9 | 10.0 – 11.1 |
| 6 | 9.2 – 9.7 | 9.0 – 9.9 |
| 7 | 8.7 – 9.3 | 8.5 – 9.5 |
| 8 | 8.1 – 8.6 | 7.9 – 8.9 |
| 9 | 7.5 – 8.0 | 7.3 – 8.2 |
| 10 | 7.1 – 7.5 | 6.8 – 7.7 |
| 11 | 6.8 – 7.2 | 6.6 – 7.4 |
| 12 | 6.3 – 6.7 | 6.1 – 6.9 |
| 13 | 6.2 – 6.6 | 6.0 – 6.8 |
Number of repetitions
| over 5 | 0.3 pt |
|---|---|
| 3 ~ 4 | 0.2 pt |
| 1 ~ 2 | 0.1 pt |
standard deviations
| over 3 measurements | 0.2 pt |
|---|---|
| 1~2 measurements | 0.1 pt |
B.2
Compare the calculated values with table.
in Range A : 0.1 pt
in Range B but not in range A : 0.05 pt
| Init. Heights (cm) | Range A (cm/s) | Range B (cm/s) |
|---|---|---|
| 4 | 58.8 – 62.5 | 57.7 – 63.8 |
| 5 | 73.2 – 77.8 | 71.8 – 79.4 |
| 6 | 81.8 – 86.8 | 80.2 – 88.6 |
| 7 | 95.9 – 91.2 | 83.5 – 94.1 |
| 8 | 92.2 – 97.9 | 89.5 – 101.0 |
| 9 | 99.9 – 106.1 | 97.1 – 109.5 |
| 10 | 106.2 – 112.8 | 103.2 – 116.4 |
| 11 | 110.2 – 117.0 | 107.1 – 120.7 |
| 12 | 118.4 – 125.7 | 115.0 – 129.7 |
| 13 | 120.5 – 128.0 | 117.1 – 132.0 |
B.3
| 0.79 – 0.85 | 1 pt |
|---|---|
| 0.76 – 0.88 | 0.5 pt |
C.1
Explain/Show Experiment <Idea 1> or <Idea 2> - 0.3 pt
Perform Experiment – 0.2 pt
<Idea 1>
Measure speed of the water supplied from tank B and compare the speed from tank A is fully filled. Then calculate the heights.
<Idea 2>
While watching the tank A, open the hole plug of the tank B. Once the overflowing is stopped, close the hole and measure the height.
: between 4.0 cm and 5.0 cm 0.5 pt
between 3.5 cm – 4.0 cm or 5.0 cm – 6.5 cm 0.2 pt
C.2
Explain experiments one of followings – 0.5 pt
- measurement of the time to reach the which is obtained C.1.
- measurement of the time to stop the overflowing at tank A.
time :
| 50 – 57 sec. | 0.5 pt |
|---|---|
| 45 – 65 sec. | 0.2 pt |
Оригинал в Архива: E1.pdf · официални решения: E1_sol.pdf