APhO 2026, Експеримент — Задача 2. Estimation of Unknown Resistance Using the Micro:bit's Analog-to-Digital Converter (ADC)
Experimental Exam Q2 — Estimation of Unknown Resistance Using the Micro:bit's Analog-to-Digital Converter (ADC) — Asian Physics Olympiad 2026, Busan, Korea · 10 т.
Условие
In physics, indirect derivation from observable variables is a standard approach for quantities that are difficult to measure directly. In this task, we will find out how to measure an unknown resistance using the micro:bit's built-in ADC (Analog-to-Digital Converter) to read voltage, even though its precision is somewhat limited. Rather than employing high-performance external hardware, the focus is on intellectually overcoming the device's systematic bias through strategic experimental design. As part of this approach to mitigate device-to-device ADC variations and ensure grading fairness, three separate micro:bit units are provided, allowing students to systematically reduce potential disadvantages. Ultimately, this inquiry emphasizes the process of overcoming measurement limitations to achieve reliable results within a constrained environment.
Note: Significant figures are not reflected in the grading criteria for this problem.
Apparatus and Guidelines
Breadboard: A board used to build and connect your experimental circuits. A breadboard consists of power lines along both outer edges where holes are connected entirely in vertical columns to supply power (+) and ground (-), while the middle component area features internal connections in horizontal rows of exactly five holes each (A–E and F–J). These left and right five-hole groups are completely isolated from each other by the central divider running down the middle.
Precision Resistor Sets (A, B, C, and D): High-precision components with a 0.1% tolerance, where the known resistors serve as reference "true values" to verify system accuracy, while the unknown resistors are shielded with colored tubing for experimental determination—meaning any attempt to remove or damage these covers to uncover the hidden values will be strictly penalized as exam misconduct.
- A set of resistors A: ten resistors
- A set of resistors B: a resistor , a resistor, and a resistor of unknown value (covered by a green tube. Not used in this experiment).
- A set of resistors C : a resistor and two resistors of unknown value (one covered by a blue tube and the other by a red tube).
- A set of resistors D: a resistor and a resistor of unknown value (covered by a black tube).
Participants with color blindness, please raise your flag. A staff member will assist you.
- Micro:bit Kit: A complete microcontroller setup consisting of a Micro:bit, an expansion board(3a), three pre-connected jumper wires(3b,3c,3d), and a battery holder(3e) equipped with AAA alkaline batteries.
Measuring Electric Potential and Instrumentation with provided Micro:bit kit
- Wiring Guide (Refer to Fig. 1)
Connect the three jumper wires from the expansion board according to their vertical positions:
- 3b: Top Jumper Wire ( top pin of expansion shield in Fig.1). Touch this to the specific node where you want to measure the voltage.
- 3c: Middle Jumper Wire (middle pin of expansion shield in Fig. 1). Connect to the circuit's power input (Vc,+) node.
- 3d: Bottom Jumper Wire (bottom pin of expansion shield in Fig. 1). Connect to the circuit's ground (GND, -) reference node.
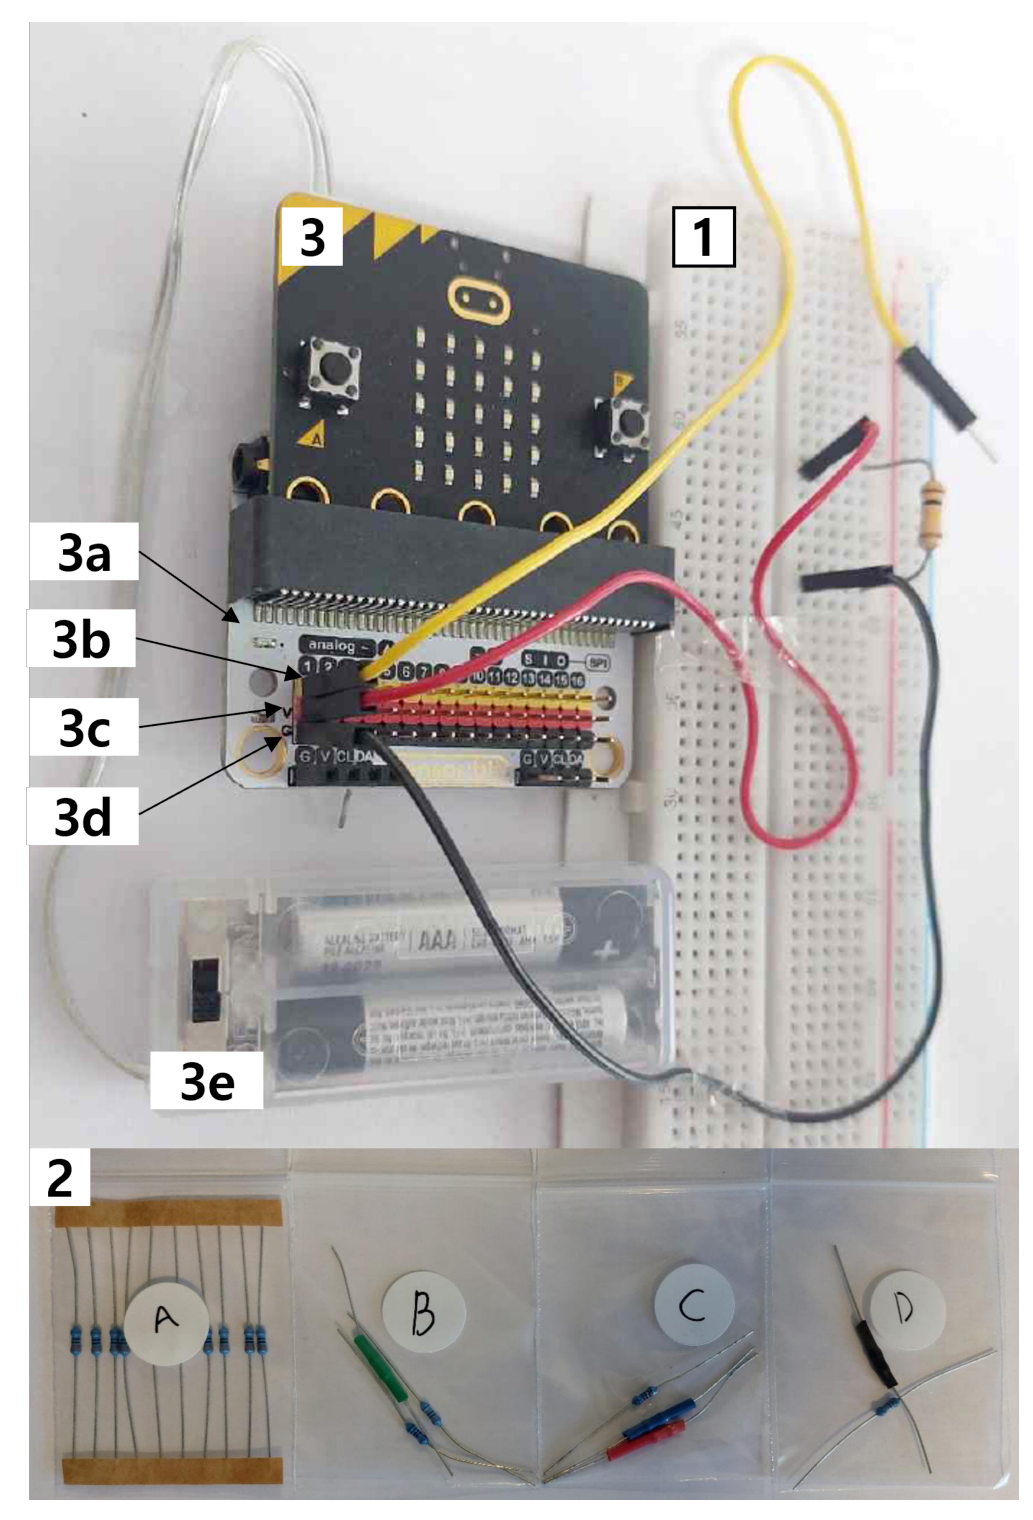
Measurement Procedure
- Power Setup: Connect the Bottom (GND) and Middle (Vc) wires first, then switch the battery pack ON.
- Pin Contact: While the power is on, touch the Top jumper wire to the target node.
- Data Entry: Press Button A or B on the front of the Micro:bit and record the scrolling digital value (N).
Important Notice
- Switch off the battery pack when not in use to conserve power.
- System Check: Connect the circuit as in Fig. 1. When you touch the Top wire to a point near the GND node, the reading should be near 0. When you touch the Top wire to the Middle wire’s connection point (Vc), the reading should be near 1023. Verifying both points ensures that the measurement system's zero reference and full scale are correctly calibrated. If the measured values differ significantly from theoretical predictions, it is likely a wiring error or poor contact rather than a hardware limitation.
- Prevent Shorts: Ensure the Middle (Vc) and Bottom (GND) wires do not touch each other directly without a load, as this can cause equipment failure. If a failure occurs, measurements will become unavailable and an error will be indicated on the display; in such cases, a replacement device will be provided only once per participant.
- No Simultaneous Use: Connecting more than one Micro:bit to a single circuit may cause system failure and is strictly prohibited in this examination hall
- Linear Mapping: Excluding the discrete step effects arising from the quantization process, a linear proportional relationship exists between the node voltage and the integer measurement outcome N in an ideal ADC model. That is, potentials ranging from 0 V to Vc are linearly mapped to digital values between 0 and 1023 in an ideal ADC model.
Part A. Exploring the Meaning of ADC Measurement Values (1.2 pts)
The objective is to investigate the correlation between the Micro:bit's digital output () and the node potential (). By constructing a network using eight identical resistors from 'Resistor Set A', you will examine whether the built-in ADC truly conforms to an ideal linear model based on the collected data. For the measurement process, the Micro:bit's pin is assumed to be an ideal probe that does not disturb the circuit's potential distribution. Assuming all resistors have identical values, this part aims to logically infer whether a proportional relationship between voltage and ADC readings actually holds, by cross-referencing the data with the circuit's structural characteristics without the use of external measuring devices.
A.1 Experimental Design and Circuit Schematics
Design a resistor network that achieves the stated experimental objectives and provide a corresponding circuit schematic. When drawing the schematic, adhere to the following guidelines:
Mark all nodes where potential measurements will be taken and assign a unique identifier to each (e.g., ).
Clearly label the connection points between the Micro:bit expansion board's power jumpers () and the resistor network as and , respectively. [0,6 т.]
A.2 Data Collection and Analysis
Conduct the experiment on the designed circuit using a single Micro:bit to obtain measurements for all nodes. Calculate the differences in ADC measurements between adjacent nodes to check linearity, and determine linearity based on a maximum deviation of 2% ( single largest difference between any individual data point and the average value of the dataset). [0,6 т.]
[Instructions for Subsequent Experiments]
Upon completion of Part A, retain only two of the resistors used in the experiment and return all others to their original container (Resistor Pack A). This is to ensure they are not mixed with other components in the following experimental procedures.
Part B. Simple Estimation and Error Analysis of Unknown Resistance Using a Known Reference (3.5 pts)
The objective of this part is to estimate the value of an unknown resistance using a known reference resistor and the Micro:bit's ADC output. The following assumptions are made for the analysis:
- ADC Linearity: The internal ADC is assumed to maintain a linear relationship between potential and the digital output .
- Notation for Calibration Constants: and represent the readings at the and nodes, respectively. (Ideally, and ).
- Setup: Select any two resistors from Part A to serve as the reference () and the unknown ().
B.1 Circuit Design and Schematics
Design a measurement circuit to measure an unknown resistor (), using a reference resistor () . Provide a corresponding circuit schematic.
Note: The reference resistor must be directly connected to the GND node. Label all measurement nodes with letters and specify all related variables in the circuit schematic. Clearly label the connection points between the Micro:bit expansion board's power jumpers () and the resistor network as and , respectively. [0,5 т.]
B.2 Derivation of Estimation Formulas
Using the voltage divider rule, derive an expression for the unknown resistance. Start by establishing the relationship between node potentials and derive the final formula using ADC output values in terms of , , and so on. Then rewrite the formula in the case of and . [0,5 т.]
B.3 Experiment and Data Analysis
Perform measurements using three Micro:bits, taking one reading per node for each device, and record the data. Assuming the true values of both the known and unknown resistance are , calculate the mean relative error () averaged over 3 ADCs and the relative standard deviation (RSD) of the estimated resistance values. Mean relative error is the average magnitude of the deviation between measured and true values, normalized by the true value. RSD is the ratio of the standard deviation to the mean. [1 т.]
B.4 Analyze how the ADC measurement error () affects the accuracy of the estimated resistance. For simplicity, assume and . Derive a relationship for the resulting resistance error in terms of and . Assume that is sufficiently small compared to . [0,6 т.]
B.5 Resistance Range for a Given Error Tolerance
Assuming an ADC error of , calculate the required range of for which the relative error of the resistance () remains within 1%. [0,9 т.]
[Instructions for Subsequent Experiments]
Upon completion of Part B, return all to their original container (Resistor Pack A). This is to ensure they are not mixed with other components in the following experimental procedures.
Part C. Improving Resistance Estimation (1) :Overcoming The Problem of Quantization Error (1.9 pts)
This experiment aims to achieve more accurate resistance estimation under conditions where the basic method from Part B is insufficient due to quantization error. Quantization error is the difference between the continuous analog input signal and its discrete, digitized representation resulting from the finite resolution of an Analog-to-Digital Converter (ADC). When the resistance ratio () deviates significantly from 1, the quantization error (a single-step difference in ADC reading) is disproportionately amplified, leading to substantial errors in the estimated resistance. Resistor Set C is used in this part.
C.1 Initial Resistance Estimation and Statistical Analysis
Using the reference resistor () from Resistor Pack C, estimate the values of unknown resistors (blue tube) and (red tube) respectively, based on your Part B method. Calculate the estimated resistance for one of the three Micro:bits. [0,6 т.]
C.2 Experimental Design for Precision Enhancement
Based on the results from C.1, the precision or reliability of the estimated values obtained for the unknown resistor (red tube) may not be entirely satisfactory. This is due to the physical characteristic where estimation error follows a U-shaped curve depending on the resistance ratio (). To address this issue and achieve a more accurate estimation of , design an experimental scheme and provide the necessary circuit schematics with .
Note: All schematics must clearly label the measurement nodes and associated variables. Clearly label the connection points between the Micro:bit expansion board's power jumpers () and the resistor network as and , respectively. [0,6 т.]
C.3 Experiment and Data Analysis
Re-estimate the value of based on the new experimental design proposed in C.2. Calculate the resistance for each of the three Micro:bits and calculate the difference between the maximum and minimum values of the estimated resistance. [0,7 т.]
[Instructions for Subsequent Experiments]
Upon completion of Part C, return all to their original container (Resistor Pack C). This is to ensure they are not mixed with other components in the following experimental procedures.
Part D. Improving Resistance Estimation (2) (3.4 pts)
Resistor Pack D contains a known resistor and an unknown resistor . Applying the simple estimation method from Part B may lead to significant measurement errors. The discrepancies observed in this task arise from a distinct physical factor—one that is fundamentally different from both the ADC nonlinearity and the amplification of quantization errors (Part C). Your challenge is to identify this underlying factor and develop a measurement strategy to achieve an accurate estimation of .
D.1 Circuit Design and Schematics
Devise a method to improve accuracy of estimating unknown resistor , and provide a corresponding circuit schematic.
Note: Label all measurement nodes and associated variables on the schematic. Clearly label the connection points between the Micro:bit expansion board's power jumpers () and the resistor network as and , respectively. [0,8 т.]
D.2 Derivation of Estimation Formulas
Based on your circuit design, derive the mathematical expressions to calculate the unknown resistance . Start by establishing the relationship between node potentials and , then derive the final formula using ADC output values ( ). [1,8 т.]
D.3 Experiment and Data Analysis
Implement your design and estimate the value of . Calculate the estimated resistance for each of the three Micro:bits and derive the mean () and calculate the difference between the maximum and minimum values of the estimated resistances. [0,8 т.]
Отговори
B.2
Official solution, equations (3) and (4), for the circuit with at the top and connected to GND.
B.4
B.5
Official solution: , rounded to (3**).
D.2
Official solution, equation (5): two measurements with and swapped, which cancels the ADC input (internal) resistance .
Решение
※ The reference value used to determine the accuracy of resistance estimation in this question is defined as twice the variance of the estimates obtained from 20 Micro:bit devices.
※ No marks will be awarded for the execution of the experiment if the experimental design fails to provide a valid solution to the problem.
※ No marks will be awarded if the student fails to present the requested numerical value in a form that the examiner can readily verify.
Part A
A.1)
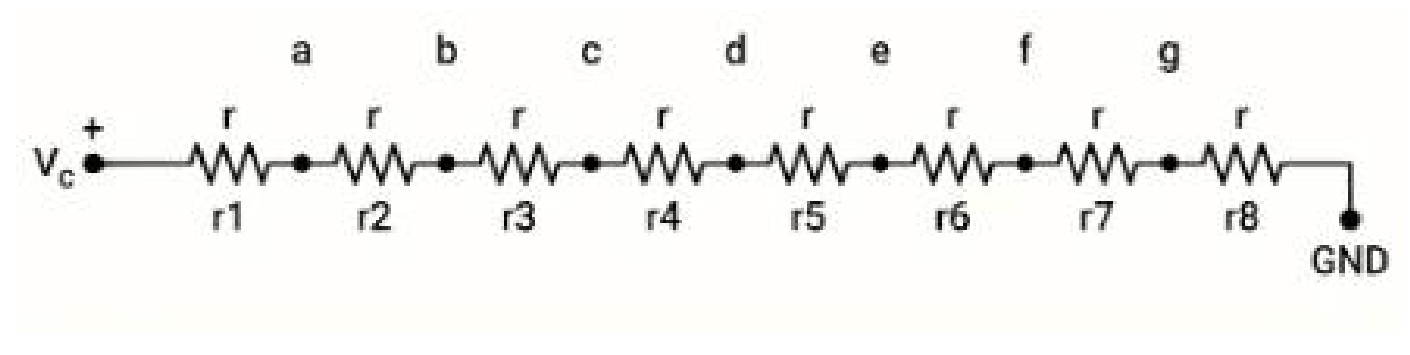
| Criteria | Points |
|---|---|
| If the circuit diagram connection (resistor ladder) is correctly expressed. | 0.4 |
| If all the measurement nodes are specified and correctly named | 0.1 |
| If and nodes are correctly labeled | 0.1 |
A.2)
Raw Data Table
| ADC1 | 0 | 128 | 257 | 385 | 513 | 639 | 769 | 897 | 1023 |
Derived Data Table
| (g/GND) | (f/g) | (e/f) | (d/e) | (c/d) | (b/c) | (a/b) | 1 2 6 (/a) | ||
|---|---|---|---|---|---|---|---|---|---|
| ADC1 | 128 | 129 | 128 | 128 | 126 | 130 | 128 | 126 | 127.88 |
maximum deviation =2.125/127.85*100=1.66%
□ Linearity Verification (Within 2% Maximum Deviation)
[ √ ] Pass: The differences in ADC measurements between all adjacent nodes fall within the 2% threshold.
[ ] Fail: The deviation exceeds 2% at one or more nodes.
(Note: Depending on the specific Micro:bit unit used, a conclusion regarding linearity may or may not be drawn. The final conclusion itself is not critical; full credit will be awarded provided that the reasoning leading to the conclusion is rigorously justified.)
| Criteria | Points |
|---|---|
| The raw data table includes columns for recording 9 measured node values. | 0.1 |
| The derived data table includes columns for the 8 differences between adjacent nodes | 0.1 |
| If the student's calculated value of average difference (), based on the data, is within a ±1% relative tolerance of the examiner's re-calculated value. | 0.2 |
| Points are awarded if the student's calculated maximum deviation directly matches the examiner's re-calculated value (derived from the student's raw data) within a ±10% relative tolerance. | 0.1 |
| If the student's conclusion regarding linearity matches the grader's recalculated data analysis | 0.1 |
B-1)
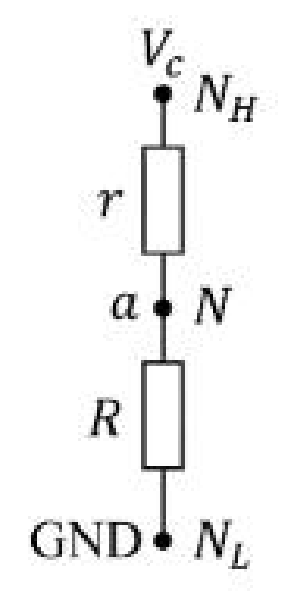
| Criteria | Points |
|---|---|
| If the circuit diagram connection (resistor ladder) is correctly expressed. | 0.3 |
| If all the measurement nodes are specified and correctly named | 0.1 |
| If and nodes are correctly labeled | 0.1 |
B-2)
To estimate the unknown resistance , a known reference resistor is connected in series with . The voltage at the junction, measured by the ADC, is determined by the voltage divider principle:
Assuming a linear relationship between the input voltage and the ADC output , we define calibration constants at GND and at
Due to linearity, voltage can be expressed in terms of the digital reading as:
From (1), (2), unknown resister satisfies:
If and , then:
| Criteria | Points |
|---|---|
| If Equation (3) is correctly obtained (correctly expresses the unknown resistance as a function of ) | 0.4 |
| If Equation (1) is correctly obtained | 0.2 |
| If Equation (2) is correctly obtained | 0.2 |
| Correct result for Equation (4) when | 0.1 |
B-3)
| ADC1 | 0 | 512 | 1023 | 3294 | ,,, |
| ADC2 | 1 | ,,, | 1022 | ,,, | ,,, |
| ADC3 | 0 | ,,, | ,,, | ,,, | ,,, |
RSD=
※ Credit will be awarded only if the design in B.1 is correct.
| Criteria | Points |
|---|---|
| If for each device are all measured and recorded. | 0.2 |
| Points are awarded if the student's calculated value of unknown resistance directly matches the examiner's re-calculated value (derived from the student's raw data) within a ±1% relative tolerance. (Evaluate only the device for which the student's estimate is most accurate among the three Micro:bit experiments.) | 0.2 |
| If at least one of the unknown resistance values estimated by each Micro:bit falls within a 1% error range | 0.2 |
| Points are awarded if the student's calculated value of mean relative error directly matches the examiner's re-calculated value (derived from the student's raw data) within a ±1% relative tolerance. (The evaluation focuses solely on the accuracy of the process for calculating the relative error from the estimated resistance values, rather than the raw data.) | 0.2 |
| Points are awarded if the student's calculated value of RSD (Relative Standard Deviation) directly matches the examiner's re-calculated value (derived from the student's raw data) within a ±1% relative tolerance. (The evaluation focuses solely on the accuracy of the process for calculating the relative error from the estimated resistance values, rather than the raw data.) | 0.2 |
B-4)
| Criteria | Points |
|---|---|
| If Equation (1) (dr/dN) is correctly obtained | 0.2 |
| If Equation (2) () is correctly obtained | 0.2 |
| If Equation (2) for is correctly obtained | 0.6 |
B-5)
ADC error ,
에서
thus.
| Criteria | Points |
|---|---|
| If Equation (1) or (1*) is correctly obtained | 0.4 |
| If Equation (2) is correctly obtained | 0.2 |
| If Equation (3), (3*), or (3 ) is correctly obtained . Full marks if the student's calculated range, when rounded, matches the inequality (3) | 0.9 |
Part C
※ Full credit will be awarded to any student-designed experiment that successfully solves the given problem while meeting the required conditions.
※ Maintaining the reference resistance as fails to resolve the quantization error; therefore, it is not recognized as a valid design, and no marks will be awarded.
※ The resistors used in this experiment are Class B resistors with a 0.1% tolerance; is specified as , as , and as .
C.1)
case:
| ADC1 | 0 | 904 | 1023 | 1580 |
case:
| ADC1 | 0 | 1005 | 1023 | 215 |
| Criteria | Points |
|---|---|
| are recorded for each unknown resistor and device. | 0.2 (0.1 per resistor) |
| Points are awarded if the student's calculated value of unknown resistance directly matches the examiner's re-calculated value (derived from the student's raw data) within a ±1% relative tolerance. | 0.4 (0.2 per resistor) |
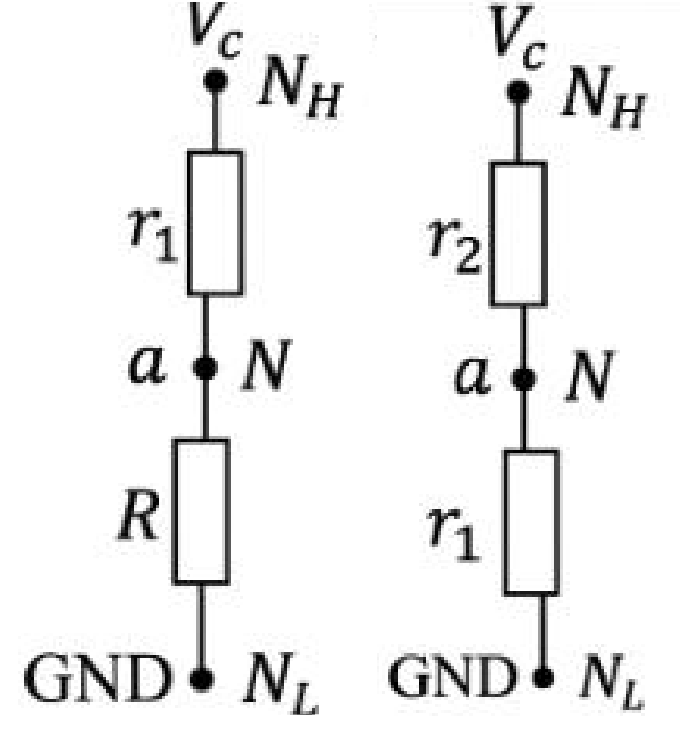
C-2)
Note: Alternative approaches are also acceptable, such as estimating unknown resistor 1 using the reference resistor, and then using the parallel combination of the reference resistor and unknown resistor 1 as a new reference to estimate unknown resistor 2.
The method of estimating and using and then subtracting them to find still suffers from quantization error issues, Thus is invalid design.
| Criteria | Points |
|---|---|
| Circuit diagram is appropriate (demonstrates intent to use or an equivalent combined resistance of a similar size as a new reference resistance) | 0.4 |
| Measurement nodes are specified and correctly named. | 0.1 |
| and nodes are appropriately labeled. | 0.1 |
C.3)
| ADC1 | 0 | 904 | 1023 | 1580 | 0 | 891 | 1023 | 234 |
| ADC2 | 0 | 904 | 1023 | 1580 | 0 | 891 | 1023 | 228 |
| ADC3 | 0 | 906 | 1023 | 1550 | 0 | 892 | 1023 | 227 |
maximum-minimum () =
※ Credit will be awarded only if the design in C.2 is correct.
| Criteria | Points |
|---|---|
| If the values of estimated in C1 are utilized for the estimation, and the measurements of are recorded using the designated resistors as the reference resistor. | 0.2 |
| Points are awarded if the student's calculated value of unknown resistance directly matches the examiner's re-calculated value (derived from the student's raw data) within a ±1% relative tolerance. (Evaluate only the data from device for which the student's estimate is most accurate among the three Micro:bit experiments.) | 0.2 |
| If the calculated unknown resistance is accurately estimated within an range of using at least one device. | 0.2 |
| If the calculated (difference between maximum and minimum) from the student’s data of resisters is correct | 0.1 |
Part D.
※ Full credit will be awarded to any student-designed experiment that successfully solves the given problem while meeting the required conditions.
※ "Zero marks will be awarded if multiple Micro:bits are used simultaneously within a single circuit, as this violation directly conflicts with the explicit prohibition stated in the question: “No Simultaneous Use: Connecting more than one Micro:bit to a single circuit may cause system failure and is strictly prohibited in this examination hall.
※ No marks will be awarded unless the internal resistance issue is explicitly resolved in a well-designed experiment and the resistance estimation formula derived from the experimental data is correct.
※ The resistors used in this experiment are Class B resistors with a 0.1% tolerance; is specified as , as .
D.1)
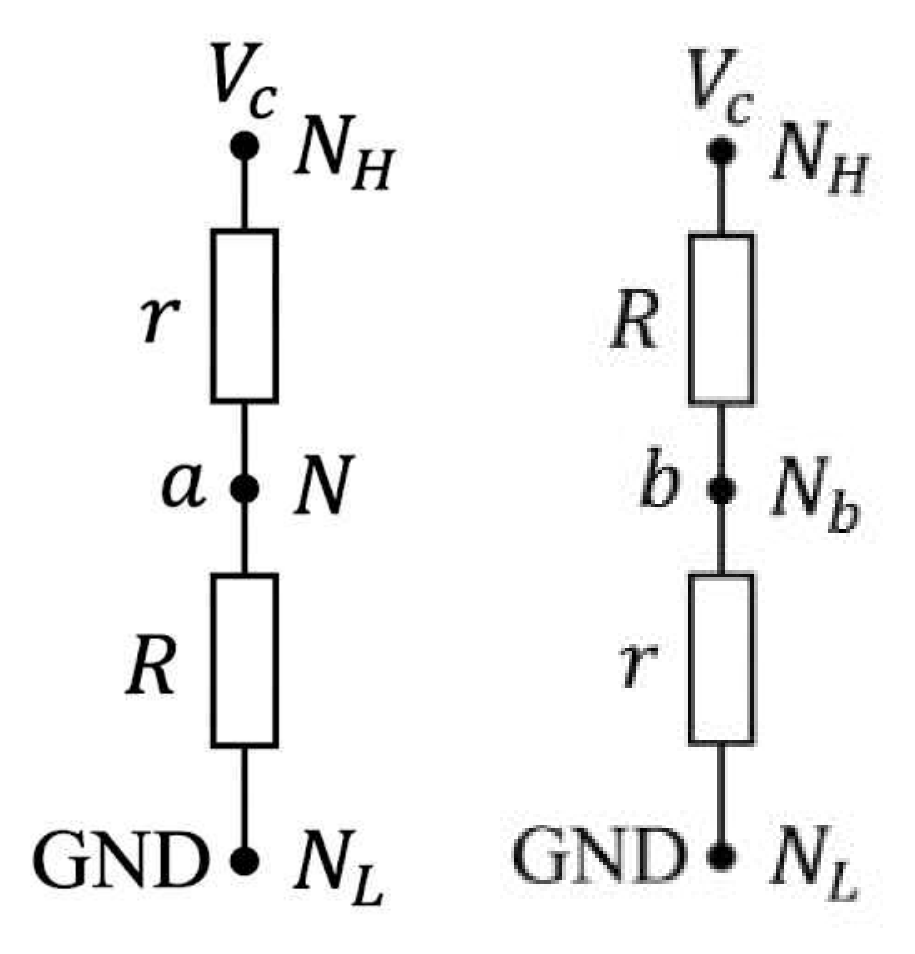
| Criteria | Points |
|---|---|
| Circuit diagram includes a solution to estimate unknown resistance while considering internal resistance. | 0.6 |
| Measurement nodes are specified and correctly named. | 0.1 |
| and nodes are appropriately labeled. | 0.1 |
D.2)
Case 1: Unknown resistor () at the top, reference resistor () at the bottom. The voltage is divided while and the instrument's internal resistance are in parallel.
Equivalent resistance at the bottom:
Voltage divider rule:
By combining the two:
Using the linear relationship between the ADC and voltage:
Case 2: Reference resistor () at the top, unknown resistor () at the bottom. Now and are in parallel.
Equivalent resistance at the bottom:
Voltage divider rule:
By combining the two:
Using the linear relationship between the ADC and voltage:
From (1)~(4) the following is derived:
| Criteria | Points |
|---|---|
| If Eq. (5) is correctly obtained. (Full marks if the resistance estimation formula based on experimental values is correct, provided the experiment is well-designed and explicitly addresses the internal resistance issue.) | 1.8 |
| If Eq. (1) or (3) is correctly obtained (Points will be awarded if the voltage relationship formula taking internal resistance into account is derived) | 0.5 |
| If Eq. (2) or (4) is correctly obtained | 0.3 |
D.3)
| () | |||||
|---|---|---|---|---|---|
| ADC1 | 0 | 450 | 589 | 1023 | 668 |
| ADC2 | 0 | 450 | 591 | 1023 | 670 |
| ADC3 | 0 | 449 | 589 | 1023 | 669 |
maximum-minimum () =
※No credit will be given if the experiment is conducted using the basic method of PART B.
※ Credit will be awarded only if the design in D.1 is valid to overcome the issue of internal resistance.
| Criteria | Points |
|---|---|
| If all measurements required to estimate the resistance for each device are recorded. | 0.2 |
| Points are awarded if the student's calculated unknown resistance is within a ±1% tolerance of the examiner's re-calculated value. (Only the data from the single Micro:bit experiment that yielded the highest accuracy among the three will be evaluated.)" | 0.2 |
| If at least one of the unknown resistance values estimated by each Micro:bit falls within the reference range, | 0.3 |
| Points are awarded if values (difference between the maximum and minimum) is correctly calculated and verifiable from the student's data. | 0.1 |
Оригинал в Архива: E2.pdf · официални решения: E2_sol.pdf