EuPhO 2017, Експеримент — Задача 1. Light-emitting diode
1 Light-emitting diode
Условие
Light Emitting Diodes (LEDs) are the most efficient light sources. During recent years, the cheap, powerful and reliable LED light bulbs appeared on the market. This is making a true revolution worldwide, as other electrical lighting tools (e.g. incandescent, halogen and fluorescent) in homes and offices are being replaced with LED lighting.
In this experiment, we will analyse thermal and electrical properties of the light emitting diodes.
You do not need to estimate any uncertainties, but the accuracy of your methods and results is important and will be graded. Always draw the measurement setup you use! When appropriate, use graphs for determining required quantities.
Equipment: 2 identical circuit boards with a LED, resistor and a temperature sensor on them; 2 transparent bottles, 2 airtight caps, 2 tubes, water, syringe, 3 multimeters (the multimeter labelled as “voltage-only” is to be used only for voltage measurements), 2 potentiometers, power supply, cables, stand, stripes of graph paper with millimeter scale.
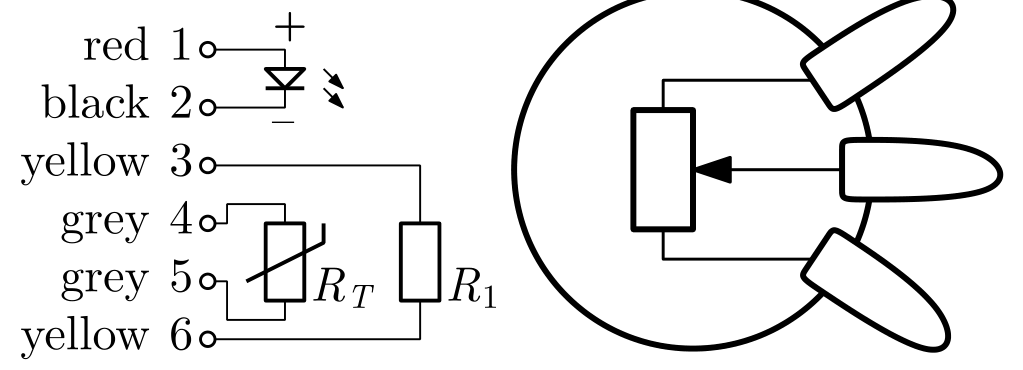
The schematic and connections of the circuit board (left) and the potentiometer (right) are in the figure. The resistor may be used for heating the board near the LED. The temperature sensor (thermistor) is another resistor whose resistance depends strongly on the absolute temperature :
Warning! Apply voltage to the LED only with the polarity shown! The red lead of the power supply is “+” (and should be connected to the red connector of the LED) and the black lead is “−”.
The multimeter has a mode marked “” that acts as a source of an approximately constant small current, when a diode is connected between the “mAVΩ” (supplies “+”) and “COM” (“−”) terminals. In this mode the multimeter shows the voltage across the diode in volts, while supplying about (you may assume the current stays fixed).
In a simplified theory, the diode current , voltage drop at the junction inside the LED where light is emitted, and absolute temperature of the junction obey
Boltzmann constant and elementary charge . The variable is called the thermal voltage. The parameters and depend on the materials of the LED; the parameter depends also on the construction of the LED. The parameter is called the ideality factor and usually . The parameter is called the nominal bandgap voltage of the semiconductor material.
The voltage across a physical diode has also contribution from a parasitic series resistance which is of the order of . Hint: estimate the magnitudes in the expression above and simplify your calculations accordingly!
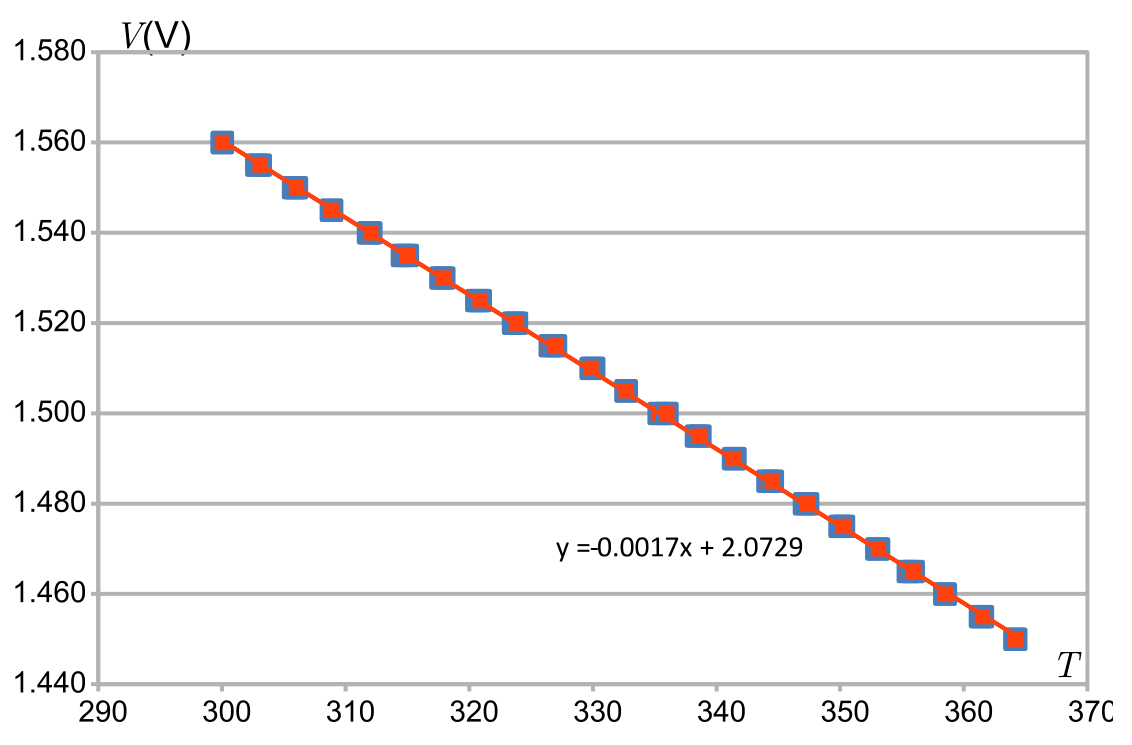
1. Measure and plot the voltage–temperature graph of the LED at a constant current (your current should be small enough so that the voltage drop on can be neglected).
Find .
Find the parameters and by making additional measurements and a suitable plot.
At larger currents, the series resistance becomes noticeable. Measure this .
2. Define the efficiency of the LED as the ratio between the power radiated as light and the consumed electrical power. Measure a value of the efficiency of the LED without using the temperature sensor.
3. The LED also behaves as a solar cell (or a photodiode). The photocurrent generated by light does not depend on the voltage and is proportional to the light intensity; it is subtracted from the diode current (). The photocurrent from the ambient light was low enough not to affect previous measurements.
Place two LEDs directly opposite to each other at distance, and supply one of them with . Determine the maximum electrical power that can be harvested from the LED in this lighting setup at room temperature.
Determine the corresponding photoefficiency — electrical power output divided by the power of the light absorbed by the active area of the LED. This area is . Assume that the LED radiates uniformly into of the sphere.
Отговори
1. VG0 ≈ 2.085 V; n ≈ 1.55; A ≈ 119 A; Rs ≈ 0.75 Ω
From the official solution. The solution prints the bandgap voltage as “vG0 ≈ 2.085 V” (lowercase v).
2. 0.48
The official solution prints the result as “kD = 1 − 41.0 mm/W/79.8 mm/W ≈ 0.48” (the quantity is the efficiency η; the fitted slope on the graph is 79.1x). With the temperature sensor it gives η ≈ 0.46 ± 0.04.
3. Pmax ≈ 17 μW (measured); ηp ≈ 0.04
From the official solution. The model-based estimate in the same solution is printed as Pmax ≈ 0.026 mW with Ip ≈ 0.020 mA; the measurement gives Ip = −15 “µV” (printed unit; a current in µA is meant).
Решение
Task 1. The easiest way to obtain -graph is to use the diode function of the multimeter for measuring diode voltage . The board is heated by driving through the resistor a current which is adjusted using the potentiometer.
| (V) | (kΩ) | (K) | (V) | (kΩ) | (K) |
|---|---|---|---|---|---|
| 1.560 | 9.25 | 300.0 | 1.560 | 9.25 | 300.0 |
| 1.555 | 8.18 | 302.8 | 1.555 | 8.08 | 303.1 |
| 1.550 | 7.2 | 305.8 | 1.550 | 7.13 | 306.0 |
| 1.545 | 6.33 | 308.9 | 1.545 | 6.33 | 308.9 |
| 1.540 | 5.6 | 311.9 | 1.540 | 5.56 | 312.0 |
| 1.535 | 5.02 | 314.6 | 1.535 | 4.94 | 315.0 |
| 1.530 | 4.44 | 317.7 | 1.530 | 4.4 | 317.9 |
| 1.525 | 3.97 | 320.6 | 1.525 | 3.93 | 320.9 |
| 1.520 | 3.55 | 323.6 | 1.520 | 3.52 | 323.8 |
| 1.515 | 3.18 | 326.6 | 1.515 | 3.13 | 327.0 |
| 1.510 | 2.8 | 330.1 | 1.510 | 2.82 | 329.9 |
| 1.505 | 2.55 | 332.7 | 1.505 | 2.55 | 332.7 |
| 1.500 | 2.32 | 335.4 | 1.500 | 2.27 | 336.0 |
| 1.495 | 2.09 | 338.4 | 1.495 | 2.07 | 338.7 |
| 1.490 | 1.88 | 341.5 | 1.490 | 1.888 | 341.4 |
| 1.485 | 1.72 | 344.1 | 1.485 | 1.7 | 344.5 |
| 1.480 | 1.56 | 347.1 | 1.480 | 1.546 | 347.4 |
| 1.475 | 1.42 | 350.0 | 1.475 | 1.407 | 350.3 |
| 1.470 | 1.29 | 353.0 | 1.470 | 1.285 | 353.1 |
| 1.465 | 1.19 | 355.5 | 1.465 | 1.175 | 355.9 |
| 1.460 | 1.085 | 358.5 | 1.460 | 1.083 | 358.5 |
| 1.455 | 0.992 | 361.4 | 1.455 | 0.987 | 361.5 |
| 1.450 | 0.911 | 364.1 | 1.450 | 0.909 | 364.2 |
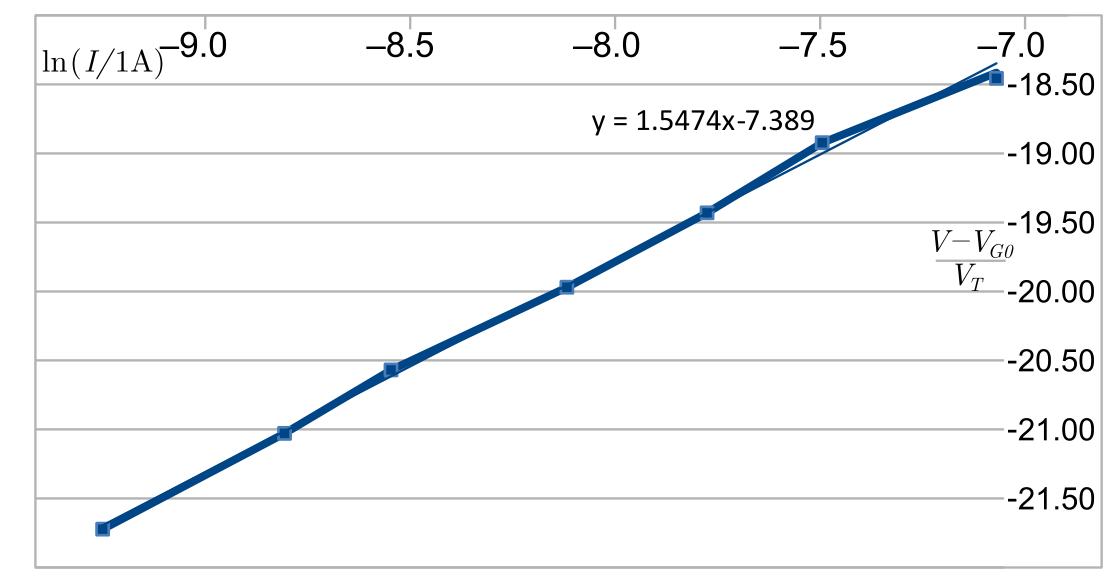
Once we estimate the magnitude of the terms in the expression for , we’ll find that for ; all the voltages are much larger than that, so the unity can be neglected. Then, with constant , we have (the constant appears to be negative), hence , where is a constant. So, we need to plot versus , and is found as the intersection point of the linear regression line with the vertical axis.
From the linear regression we obtain .
Next we can make a series of measurements with small currents so that the diode will have essentially the room temperature. Then we can take logarithm from the expression of (while neglecting the unity) to obtain
Thus, if we plot versus , and can be obtained as the linear regression parameters.
Alternatively, we can make a series of measurements with a fixed voltage applied to the diode, and measure current for different temperatures. Based on the same expression as given above, we need to plot versus . Such data are given in the table below.
| (mA) | (kΩ) | (K) | ||
|---|---|---|---|---|
| 33.3 | 9.76 | 298.8 | -10.310 | -22.25 |
| 44.8 | 5.51 | 312.3 | -10.013 | -21.29 |
| 96.6 | 7.12 | 306.1 | -9.245 | -21.72 |
| 150.0 | 4.72 | 316.1 | -8.805 | -21.03 |
| 194.1 | 3.6 | 323.2 | -8.547 | -20.57 |
| 297.0 | 2.53 | 332.9 | -8.122 | -19.97 |
| 417.0 | 1.84 | 342.1 | -7.782 | -19.43 |
| 551.0 | 1.36 | 351.3 | -7.504 | -18.92 |
| 840.0 | 1.002 | 361.0 | -7.082 | -18.41 |
| 860.0 | 0.95 | 362.8 | -7.059 | -18.33 |
If we plot these data we’ll see that most of the data points lie on a straight line, but first two and the very last one will deviate. Data points corresponding to very small currents deviate because of large relative uncertainties, last data point deviates because the parasitic resistance can no longer be neglected. So we discard these from our analysis.
With this graph, the tangent of the slope of the regression line gives us directly . The intercept gives us , so that .
By very large currents, a certain change in current will give rise to just a tiny change in the voltage drop at the diode junction, if we can keep the temperature constant by compensating with the resistor. [according to the exponential dependence of ], which is much smaller than the change in the voltage drop on the parasitic resistor . So, we can determine from the experimentally measured dependance of the diode current on the total voltage at the limit of large currents.
| (kΩ) | (A) | (V) |
|---|---|---|
| 0.986 | 0.85 | 2.41 |
| 1.435 | 0.7 | 2.3 |
| 1.360 | 0.75 | 2.33 |
| 6.55 | 0.189 | 1.916 |
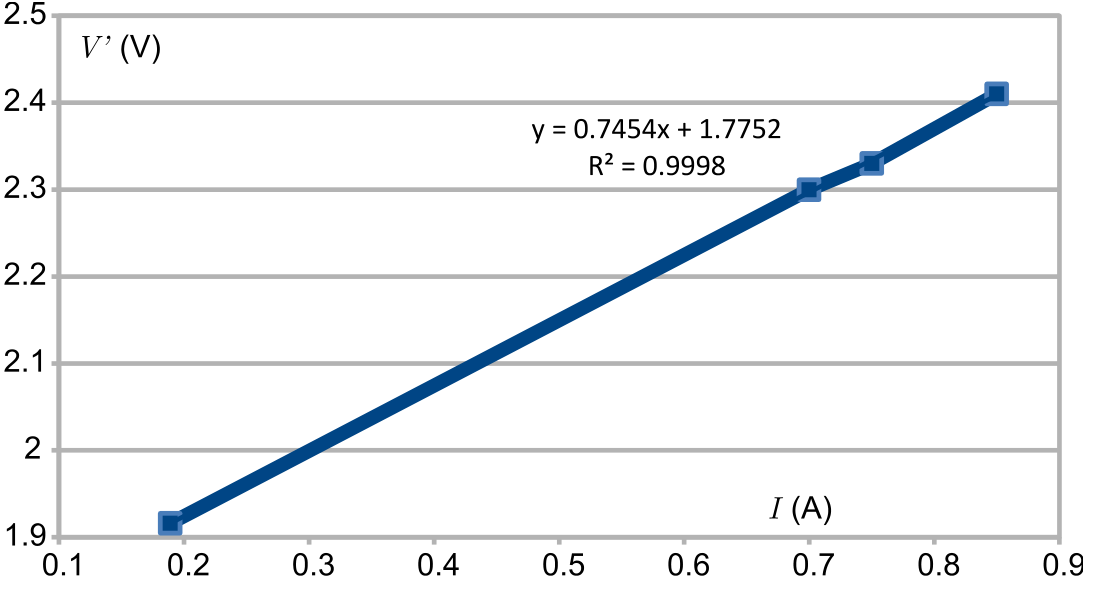
The regression line slope gives directly .
Other option is to measure the voltage, temperature and current (at high current values) and subtract the diode voltage calculated from the model to get the voltage drop on series resistance.
In both cases, it is important that the voltage is measured directly from the LED wires, to ignore the any additional voltage drops on high current carrying part of circuit.
Task 2. The idea is to compare the thermal expansion of air inside the bottle when the heat is being released by the diode, and when this is done by the resistor. In the latter case, all the consumed electrical power is released as heat; in the former case, part of the heat escapes the bottle as light radiation energy. The pressure inside a bottle is a function of its temperature, and the temperature which will establish inside the bottle is defined by the balance between the thermal dissipation power, and the rate by which heat is escaping the bottle. The latter is a function of the temperature inside the bottle, and hence, the temperature inside the bottle is a function of the heat dissipation power. Therefore, the pressure inside the bottle is also a function of the heat dissipation power.
First we need to build a manometer which allows us to measure pressure difference — either between the pressure inside the bottle and the atmospheric pressure, or between the pressure inside the two bottles. To that end, we fill a tube with water and folding it into a U-tube; pressure difference can be determined via the water column height difference between two halves of the tube.
One possible approach to this problem is to compare heat dissipation on the diode with a heat dissipation on the resistor: one may adjust (using the potentiometer) the heating power of the resistor to reach such a state that the pressures inside the bottles are equal. If this state is reached when the electrical consumption power of the diode is and the power of the resistor is then we can conclude that thermal dissipation power of the diode is also , and hence, escapes the bottle as the light radiation so that .
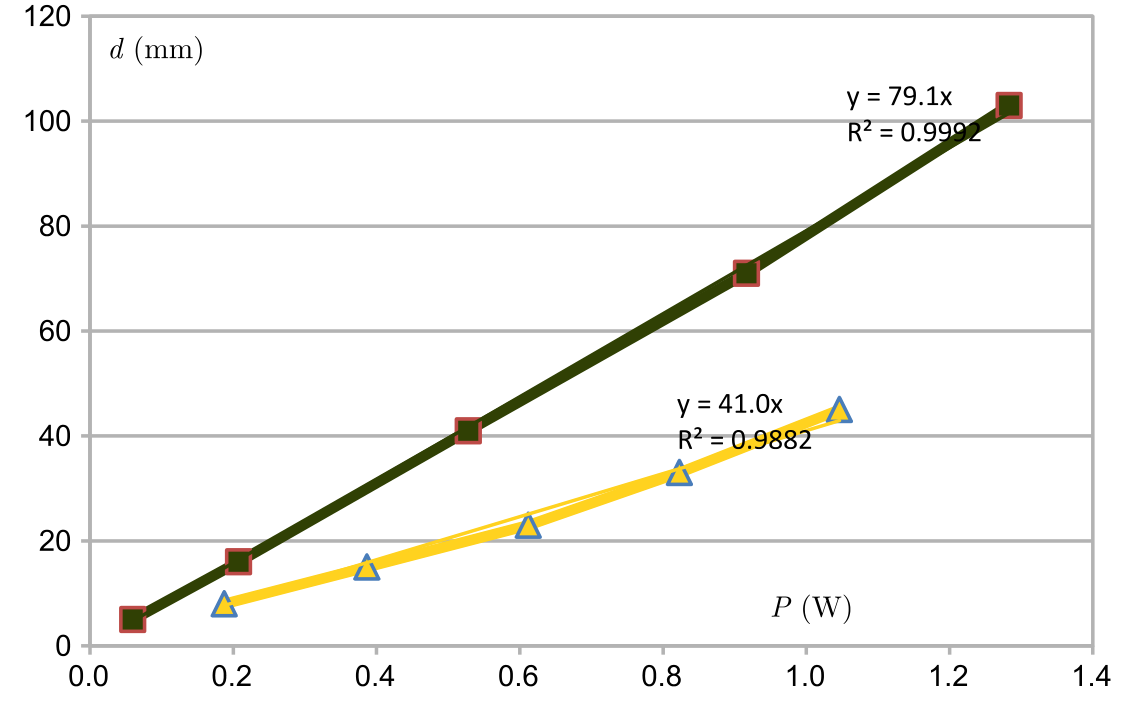
Thermal equilibrium inside the bottles is reached relatively slowly, one must wait approximately for 5-10 minutes. Therefore, finding the state when the heat dissipation powers on the diode and on the resistor are equal may be a relatively slow process. An alternative approach is to assume that the heat exchange rate with the surrounding to be linear in temperature (this assumption is well-founded as the diode never becomes very hot). Then we can make two series of measurements for the pressure inside the bottle as a function of electrical consumption power: first, when the current is driven through the diode, and second, when it is driven through the resistor, . Fitting the data to a linear law, , we obtain the values of the proportionality coefficient both for the diode () and for the resistor (); then, . Note that since the pressure is proportional to the column height difference, we can express the pressure in terms of the height of water column: the proportionality factor cancels out from the ratio.
Measurement data are given in the table below; , , , and refer to the measured current, voltage, power, and water column height difference, respectively; index “L” refers to the measurements with a diode, and “R” — to the measurements with a resistor.
| 101.5 | 1.85 | 0.1878 | 8 | 101.9 | 0.585 | 0.0596 | 5 |
| 198.2 | 1.95 | 0.3865 | 15 | 190.1 | 1.09 | 0.2072 | 16 |
| 300 | 2.04 | 0.6120 | 23 | 300 | 1.76 | 0.5280 | 41 |
| 390 | 2.11 | 0.8229 | 33 | 390 | 2.35 | 0.9165 | 71 |
| 480 | 2.18 | 1.0464 | 45 | 470 | 2.73 | 1.2831 | 103 |
Based on these slopes
Note that it is also possible to measure the efficiency using the temperature sensor: it works in the same way as the method using air expansion described above. We compare temperature of the circuit board as function of electrical power supplied to the diode [], and also the temperature when power is supplied to the resistor []. Assuming that dominating part of the heat is dissipated into surroundings via the circuit board and only a negligible part of it leaves as a heat radiation at the diode and resistor, respectively (this is an assumption which is valid with a really good accuracy), we can find , or even better, , where and denote the slopes of the respective graphs. The result is the same as shown above, . It is also possible to calculate the internal efficiency of the junction by subtracting the power dissipation on the parasitic resistance; the result is .
Task 3. According to our model, the photocurrent does not depend on the voltage, but because the diode current does, the total current through the diode depends on the voltage. For the maximum harvestable electrical power we must find a voltage where is the greatest.
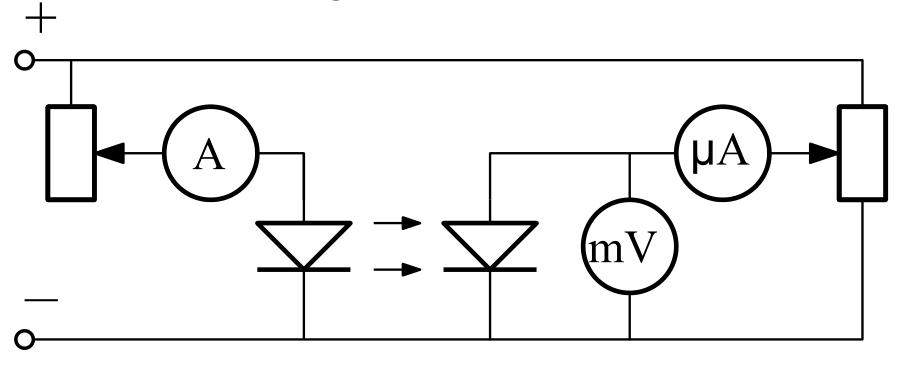
We can do it in multiple ways. One way is to measure the by shorting the diode with a am-meter, and then finding the maximum analytically or numerically from our model. Using the diode parameters from above we get . Other way is to change the voltage on the diode with potentiometer, measure the current and the voltage and find the maximum by scanning the range where current and voltage are positive, see the circuit below.
The data of measurements are given in the table below; the graph shows both the experimental data points and theoretical dependence , where , determined using the measurement at . As we can see, the two curves are fairly close; there is a small mismatch which can partly explained by a leakage current due to a certain large effective resistance being connected in parallel to the diode’s junction.
| (V) | (A) | (W) |
|---|---|---|
| 0 | -15 | 0 |
| 0.18 | -14.8 | 2.664 |
| 0.4 | -14.7 | 5.88 |
| 0.6 | -14.6 | 8.76 |
| 0.8 | -14.5 | 11.6 |
| 0.99 | -14.5 | 14.355 |
| 1.2 | -14.2 | 17.04 |
| 1.3 | -12.8 | 16.64 |
| 1.35 | -11.3 | 15.255 |
| 1.4 | -6 | 8.4 |
| 1.43 | -0.5 | 0.715 |
| 1.46 | 8.6 | -12.556 |
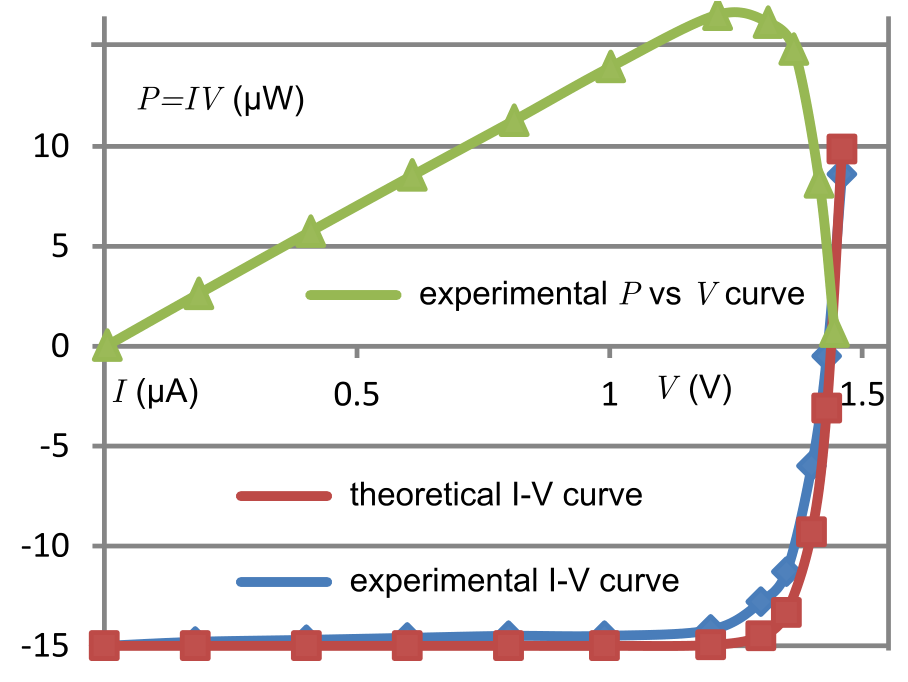
The graph includes also the curve for the electrical power produced by the diode, . The maximum can be determined as the maximum of this curve. The efficiency is found as
where is fraction of the light reaching the active area of the LED; and denote the voltage and current of the other diode, respectively. Numerically we obtain .
Оригинал в Архива: exp_pr.pdf · официални решения: exp_sol.pdf