EuPhO 2020, Теория — Задача 3. Cat eyes
EuPhO-2020 Online — Theoretical Problems
Условие
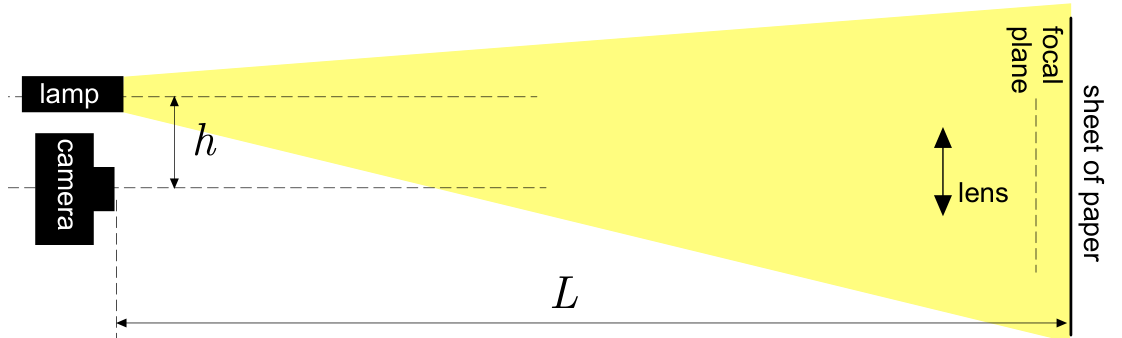
You may have noticed that in darkness, when a cat is within the light beam of a headlamp, its eyes appear very bright, see the photo below (left). This phenomenon can be modelled by a lens setup, see the photo on right, and the diagram beneath the photos.
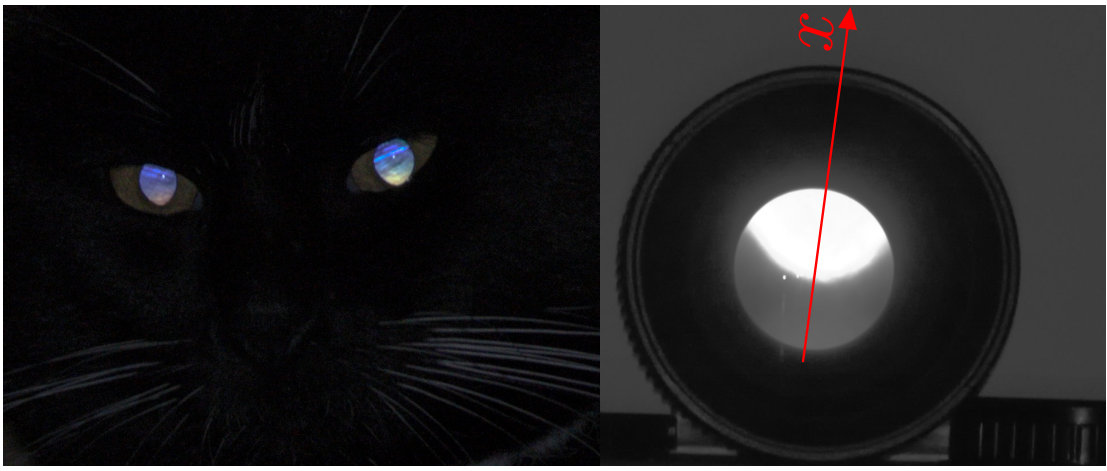
The photo on right was taken by a digital single-lens reflex camera. The light intensity at the camera sensor pixels marked by a red line (in the photo) is shown in the graph below: the log base 10 of the light intensity (measured as the number of photons caught by each pixel) is plotted against the -coordinate, with the pixels’ side length serving as the unit length.
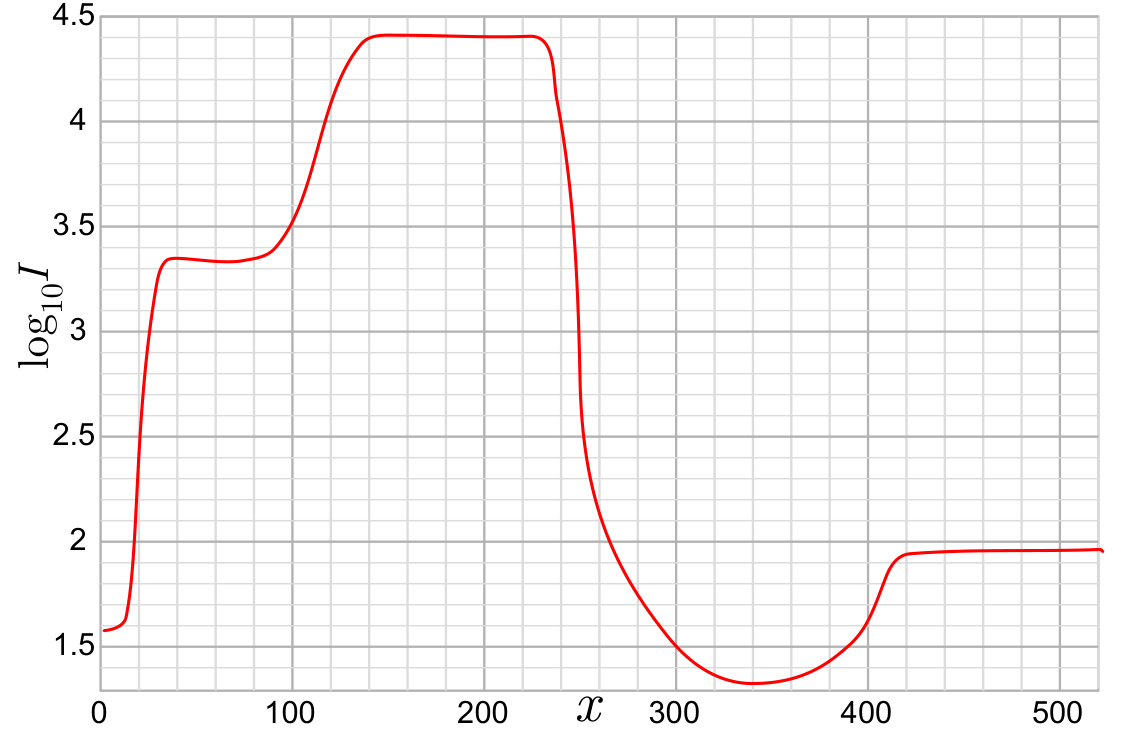
The lens modelling cat eyes can be treated as an ideal thin lens of focal length and diameter ; however, you should keep in mind that the given graph shows real measurement data, and the lens has certain non-ideal features. Most importantly, partial reflections of brightly lit areas from the lens surfaces may decrease the contrast: dark areas seen through the lens appear less dark than they actually are; this effect can be neglected for the camera lens, but not so for the lens serving as a model of a cat’s eye.
Based on the given data, estimate (with the accuracy of ca 20%) the distance between the axis of the camera and the axis of the lamp (which can be considered as a point source) if the distance of the camera from the paper sheet was .
Отговори
80 mm
Official solution: h ≈ 80 mm; the problem asks for an estimate with accuracy of ca 20%.
Решение
When you look at the photo of the lens and/or the graph provided, four regions with different brightness levels can be distinguished. The brightest region represents the magnified image of the blur spot created by the lamp through the lens. The blur spot is created because the distance from the lens to the white sheet beneath it is slightly larger than the focal distance; as we can see from the graph, the blur spot is of almost constant brightness (a flat plateau at ), so we can say that the entire luminous flux falling from the lamp onto the lens is distributed evenly over the blur spot. Note that the blur spot has no sharp edges, though, as you would expect from in such case. This is because the image of this bright disc is situated between the lens and the camera, and is at a fairly big distance away from the plane which is sharp at the image sensor (as seen from the photo, the camera is focused onto the lens). Because of that, the enlarged image of the blur spot has blurred edges in the photo (at the blurred edges, varies from 3.4 to 4.4). The second-brightest region (with ) represents the scattered light from the brightest region: in that region, we are still looking through the lens, and see the area next to the bright blur spot on the sheet. Ideally, its should be darker than the sheet seen in those places where it is not obstructed by the lens, because the lens is shading the light from the lamp. However, the glass elements of this big lens are non-ideal (and there are many glass elements inside the lens!), so the light from the lamp and the bright blur spot is scattered towards the camera giving rise to an increased apparent brightness. In the area where we see the blur spot, this light is insignificant (much weaker than the light from the blur spot), but not so in this dark area: here, the scattered-from-the-glass-surfaces dominates heavily over the light coming from the paper sheet. As a matter of fact, this fact could be used to improve the accuracy of the calculations: we could subtract the contribution of the scattered light () from the total intensity of the light at the brightest spot () to obtain the contribution coming from the blur spot on the sheet. The darkest regions (with ) represent the interior black painting of the lens seen through the big front glass element of the lens, which absorbs most of the incident light, and the region with and represents the white sheet illuminated by the lamp. The ratio between the measured light intensity of the brightest region and that of the region with can be utilized to find the distance of the sheet (the blur spot) from the lens to the paper sheet , see below.
From the data given in the problem text we know that ; from the photo of the lens, it is also clear that is of the same order of magnitude as . Because of that, the illuminance (luminous flux per unit area) near the lens can be assumed to be the same as at the paper sheet, The luminous flux per solid angle and unit area of a light-scattering (or radiating) surface is called the luminance ; since all these directions under which the scattered light enters the lens aperture are close to the surface normal, we may assume the luminance of the paper sheet to be constant over all these directions. With the small angle approximation, the light intensity (illuminance, luminous flux per unit area) at the camera sensor is proportional to (see Explanation 1).
The luminance of the blur spot on the sheet is larger than the luminance of the paper sheet, where equals the ratio between the area of the bright dot (the blur spot) on the paper sheet and the area of the lens, because all the light received by the lens is “compressed” into the tiny blur spot.
Small angle approximation is also used to show that luminance of the image of the blur spot equals to the luminance of the blur spot (see Explanation 2). Therefore, the light intensity at the sensor cells corresponding to the brightest area (where we see the image of the blur spot) , where stands for the intensity at the cells corresponding to unobscured paper sheet. So, from the graph, we can deduce the value of , and knowing we can calculate . Let the distance along the axis between the image of the bright region through the lens and the lens itself be denoted as ; according to the Newton’s lens formula, . Hence,
can be also determined.
Hypothesize that . Let us calculate the diameter of the image of the blur spot
where the diameter of the blur spot on the sheet
and denotes the distance of the image of the point source from the focal plane. Using Newton’s lens formula, , This leads us to
and therefore
Keeping in mind that , we obtain
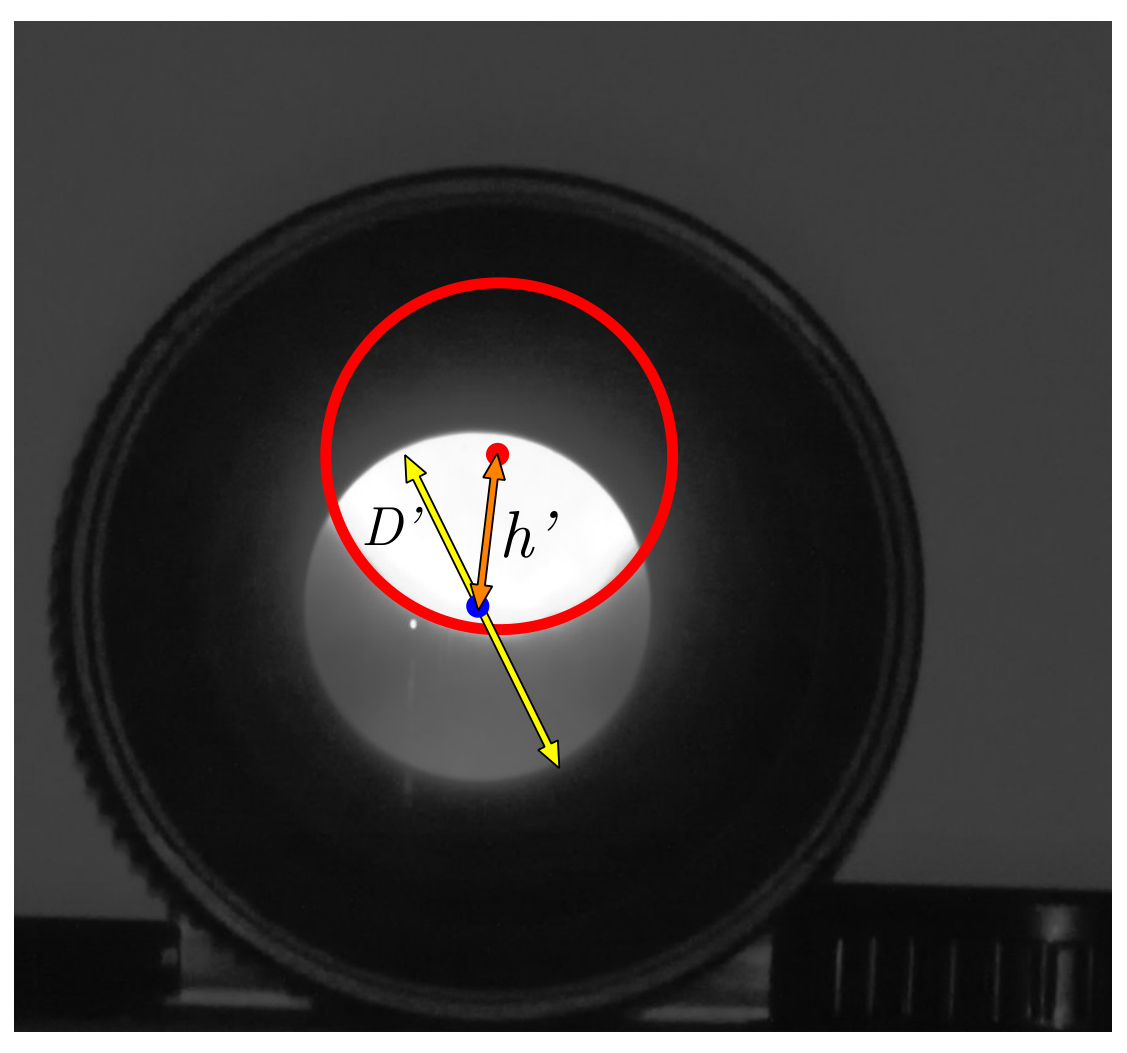
This means that as seen from the position of the camera, the angular size of the image of the blur spot equals to the angular size of the lens aperture . This fact is easily confirmed from the photo and is an important observation for two reasons. First, it means that based on the angular diameter of the image of the blur spot on the photo, it is impossible to figure out the distance (and hence, ). Second, it allows us to measure instead of the angular distance between the centre of the lens and the centre of the image of the blur spot (as seen from the position of the cameraline), the respective distance between the edges of the respective circles. Equality of these two angular sizes is also easily seen from the geometric construction, see the figure. Indeed, consider blue lines and which arrive from the lamp to the edges of the blur spot. Image of point , denoted by , is now easily found as the intersection point of the ray with the ray (passing through the centre of the lens); image of the other edge of the blur spot is found in the same way. From this construction, it becomes clear that the angular size of the image of the blur spot and the lens, as seen from the camera, are exactly equal, without any approximation. Due to the smallness of the distance , these angular sizes remain almost constant when the observation point is moved from to .
Given the images are approximately circular, the area ratio equals , or
In the above equation, the sign represents the two cases where the paper sheet is behind or in front of the image of the lamp. From the graph, the ratio between the intensity of the brightest region and the dark region with is , which equals . Then, can be found to be , which gives two solutions and . According to the experimental settings given in the problem text, is greater than , and thus we obtain and . This also verifies the hypothesis that .
The centre of the image of the blur spot is positioned at the height above the direction to the centre of the lens (this expression from similarity of the triangles and ) which means that ; meanwhile, the angular diameter of the lens . Therefore,
The ratio of the angular distances is easily measured from the figure as the ratio of the width of the crescent-shaped second-brightest region to the diameter of the lense’s aperture :
Based on the graph, pixels (midpoint of the blurry edge is around , and the left edge of the aperture (in the graph) is at ; the right edge of the lens aperture is at corresponding to and yielding .
Remark 1. In order to obtain the final answer with a reasonably good accuracy, it is not strictly speaking necessary to show that the apparent angular diameters of the lens and of the image of the blur spot are equal. All the other calculations remain the same, just one needs to match a circle with the circular segment of the visible edge of the blur spot, and measure directly , the distance between the centre of the lens and the centre of the blur spot, together with the diameter of the lens aperture (see the small figure).
Remark 2. The width of the crescent-shaped second-brightest area can be also measured from the photo of the lens with the required accuracy; however, measuring in pixels from the graph is more accurate.
Explanation 1: Consider a small light source of luminance and surface area at a large distance from the camera. The illuminance (the luminous flux per unit area) at the position of the camera is proportional to and so is the total luminous flux received by the whole sensor. Meanwhile, all this light energy is focused onto a small area on the sensor — onto the image of the light source, and this area is also proportional to . Therefore, the illuminance at the position of those sensor pixels which are covered by the image is independent of the distance .
Explanation 2: Consider a very narrow cone of light of solid angle , starting from a very small area at the blur spot in a direction close to the surface normal, and carrying a total luminous flux . Since the cone is narrow, this light beam is entirely caught by the lens at distance , and focused onto the image of surface area at distance from the lens. The light rays of this beam traverse the focus and form another light cone of solid angle departing from the image. It is easy to see from similar triangles that . Then, the luminance of the image , i.e. equal to the luminance of the blur spot.
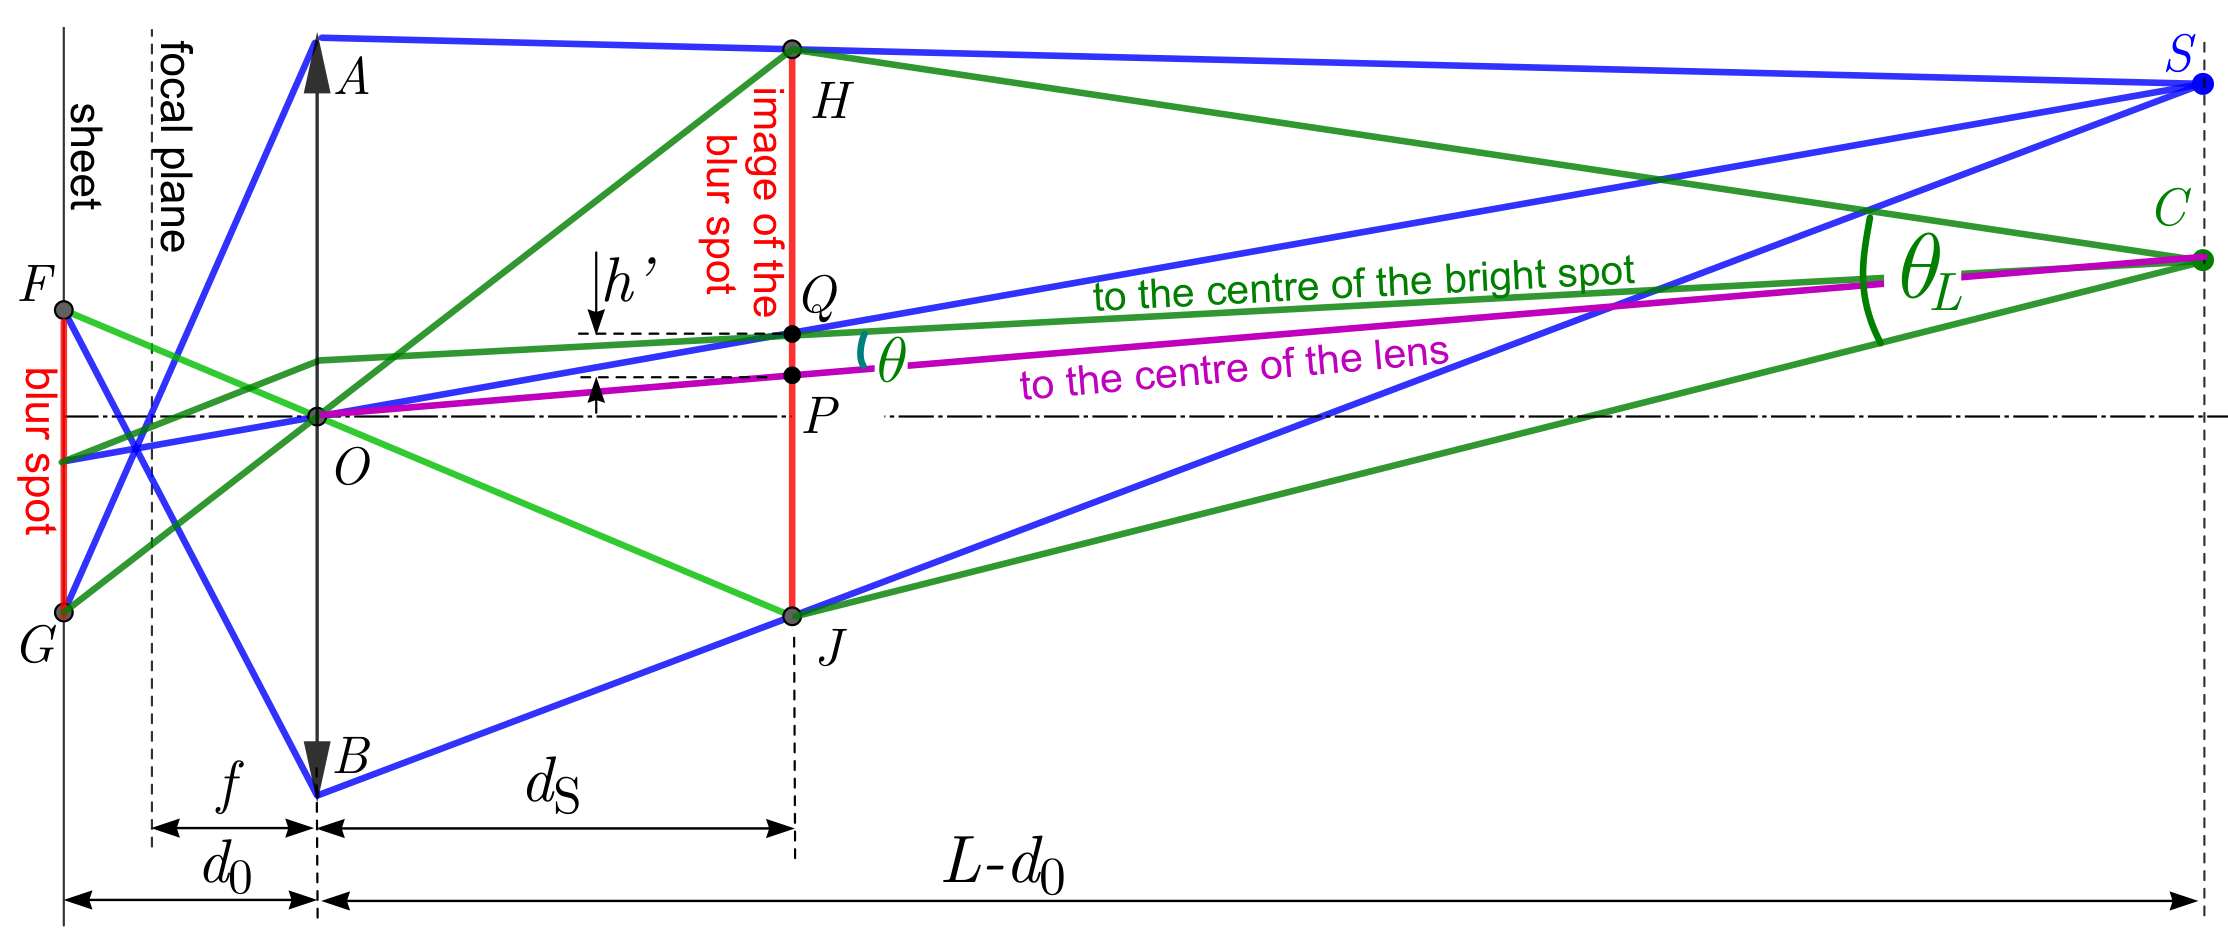
Remark 3: After having derived Explanation 1 and Explanation 2 and calculated , the geometrical optics aspect can also be tackled by considering the image of the camera through the lens. The region bounded by the darkest ring in the image represents the area on the paper sheet that is observable by the camera through the lens. This area can be approximated by a circular spot with diameter (represented by in the graph) depending negligibly on the size of the lens of the camera. Given small angles and that the lamp and the camera have equal distances to the lens, the bright spot on the paper sheet also has a diameter of , which means . The angular distance between the lamp and the camera as seen from the center of the lens is , and therefore, the distances between the two spots’ centers, and also thus their boundaries (represented by in the graph), on the paper sheet are . We then obtain an equivalent equation to that above:
It should be noted that, compared to the original analysis, the deviation in this calculation caused by (in finding and ) on the final result reduces drastically (from approximately 20% down to approximately 1%). Even if is assumed, the result is only deviated by approximately 7%.
| Grading scheme: T3 | |
|---|---|
| Understanding that the brightest spot is the magnified image of the blur spot through the lens (by explicitly stated or shown in a diagram or implicitly assumed in a correct full solution). Otherwise, a partial score of 1.0 p is given for understanding that the brightest spot is caused by light scattered from the blur spot. A partial score of 2.0 p is given for understanding that the brightest spot is caused by light scattered from the blur spot and that the light passes once more through the lens before reaching the camera. | 2.5 p |
| Understanding that the region on the graph with represents the unobscured paper sheet (0.2 p). Finding the ratio of the intensities at the brightest area and at the unobscured paper sheet (or its reciprocal or its logarithm) from the graph (0.8 p). Subtract 0.2 p if the mistake in taking the reading for is more than 0.05 but less than 0.1 and subtract 0.4 p if the mistake is bigger than 0.1. | 1.0 p |
| Expressing correctly in terms of the ratio of the distances (either or or anything equivalent). Partial score of 2 p if initial expressions are correct, but final expression of a ratio of distances is not obtained. These 2 p are distributed in this way: 0.5 p for showing that equals the ratio of the luminances of the paper sheet and the image of the blur spot, 0.5 p for showing that the luminance of the image of the blur spot equals the luminance of the blur spot itself; 0.4 p, 0.3 p, and 0.3 p for the thin lens equation, the expression of in terms of the diameters and the expression of the diameters in terms of the relevant distances, respectively. Subtract 0.5 p if the original direction is used and is neglected as compared to (either in the initial set-up or during simplifications). | 2.5 p |
| Relating correctly ratio of distances measurable either on the graph or on the photo to . Partial score of 1.5 p if initial expressions are correct, but the final expression for a ratio of distances is not obtained or is incorrect. These points are distributed as follows: 0.3 p for the thin lens equation for the image of the blur spot (or for the image of the camera if alternative approach is used); 0.4 p for showing that ; 0.4 p for a single relevant equation that relates to other distances; 0.4 p for a single relevant equation that relates a ratio of measurable distances to other distances in the system. Partial score of 1.0 p if initial expressions are not correct, but a diagram is drawn which shows the measurable-from-the-figures distances, together with other related distances, in a correct way. | 2.0 p |
| Measuring these distances with a reasonable accuracy (only if the previous subscore is not 0). Partial score of 0.5 p if a relative mistake made in the range of 20% to 30%, and 0.8 p if in the range of 10% to 20% | 1.0 p |
| Obtaining final answer with a reasonable accuracy. Partial score of 0.5 p if final formula is derived but not calculated numerically. Subtract 0.5 p if calculation mistake is made and subtract 0.2 p for rounding the result more than by 10% | 1.0 p |
Оригинал в Архива: EuPhO_2020_Theory.pdf · официални решения: EuPhO20_Theory_Solutions-7.pdf