GPhO 2019, Експеримент — Задача 1. Problem E1. Magnetic properties of matter
The 3rd Gulf Physics Olympiad — Experimental Competition. Muscat, Oman — October 8th 2019 · 8 октомври 2019 г. · 20 т.
Корица
- The examination lasts for 5 hours. There is one problem worth in total 20 points.
- Initially the experimental equipment on one table is covered. You must neither remove the cover nor open the envelope with the problems before the sound signal of the beginning of competition.
- You are not allowed to leave your working place without permission. If you need any assistance (malfunctioning equipment, broken calculator, need to visit a restroom, etc), please raise and keep your hand raised until an organizer arrives.
- Use only the front side of the sheets of paper.
- For each problem, there are dedicated Solution Sheets (see header for the number and pictogramme). Write your solutions onto the appropriate Solution Sheets. For each Problem, the Solution Sheets are numbered; use the sheets according to the enumeration. Always mark which Problem Part and Question you are dealing with. Copy the final answers into the appropriate boxes of the Answer Sheets. There are also Draft papers; use these for writing things which you don’t want to be graded. If you have written something what you don’t want to be graded onto the Solution Sheets (such as initial and incorrect solutions), cross these out.
- If you need more paper for a certain problem, please raise your hand and tell an organizer the problem number; you are given two Solution sheets (you can do this more than once).
- You should use as little text as possible: try to explain your solution mainly with equations, numbers, symbols and diagrams. Though in some places textual explanation may be unavoidable.
- After the signal signifying the end of examination you must stop writing immediately. Put all the papers into the envelope at your desk. You are not allowed to take any sheet of paper out of the room. If you have finished solving before the final sound signal, please raise your hand.
Error analysis
In what follows, any time errors of the mean of tabulated data are calculated, standard deviation is used. Assuming there are data points of the form , , the mean is
and the standard deviation of the mean
For error propagation through equations, Pythagoran rule for adding errors in quadrature is used (alternatively, one could use min-max but for lower accuracy). In general, when you have a variable be a function of variables , with errors , then the error of is given by
Any time the methods used in finding the errors is not specified, of the marks for error analysis are to be deducted.
Условие
The aim of this experiment is to measure magnetism-related characteristics of dia- and ferromagnetic materials. To reach this goal, some other measurements are also required — e.g. measuring the diameter of the syringe needle, and the coefficient of surface tension of water.
Equipment
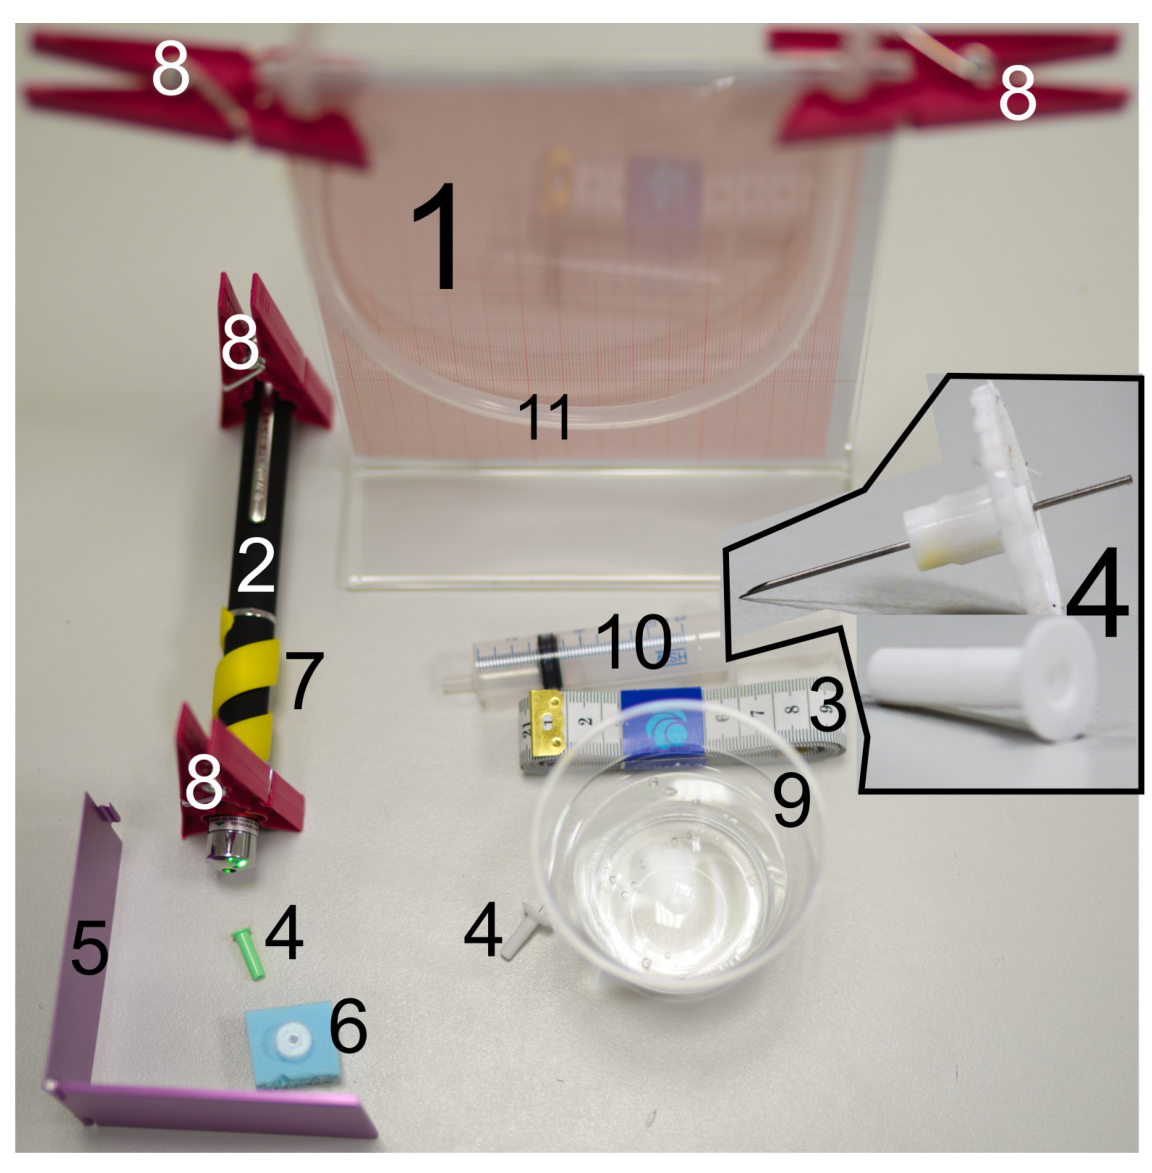
The following equipment is listed in figure 1:
1 — a stand;
2 — green laser pointer
3 — a measuring tape;
4 — green and white syringe needles, one end of the needle is sharp, and the other end is cut perpendicularly to its axis, see the insert in fig 1
5 — a foldable mirror
6 — a piece of foam
7 — a spiral plastic fixator that keeps the laser pointer button pressed;
8 — clothespins;
9 — a cup with water;
10 — a syringe;
11 — a silicone tube,
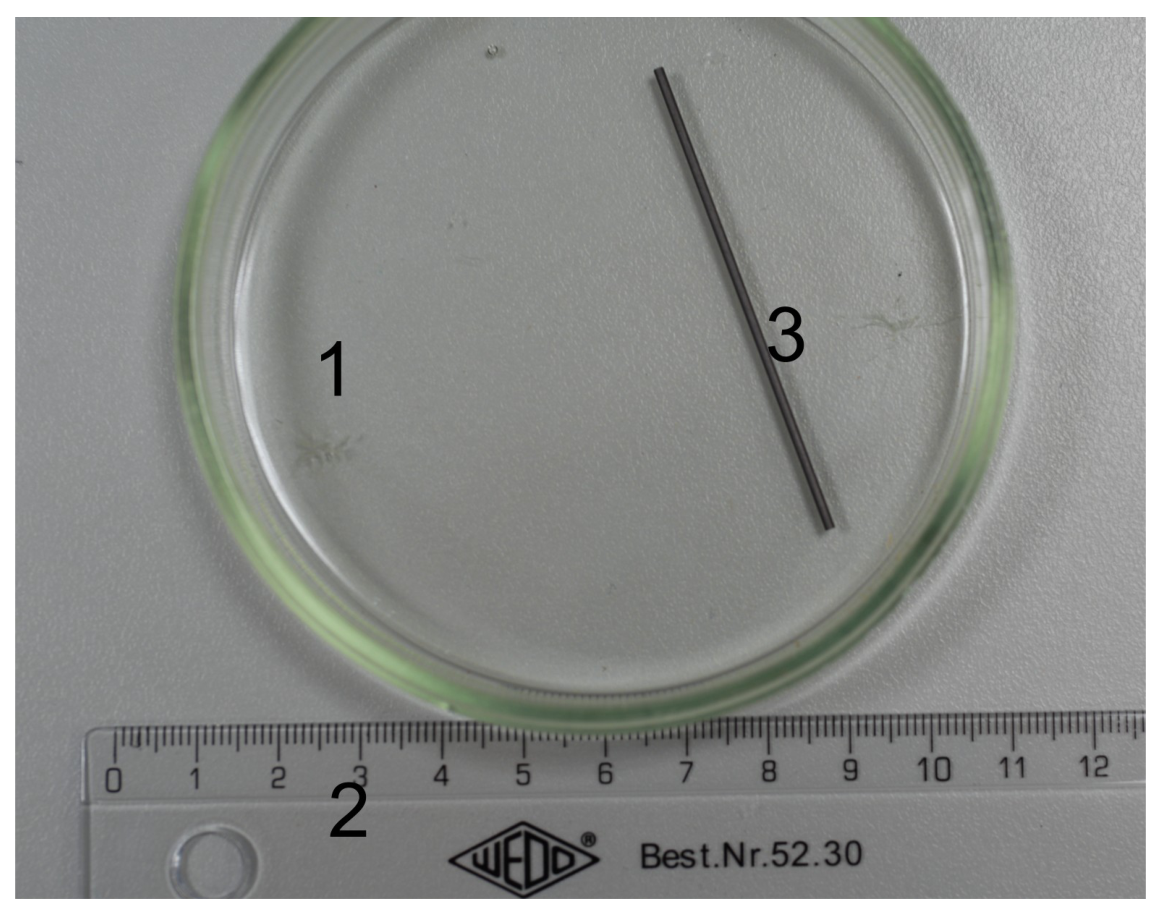
The following equipment is listed in figure 2:
1 — a Petri dish;
2 — a ruler;
3 — a graphite bar.
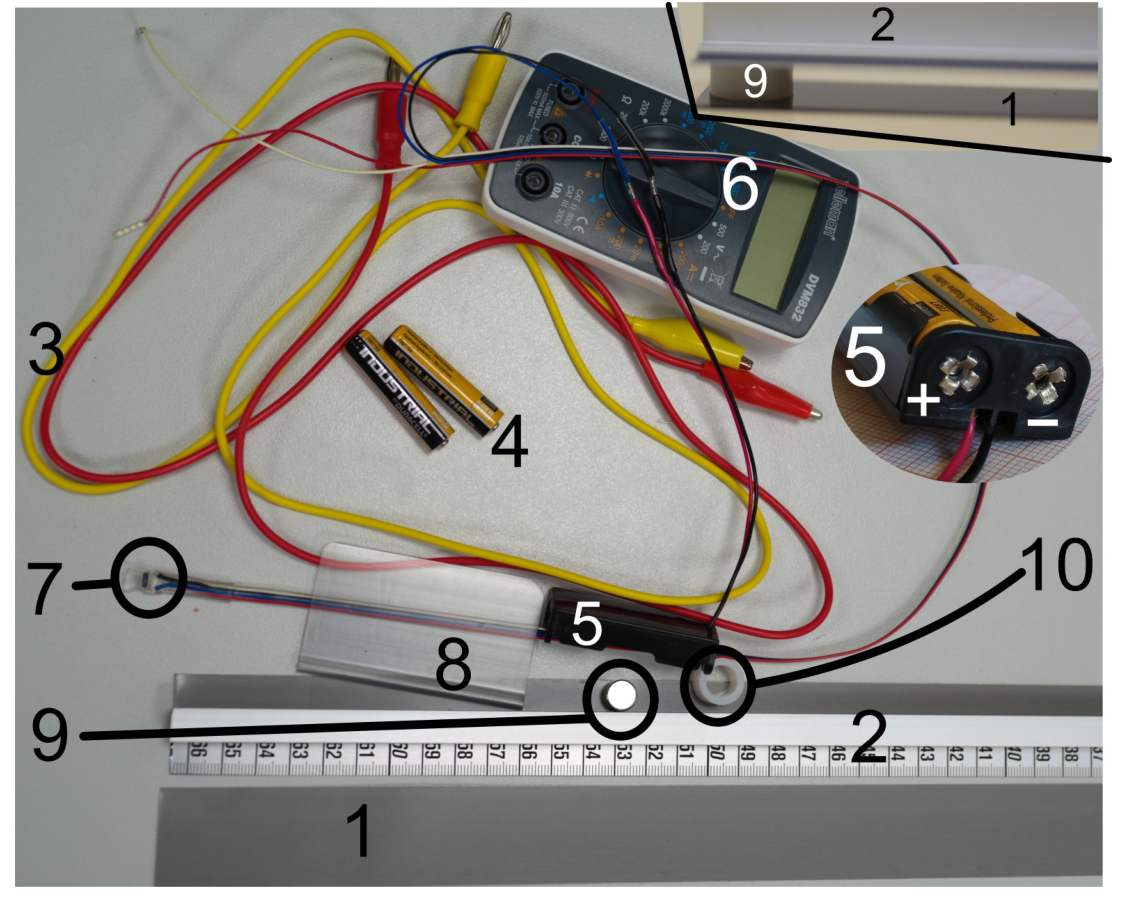
The following equipment is listed in figure 3:
1 — a stand-alone ferromagnetic strip;
2 — a ferromagnetic strip reinforced with an aluminium bar and equipped with a measuring tape;
3 — wires with crocodile clips;
4 — batteries;
5 — a battery holder;
6 — a multimeter;
7 — a resistive magnetic field sensor;
8 — a plastic clamp for fixing the orientation of the sensor;
9 — a magnet;
10 — a plastic spacer to keep the strip (2) strictly horizontal.
Not shown in the figures: a piece of polyethylene film for wrapping the magnet.
WARNINGS:
- Do not bend the ferromagnet, as it will become unusable! If bent, no replacement will be provided and you will get no marks for that part.
- Avoid direct or reflected laser beams hitting your eye, this can be harmful to your eye!
- The syringe needles are sharp, avoid puncturing yourself!
- Avoid short-circuiting the battery leads — the battery will overheat and become unusable!
- Power off the multimeter and the laser when not in use, in order to conserve the batteries.
Tasks
Part A. Diameter of the syringe needle Determine the diameter of the syringe needles using the following procedure.
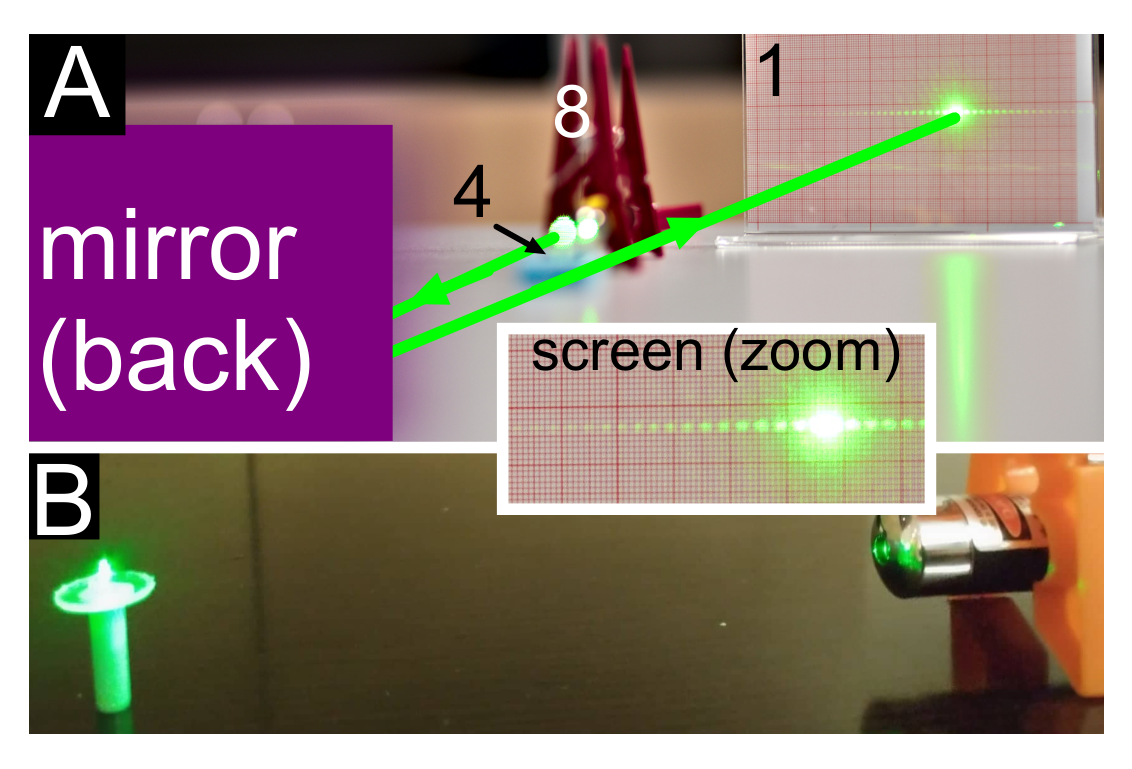
Put the syringe standing vertically onto table, with its plastic cap downside as shown in Fig 4B, install the laser with the help of the clothespins as shown in the figure, and direct the laser beam onto the needle. If the laser beam is too high (i.e. passes the needle above it), you may use the piece of foam as shown in Fig 4A (insert the sharp end of the green syringe needle into the foam so that it will stand vertically). If the laser beam is slightly too low, you may use a folded sheet of paper to raise it. If the laser runs out of battery, you may ask for a replacement. Use the mirror to increase the length of the laser beam (see Fig 4A). Measure the distance between diffraction maxima on the screen as precisely as possible (explain how you achieved the best possible accuracy). Measure the length of the light beam from the syringe needle to the screen and calculate the diameter of the needle. Wavelength of the laser beam is .
Estimate the uncertainty of your result. Repeat the procedure with the white needle. [3 т.]
Part B. Surface tension of water Fill the silicon tube with water — you may use the syringe (do not use the needle!) so that approximately 2/3rd of it is filled with water (adjust the amount of water as needed later); make sure that the water forms a continuous column with no air gaps. Using clamps, fix the tube from its two ends to the screen (which is now used as a stand). Insert the green syringe needle into the tube by puncturing it with the sharp end of the needle. Make sure to puncture the tube perpendicularly near its centre, so that the flat end of the needle will point vertically downwards. Depending on the height of the water column above the open end of the needle, water may or may not start slowly dripping out. If it does not drip, lower the needle by pulling the tube from its middle part downwards so that it will start approaching a V-shape. If water still does not start dripping, add more water into the tube (if even this is not enough, ask for a replacement needle).
While the water is slowly dripping from the needle, raise very slowly the needle to determine, at which height will the dripping stop, and measure the corresponding water column height (the height difference between the water level in the tube, and the lowest point of the needle).
Hint: when the tube is hanging in a U-shaped manner, the height of the water column can be adjusted by pulling the tube from its middle point into a V-shape, or raising it into a W-shape.
Make several measurements with the green needle, and repeat the whole procedure with the white needle. State your results for the critical water column heights together with the uncertainties, for the both needles. Based on your measurements, determine the coefficient of surface tension for water, alongside its uncertainty. Density of water is , free fall acceleration .
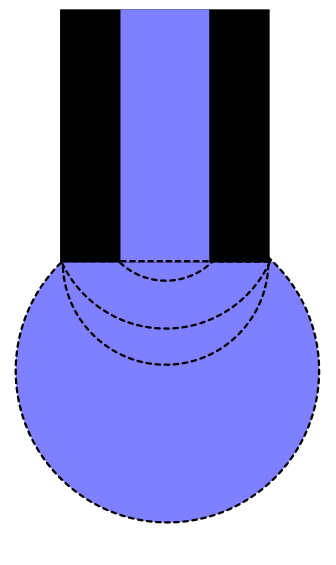
Hints: different stages of the droplet growing from the end of the syringe needle are shown in Fig 5. Surface tension gives rise to a pressure drop over a curved water surface; in the case of a spherical surface, this pressure drop equals to , where is the radius of the spherical surface. [4 т.]
Part C. Susceptibility of graphite Measure the diameter of the magnet and write down the result.
Fill the Petri dish with water so that the water layer depth is approximately half of the dish height. Break a tiny piece from the graphite bar and put it onto the water; it should remain floating owing to surface tension.
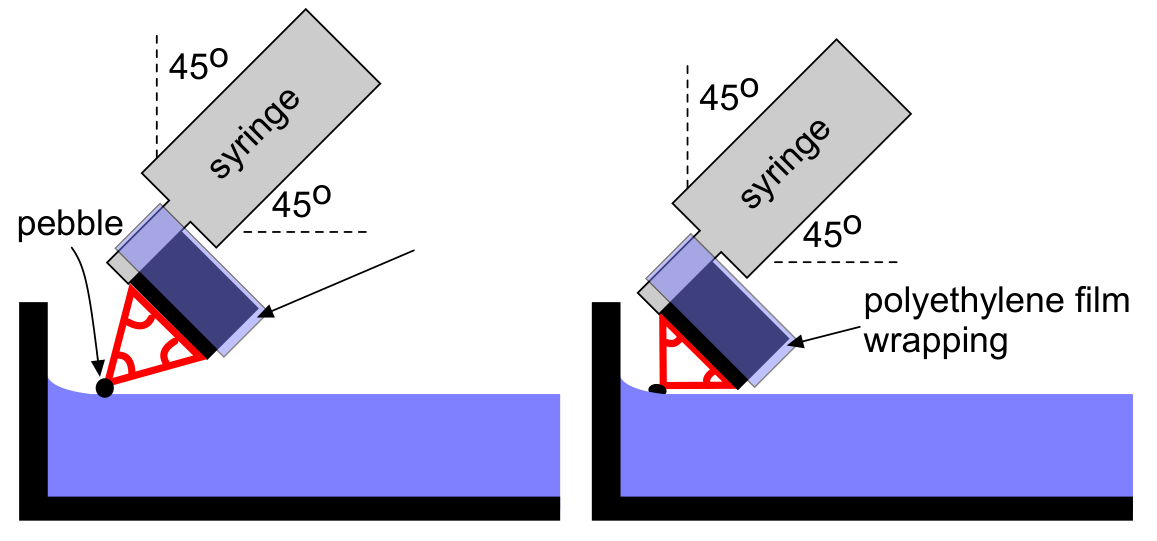
Fix the magnet to the syringe as shown in Fig. 6 (magnet’s axis should be parallel to the syringe) with the help of a piece of the polyethylene film. Orient the magnet approximately under 45 degrees to the horizon (so that the angle between the syringe and vertical direction equals approximately to the angle between the syringe and the horizontal plane). When you move the magnet closer to the piece of graphite, it will “swim” away due to diamagnetism. Push it towards a wall of the Petri dish. When the magnet is not too far away from the wall, for each position of the magnet, there is an equilibrium position of the graphite pebble. You need to achieve two different equilibrium configurations: (a) the magnet’s diameter and the graphite pebble form approximately an equilateral triangle; (b) the magnet’s diameter and the graphite pebble form approximately an isosceles right triangle, see Fig. 6.
Using the ruler, measure the distance between the pebble and the wall of the dish for the both configurations; repeat measurements several time to reduce uncertainty.
The pushing force exerted on the graphite pebble per unit mass of the pebble is given by the formula
where and are the specific susceptibilities of the graphite and of the water (per unit mass of the material), and denotes the magnetic pressure gradient.
Fig. 7 shows the water surface slope angle as a function of the horizontal displacement from the vertical wall of the dish, normalized to the characteristic length scale . Here is the density of water, and is the free fall acceleration. The graphite pebble will rest at very small angles so that the approximation can be used.
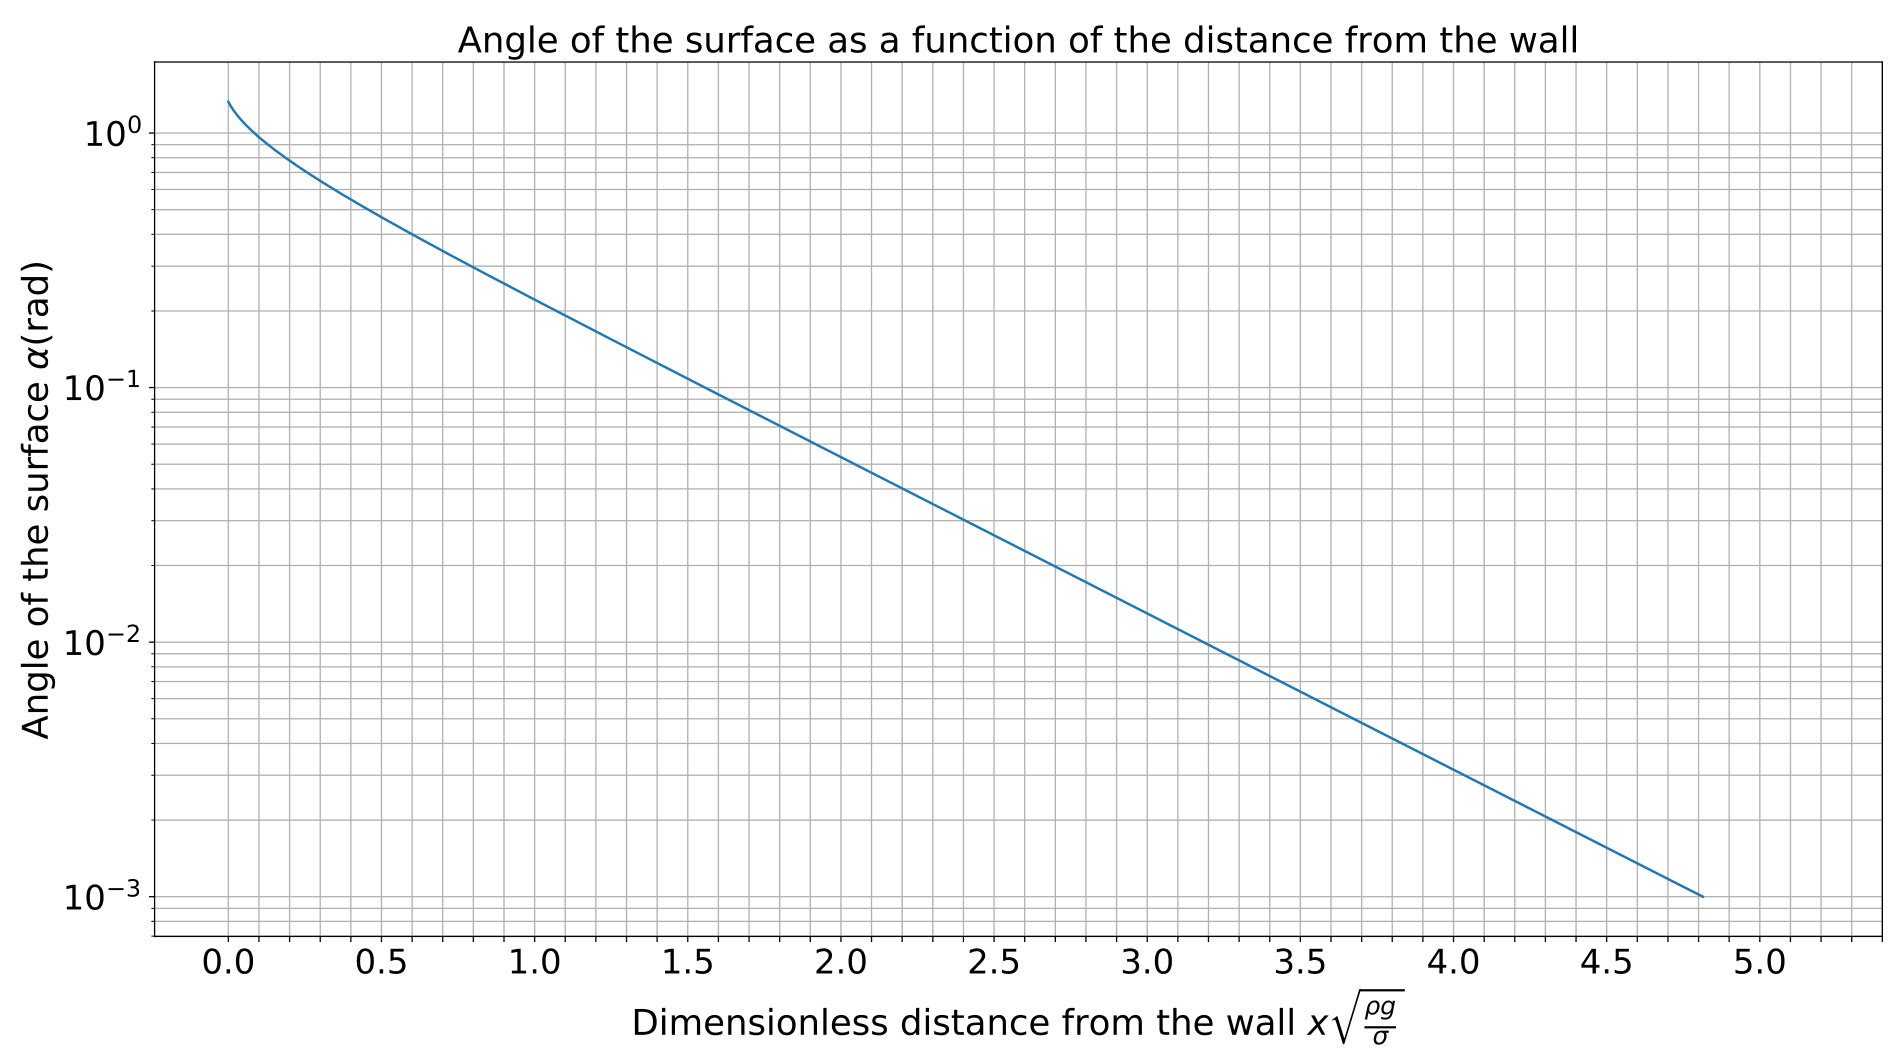
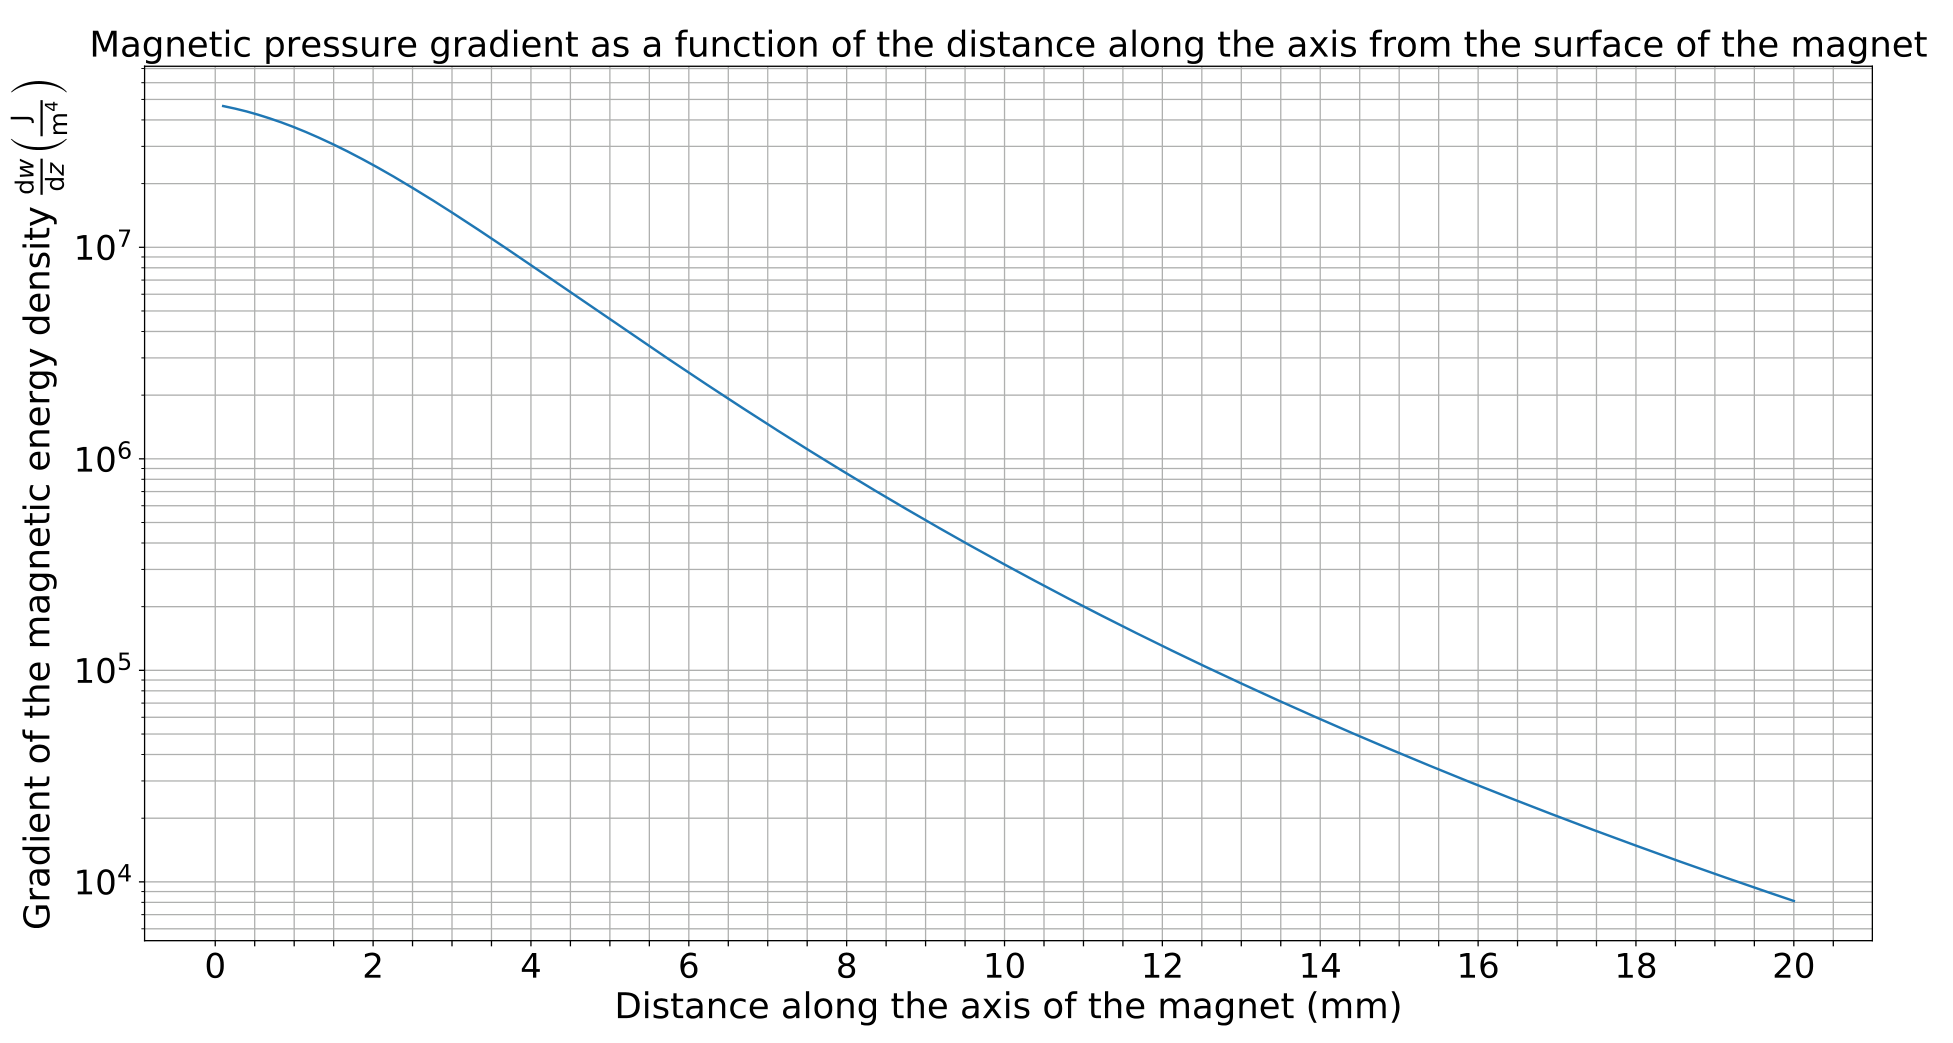
Fig. 8 shows the magnetic pressure gradient at the magnet’s axis as a function of distance from the flat face of the given permanent magnet.
Based on these data and your measurements from before, determine and estimate its uncertainty. [4 т.]
Part D. Relative permeability of ferromagnetic strip i. (1 pt) Measure the voltage on the output leads of the battery holder using the multimeter by connecting multimeter to the leads shown as “+” and “−” in the insert of Fig 3 and switching it to 20 volt (DC) range. If the voltage is below , you may ask for replacement batteries.
Connect the blue and black wires of the magnetic sensor to the batteries in the battery holder, and the red and white wires to the multimeter. If the plastic clamp is put around the four wires near the sensor as shown if Fig 3, the sensor is kept in such a position that vertical magnetic field will be measured. Switch on the multimeter in 200 millivolt (DC) range, put the sensor onto table far away from the magnet and the ferromagnetic strips, take the reading of the multimeter , and write it down. Subtract this voltage reading from all the subsequent readings (to compensate for the zero offset of the sensor, and for the magnetic field of the Earth).
ii. (4 pts) If the battery voltage were to be exactly , each millivolt in the reading would correspond to 10 microteslas of the magnetic field strength. However, the reading is proportional to the battery voltage.
Put the stand-alone ferromagnetic strip onto table; place the magnet and the plastic cylindrical spacer onto it, as close as possible to its endpoints (see the insert of Fig 3), and the reinforced strip onto the whole assembly so that a gap of constant width is formed between the strips. Measure the magnetic field strength between the two strips as a function of distance from the magnet-less end of the strips. Start with the farthest possible position from the magnet, with equal to a few millimeters, and use increments. For each distance , move the sensor between the strips horizontally to find the largest possible reading. Tabulate your direct voltage readings together with the corresponding magnetic field strengths.
Theory predicts that in this configuration, the magnetic field between the strips is
where
and the hyperbolic cosine is defined as . Here, stands for the strip thickness and — for the width of the gap between the two strips. This can be measured using a ruler. Based on your measurements data, draw an appropriate graph to determine the relative magnetic permeability . Find and estimate the uncertainty of your result.
Hints: the given expression for fails due to the saturation effect if the magnetic field inside the ferromagnetic strip is too large. Calculators usually do have both cosh-function, as well as its inverse function, denoted as acosh or .
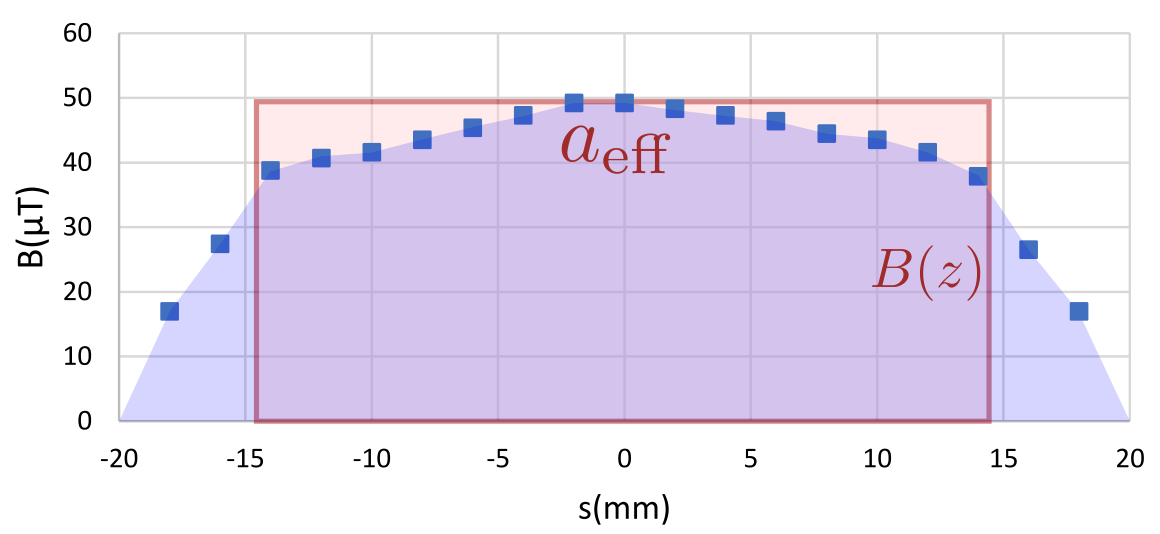
iii. (2 pts) In order to understand how the magnetic flux is distributed over the width of the strip, measure the magnetic field strength as a function of the distance from the symmetry axis of the strip for a certain fixed value of in the middle of its range; use -increments and decrease these increments wherever appropriate. Plot the results. Comment on your results.
iv. (2 pts) Assuming that the distribution of the magnetic flux over the width of the strip is almost independent on , calculate and plot the magnetic field strength inside the ferromagnetic strip as a function of based on your measurement data (you may take additional measurements if needed). Estimate the field strength by which the magnetization of the ferromagnetic material starts becoming saturated. [9 т.]
Отговори
Part A. Diameter of the syringe needle white needle: d = 0.31 mm, Δd = 0.004 mm; green needle: d = 0.24 mm, Δd = 0.005 mm
Official solution values (measured data).
Part B. Surface tension of water 65.2 mN/m
Official solution: σ = 65.2 mN/m, Δσ = 1.3 mN/m (average of the white and green needle results).
Part C. Susceptibility of graphite χg = 6.2 × 10⁻⁸ ± 4 × 10⁻⁸ (printed unit kg/m³)
Official solution final value; the solution prints the unit as kg/m³ (the problem gives specific susceptibility in m³/kg) and a positive value although it states graphite's susceptibility is negative — kept as printed.
Part D. Relative permeability of ferromagnetic strip ℰ = 3.17 V; V₀ = 2 mV; μ = 57 000 ± 3000; Bs ∼ 1.1 T
Official solution values (measured data).
Решение
Part A. Diameter of the syringe needle (3 points)
In order to maximize the accuracy, the path length of the diffracted laser needs to be maximized since that increases the separation of the maxima on the screen. (0.2 pts) A two-fold increase in the path length can be achieved by using a mirror to reflect the laser from one end of the table to the other and then back again. (0.3 pts)
For both needles, the distance from needle to the mirror and from the mirror to the screen were both . The optical path length is then . (0.3 pts)
On the screen, the optical path difference between two neighbouring maxima is , which corresponds to a distance of on the screen, where is the diameter of the syringe needle. In order to increase the accuracy, the measurements should cover as many maxima, as possible. Then the separation is and . (0.4 pts)
For the white needle, following measurements were made:
| (mm) | (mm) | (mm) | ||
|---|---|---|---|---|
| 1 | 22 | 89 | 4.05 | 0.313 |
| 2 | 18 | 74 | 4.11 | 0.308 |
| 3 | 20 | 79 | 3.95 | 0.321 |
1 measurement (0.4/0.6 pts)
2 measurements (0.5/0.6 pts)
3 or more measurements (0.6/0.6 pts)
The average diameter is found to be (0.1 pts) with an error of . (0.2 pts)
For the green needle, following measurements were made:
| (mm) | (mm) | (mm) | ||
|---|---|---|---|---|
| 1 | 18 | 98 | 5.44 | 0.233 |
| 2 | 15 | 76 | 5.07 | 0.250 |
| 3 | 16 | 85 | 5.31 | 0.238 |
1 measurement (0.4/0.6 pts)
2 measurements (0.5/0.6 pts)
3 or more measurements (0.6/0.6 pts)
The average diameter is found to be (0.1 pts) with an error of . (0.2 pts)
Part B. Surface tension of water (4 points)
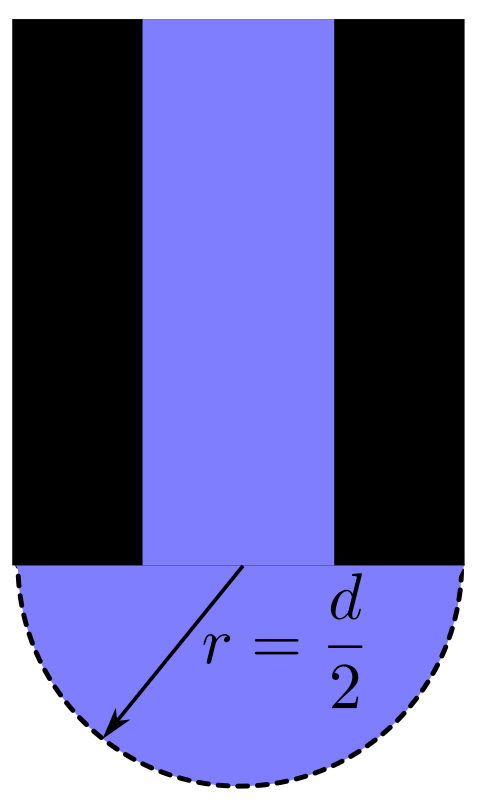
After correctly setting up the equipment and pulling the middle part downwards, the needle should start dripping at one point. This happens because the surface tension isn’t enough to hold back the additional pressure pushing the water down. Note that the critical case is when the radius of curvature of the water drop is the smallest, because then the extra pressure, , is the biggest. This happens when , shown in the figure below. (0.6 pts)
The pressure balance reads
where is the pressure from the water column of height with respect to the needle. If we measure , we can thus express the surface tension as
(0.6 pts)
The following repeated measurements were made for the white needle:
| (mm) | |
|---|---|
| 1 | 84 |
| 2 | 80 |
| 3 | 83 |
| 4 | 82 |
| 5 | 83 |
1 measurement (0.2/0.6 pts)
2-4 measurements (0.4/0.6 pts)
5 or more measurements (0.6/0.6 pts)
The average height is found to be with an error of , and using (1), we get with an error of .
values (0.3 pts)
errors (0.4 pts)
The measurements for the green needle were:
| (mm) | |
|---|---|
| 1 | 114 |
| 2 | 113 |
| 3 | 116 |
| 4 | 112 |
| 5 | 113 |
1 measurement (0.2/0.6 pts)
2-4 measurements (0.4/0.6 pts)
5 or more measurements (0.6/0.6 pts)
The average height is with an error . That gives , and an error of .
values (0.3 pts)
errors (0.4 pts)
The final expression for the surface tension is found by averaging the results of the white and green needle. This yields
, (0.1 pts)
. (0.1 pts)
Part C. Susceptibility of graphite (4 points)
Taking only 1 measurement of the diameter of the magnet is enough since the measurement results are all virtually the same. The error of the result comes from the accuracy of a ruler, taken to be . The diameter of the magnet is measured to be .
value (0.3 pts)
error (0.2 pts)
In both configurations, the graphite will experience three forces: gravity, normal force and magnetic force, all of them being in balance, with the magnetic force being at an angle with respect to the horizon. Purely under the force of gravity, the graphite would start accelerating with acceleration (where we have used small angle approximations) along the water surface (normal force does not contribute to this as it’s perpendicular to the surface). Since the angles are small, this translates to horizontal acceleration of the same magnitude. This is counteracted by the acceleration from the magnet, given by the formula
explaining the force balance (0.5 pts)
Since the magnet is pushing the graphite at a angle, the force balance is . This let us express in terms of the measured quantities and :
(0.6 pts)
Here we’ve been careful with the signs, since graphite must have a larger susceptibility in magnitude than water but it’s still negative. This concludes the necessary theoretical calculations.
In the first configuration with the equilateral triangle, following measurements for the distance from the wall were made:
| (mm) | |
|---|---|
| 1 | 12 |
| 2 | 10 |
| 3 | 11 |
| 4 | 10 |
| 5 | 11 |
1-2 measurement (0.3/0.5 pts)
3-4 measurements (0.4/0.5 pts)
5 or more measurements (0.5/0.5 pts)
this gives an average of with an error of , where we have added the measurement error from the ruler and the standard deviation from the tabulated data (we usually omit the ruler’s accuracy in the case of repeat measurements, but that’s usually because the ruler’s accuracy is much smaller than standard deviation).
The corresponding surface slope can be read from the graph, but first we need to convert to units of , with . Thus, with . From figure 7, we measure
where the error was measured from the figure by looking at . The error is big but this is to be expected due to the exponential nature of the graphs.
To get a reading of the magnetic pressure gradient, we first calculate the distance of the graphite from the surface of the magnet. We see that the distance is that of the height of an equilateral triangle with side length . The distance is then simply . From figure 8, we read the magnetic pressure gradient to be .
Finally, using equation (2), we find
reading the data from the graphs properly (0.2 pts)
final value for (0.1 pts)
error propagation (0.3 pts)
We go through the same calculations in the 2nd configuration to get a different estimate for . The measurements for 2nd configuration are tabulated below
| (mm) | |
|---|---|
| 1 | 7 |
| 2 | 8 |
| 3 | 8 |
| 4 | 6 |
| 5 | 7 |
1-2 measurement (0.3/0.5 pts)
3-4 measurements (0.4/0.5 pts)
5 or more measurements (0.5/0.5 pts)
We find , . This corresponds to From figure 7, we read .
In this case, a right-angled isosceles is formed. It’s easy to see that the graphite is distance from the surface of the magnet. This gives the magnetic pressure gradient to be . This gives the susceptibility to be .
reading the data from the graphs properly (0.2 pts)
final value for (0.1 pts)
error propagation (0.3 pts)
Finally, we average the two results to get
final answer (0.1 pts)
error (0.1 pts)
Part D. Relative permeability of ferromagnetic strip (9 points)
i. (1 pt) The voltage on the output leads of the battery holder can be measured to be , no uncertainty is needed. (0.5 pts)
After correctly setting up the experimental equipment, the zero off-set is measured to be . (0.5 pts)
ii. (4 pts) Rearranging the expression for the magnetic field strength between the strips, , we get
We can measure and , and can be converted into magnetic field strength by noting that the maximal field strength is measured at , and thus, we must have
(0.3 pts)
This relies on the fact that the magnetic field strength scales linearly with voltage. To linearize the measured data, we need to know . This can be found by noting that and so . This we can read from the measured data to be . (0.2 pts)
Now note that we can plot against to get a linear graph with slope . The tabulated data is given below.
| (cm) | (mV) | (mT) | |
|---|---|---|---|
| 0 | 24 | 0.227 | 0.130 |
| 5 | 25 | 0.237 | 0.316 |
| 10 | 27 | 0.256 | 0.513 |
| 15 | 30 | 0.284 | 0.707 |
| 20 | 35 | 0.331 | 0.936 |
| 25 | 44 | 0.416 | 1.225 |
| 30 | 52 | 0.492 | 1.418 |
| 35 | 58 | 0.549 | 1.539 |
| 40 | 71 | 0.672 | 1.757 |
| 45 | 85 | 0.804 | 1.946 |
| 50 | 104 | 0.984 | 2.154 |
| 55 | 200 | 1.893 | 2.818 |
less than 3 measurements (0.0/0.4 pts)
3 - 11 measurements (0.2/0.4 pts)
correct number of measurements (0.4/0.4 pts)
calculations (0.4 pts)
It is important to note that on the graph, the line doesn’t need to pass through origin due to systematic errors affecting all the points equally. For example, the measured doesn’t coincide with the actual origin due to the physical dimensions of the magnet. Furthermore, the final point in the graph is not used for fitting since it deviates due to the over saturation effect.
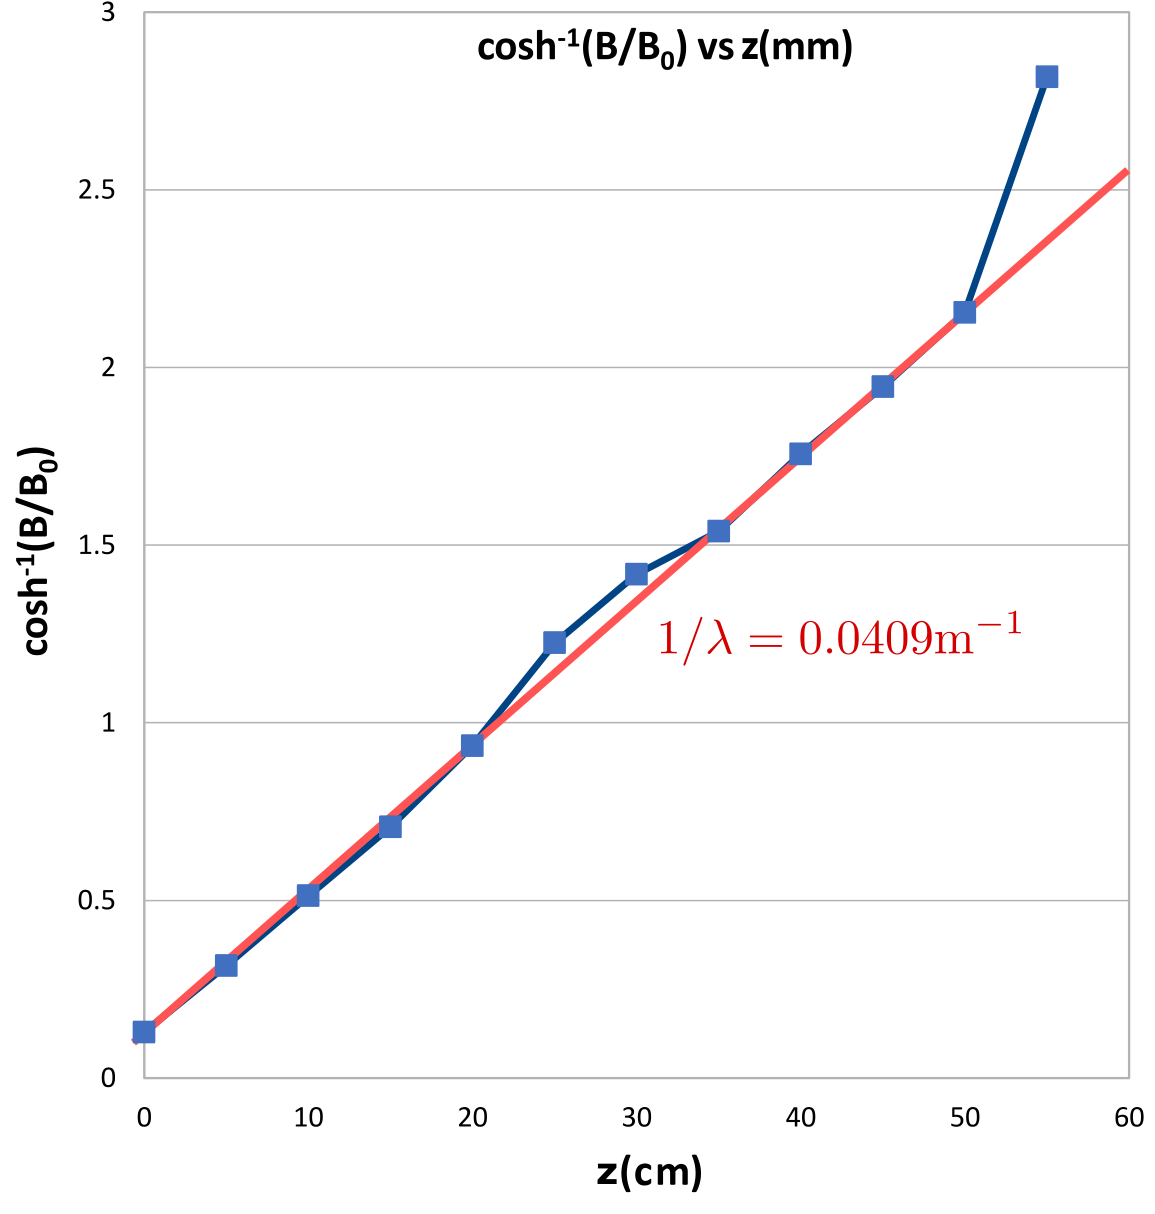
plotting (1.0 pts)
From the graph, we read the slope to be .
(0.2 pts)
The uncertainty can be estimated by looking at the spread of lines that can be reasonably expected to pass through the points. This yields . (0.2 pts)
Now, . We measure , the width of the gap, with a ruler to be . The error is found by noting that the error of a ruler is half, or slightly less depending on how good your eye is, of the distance between two neighbouring ticks, . Finally, we calculate (0.4 pts) with an error of
iii. (2 pts) The tabulated measurement data is given below. The voltages are translated to teslas using equation (3).
| (mm) | (mm) | (mV) | (mT) |
|---|---|---|---|
| 0 | -18 | 18 | 0.170 |
| 2 | -16 | 29 | 0.274 |
| 4 | -14 | 41 | 0.388 |
| 6 | -12 | 43 | 0.407 |
| 8 | -10 | 44 | 0.416 |
| 10 | -8 | 46 | 0.435 |
| 12 | -6 | 48 | 0.454 |
| 14 | -4 | 50 | 0.473 |
| 16 | -2 | 52 | 0.492 |
| 18 | 0 | 52 | 0.492 |
| 20 | 2 | 51 | 0.483 |
| 22 | 4 | 50 | 0.473 |
| 24 | 6 | 49 | 0.464 |
| 26 | 8 | 47 | 0.445 |
| 28 | 10 | 46 | 0.435 |
| 30 | 12 | 44 | 0.416 |
| 32 | 14 | 40 | 0.379 |
| 34 | 16 | 28 | 0.265 |
| 36 | 18 | 18 | 0.170 |
less than 3 measurements (0.1/0.6 pts)
3 - 5 measurements (0.3/0.6 pts)
6 - 7 measurements (0.4/0.6 pts)
correct number of measurements (0.6/0.6 pts)
calculations (0.4 pts)
is measured with respect to the first data point, is with respect to the symmetry axis (found to be at ). The graph for vs is given below.
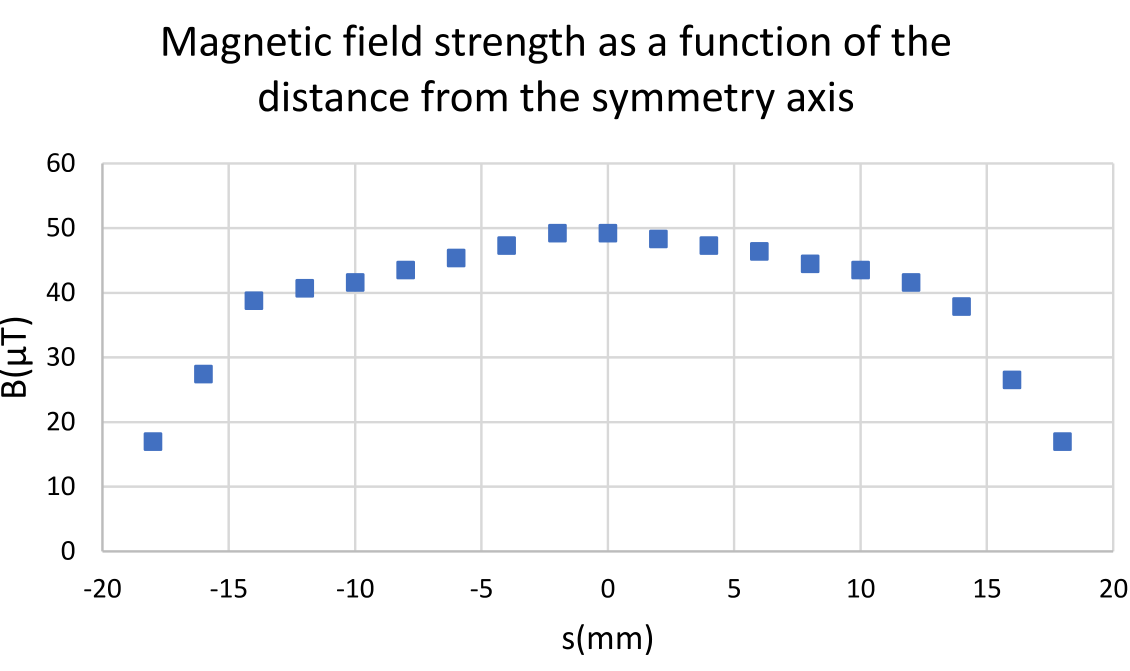
plotting (0.6 pts)
As can be seen, the magnetic field strength is uniform and with small deviations up to over the width of the strip. Outside the strip, the field strength starts dropping rapidly. (0.4 pts)
iv. (2 pts) The main idea relies on the fact that magnetic field lines are conserved, or in other words the magnetic flux through a closed surface is 0. This is equivalent to Gauss’ law. In the context of this problem, it implies that the flux entering the gap must come from the decrease of the flux flowing along the ferromagnetic strip. The flux flowing outside the strip will be negligible because of the high value of .
Let the total flux along the strip be , -axis be along the strip, and -axis be horizontal, perpendicular to . Also denote the flux through the plane intersecting the gap from to as . The Gauss’ law can then be formulated as
(0.5 pts)
Note that since the flux inside the ferromagnet drops exponentially, and judging from the tabulated data, it’s reasonable to say that . (0.1 pts) We can approximate the magnetic field to be homogeneous throughout the cross-section of the ferromagnet (to very high accuracy, this can be verified using Ampère’s law). Then , where is the width of the ferromagnet, measured to be , and is the magnetic field inside the ferromagnet. (0.1 pts)
This means that if we calculate , we can find using equation (4). To find , we need to sum the magnetic field over the - and -direction. In integral form, it looks like . We can simplify this with the integral , where is the effective width of the gap such that the area under the graph found in the previous part is equal to , where is the maximal magnetic field in the gap found in part (ii).
From an approximate plot shown below, we find .
Finding using a plot, or something equivalent (0.2 pts)
All that’s left is to find . This can be found from the tabulated data found in part (ii) by summing over the data points using the trapezoid rule,
(0.3 pts)
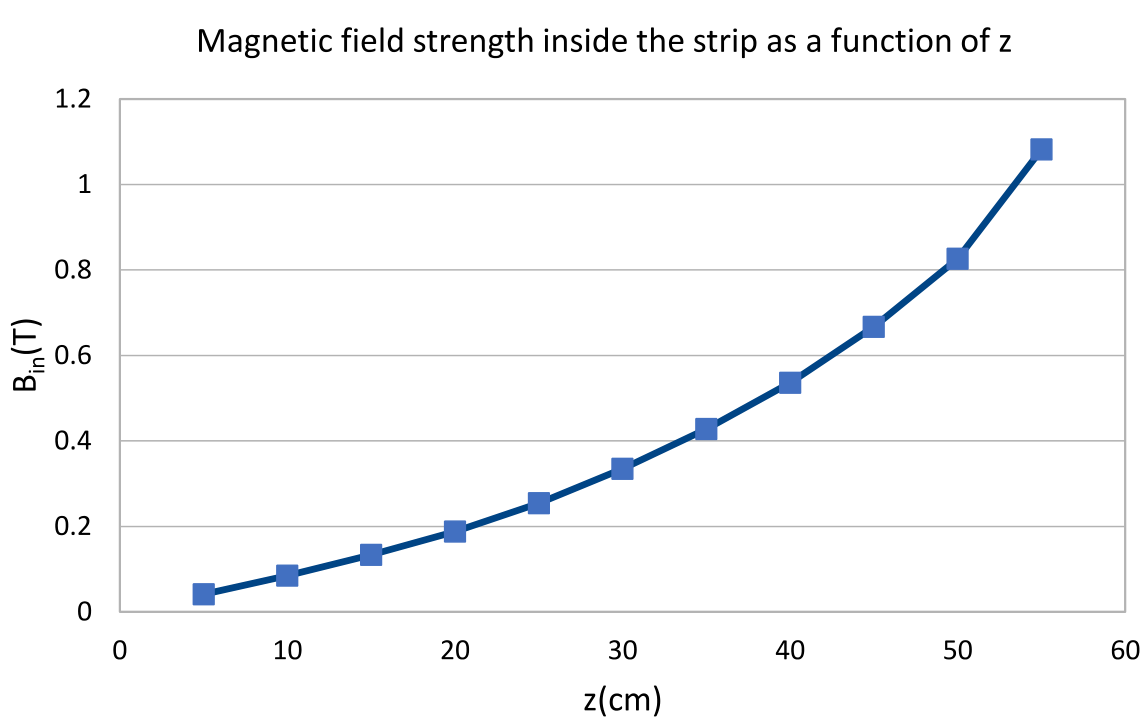
where is the effective area of the last segment and the flux through the corresponding surface. After that, the magnetic field inside the ferromagnetic is simply found using (4) as .
The calculated data is given below alongside with the plot of vs .
| (cm) | (mT) | () | () | (T) |
|---|---|---|---|---|
| 0 | - | - | 0 | |
| 5 | 0.232 | 0.334 | 0.334 | 0.041 |
| 10 | 0.246 | 0.354 | 0.688 | 0.085 |
| 15 | 0.27 | 0.389 | 1.077 | 0.133 |
| 20 | 0.308 | 0.444 | 1.521 | 0.188 |
| 25 | 0.374 | 0.539 | 2.06 | 0.254 |
| 30 | 0.454 | 0.654 | 2.714 | 0.335 |
| 35 | 0.521 | 0.75 | 3.464 | 0.428 |
| 40 | 0.61 | 0.878 | 4.342 | 0.536 |
| 45 | 0.738 | 1.063 | 5.405 | 0.667 |
| 50 | 0.894 | 1.287 | 6.692 | 0.826 |
| 55 | 1.438 | 2.071 | 8.763 | 1.082 |
calculations (0.3 pts)
plotting (0.3 pts)
Since in the graph found in part (ii), the saturation cut-off happened at the last data point, we can use the corresponding value for as an estimate for . Then . (0.2 pts)
Оригинал в Архива: exp.pdf · официални решения: exp_sol.pdf