IAO 2022, Практически тур — Задача 15. Evolutionary phases of stars
II International Remote Astronomy Olympiad — Practical round · 15 октомври 2022 г.
Practical round. Problems to solve
II International Remote Astronomy Olympiad. Matera, Italy, 15–24 October 2022.
Note: problems for Group α — 13, 14, for Group β — 14, 15, for Group γ — 13, 14, 15.
Source notes and availability
The file contains three independent tasks and all tabulated data, theoretical curves and a blank plotting grid. Its fourth page repeats tasks14 and15; this does not create new tasks. The sunspot dates are printed as October2018 and retained. The star table uses labels A–I,L,M as printed. The isochrone diagram numbers its curves but provides no numerical age key, although task15 asks for an age. No matching official solutions or additional reference files were found in the complete same-year archive catalogue.
Условие
The evolutionary phases of the stars in the HR Diagram
In stellar evolution, observational data are often compared with theoretical ones through the use of the HR diagram. The table 15 shows some selected and observed stars (from A to M) of a globular cluster.
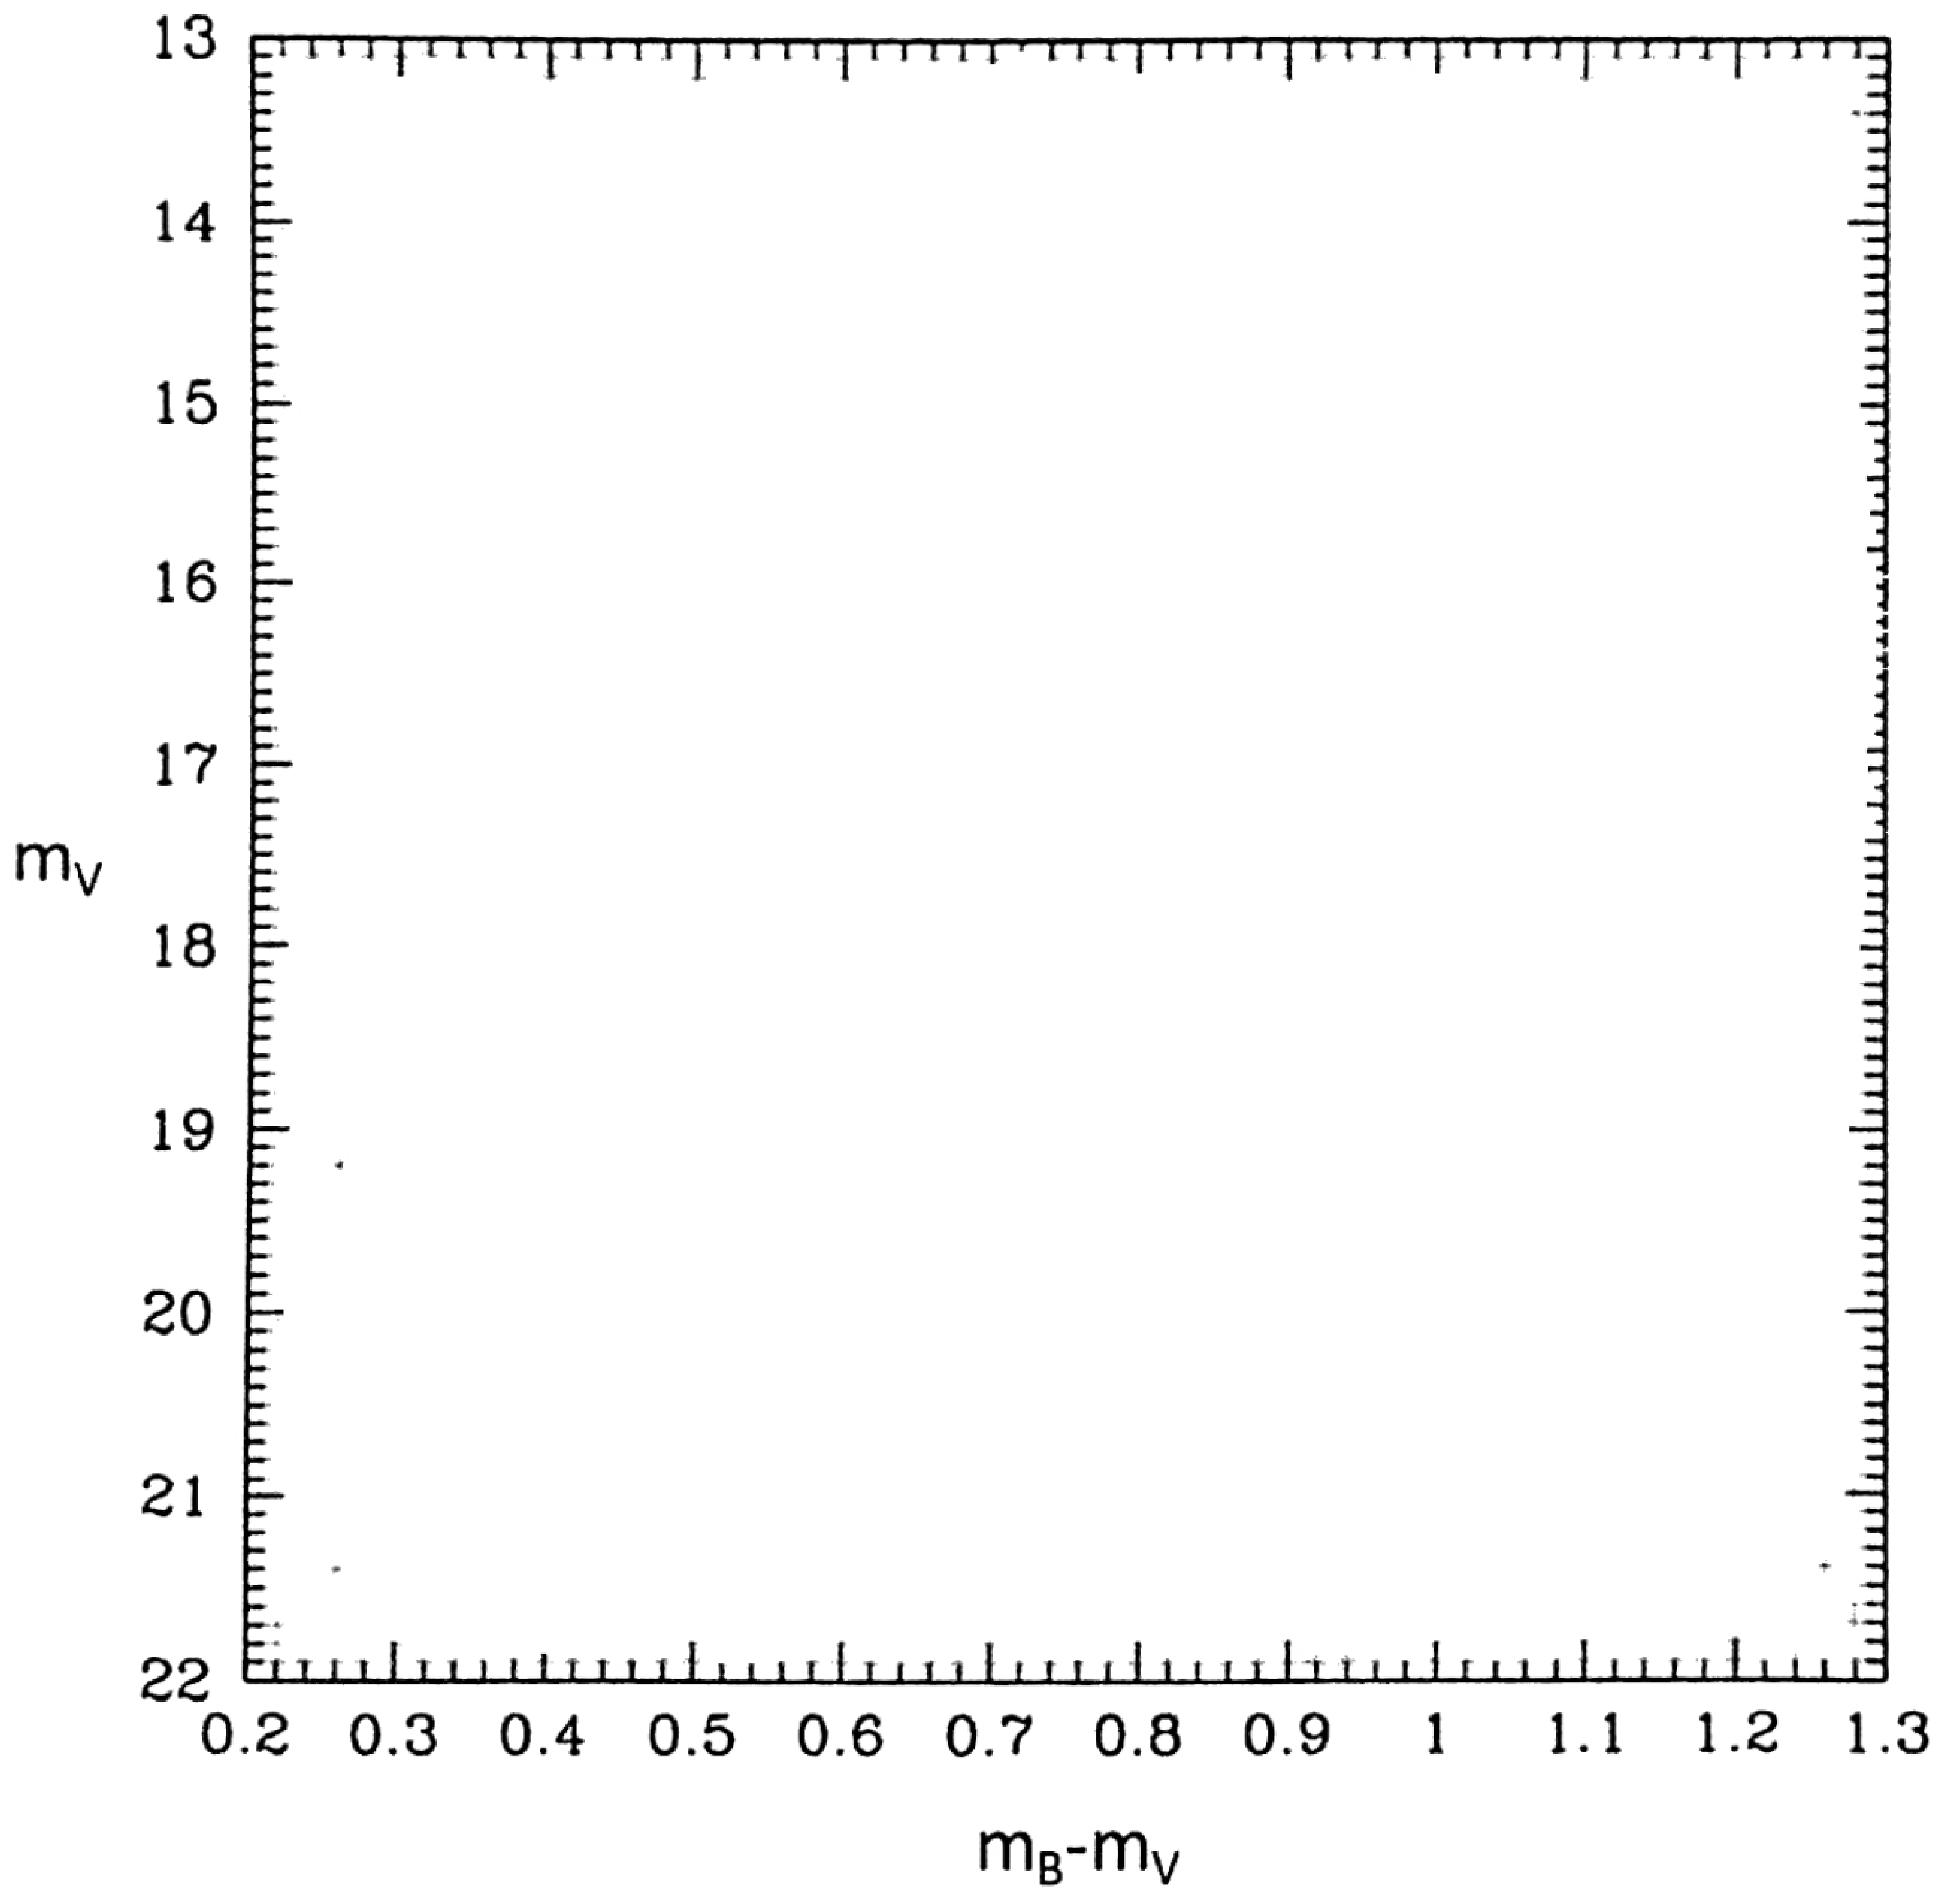
15.1 Using the grid provided (in supplement materials) put the observed stars in the plane vs .
15.2 Comparing them with the theoretical isochrones (stars of the same age but of different mass, see graph in supplement materials) indicate for the stars A, B, C and G their evolutionary phase. To avoid writing words, use the following abbreviations:
| Abbreviation | Phase |
|---|---|
| PMS | Pre-Main Sequence |
| MS | Main Sequence |
| TO | Turn-off |
| RGB | Red Giant Branch |
| HB | Horizontal Branch |
| PN | Planetary Nebula |
| WD | White Dwarf |
15.3 Estimate the distance module and the age of the cluster.
15.
| OBS | ||
|---|---|---|
| A | 15,182 | 14,266 |
| B | 20,625 | 20,059 |
| C | 18,709 | 18,316 |
| D | 21,340 | 20,645 |
| E | 22,118 | 21,285 |
| F | 18,274 | 17,739 |
| G | 15,394 | 14,837 |
| H | 15,675 | 14,828 |
| I | 17,436 | 16,731 |
| L | 20,286 | 19,772 |
| M | 16,100 | 15,301 |
Theoretical isochrones
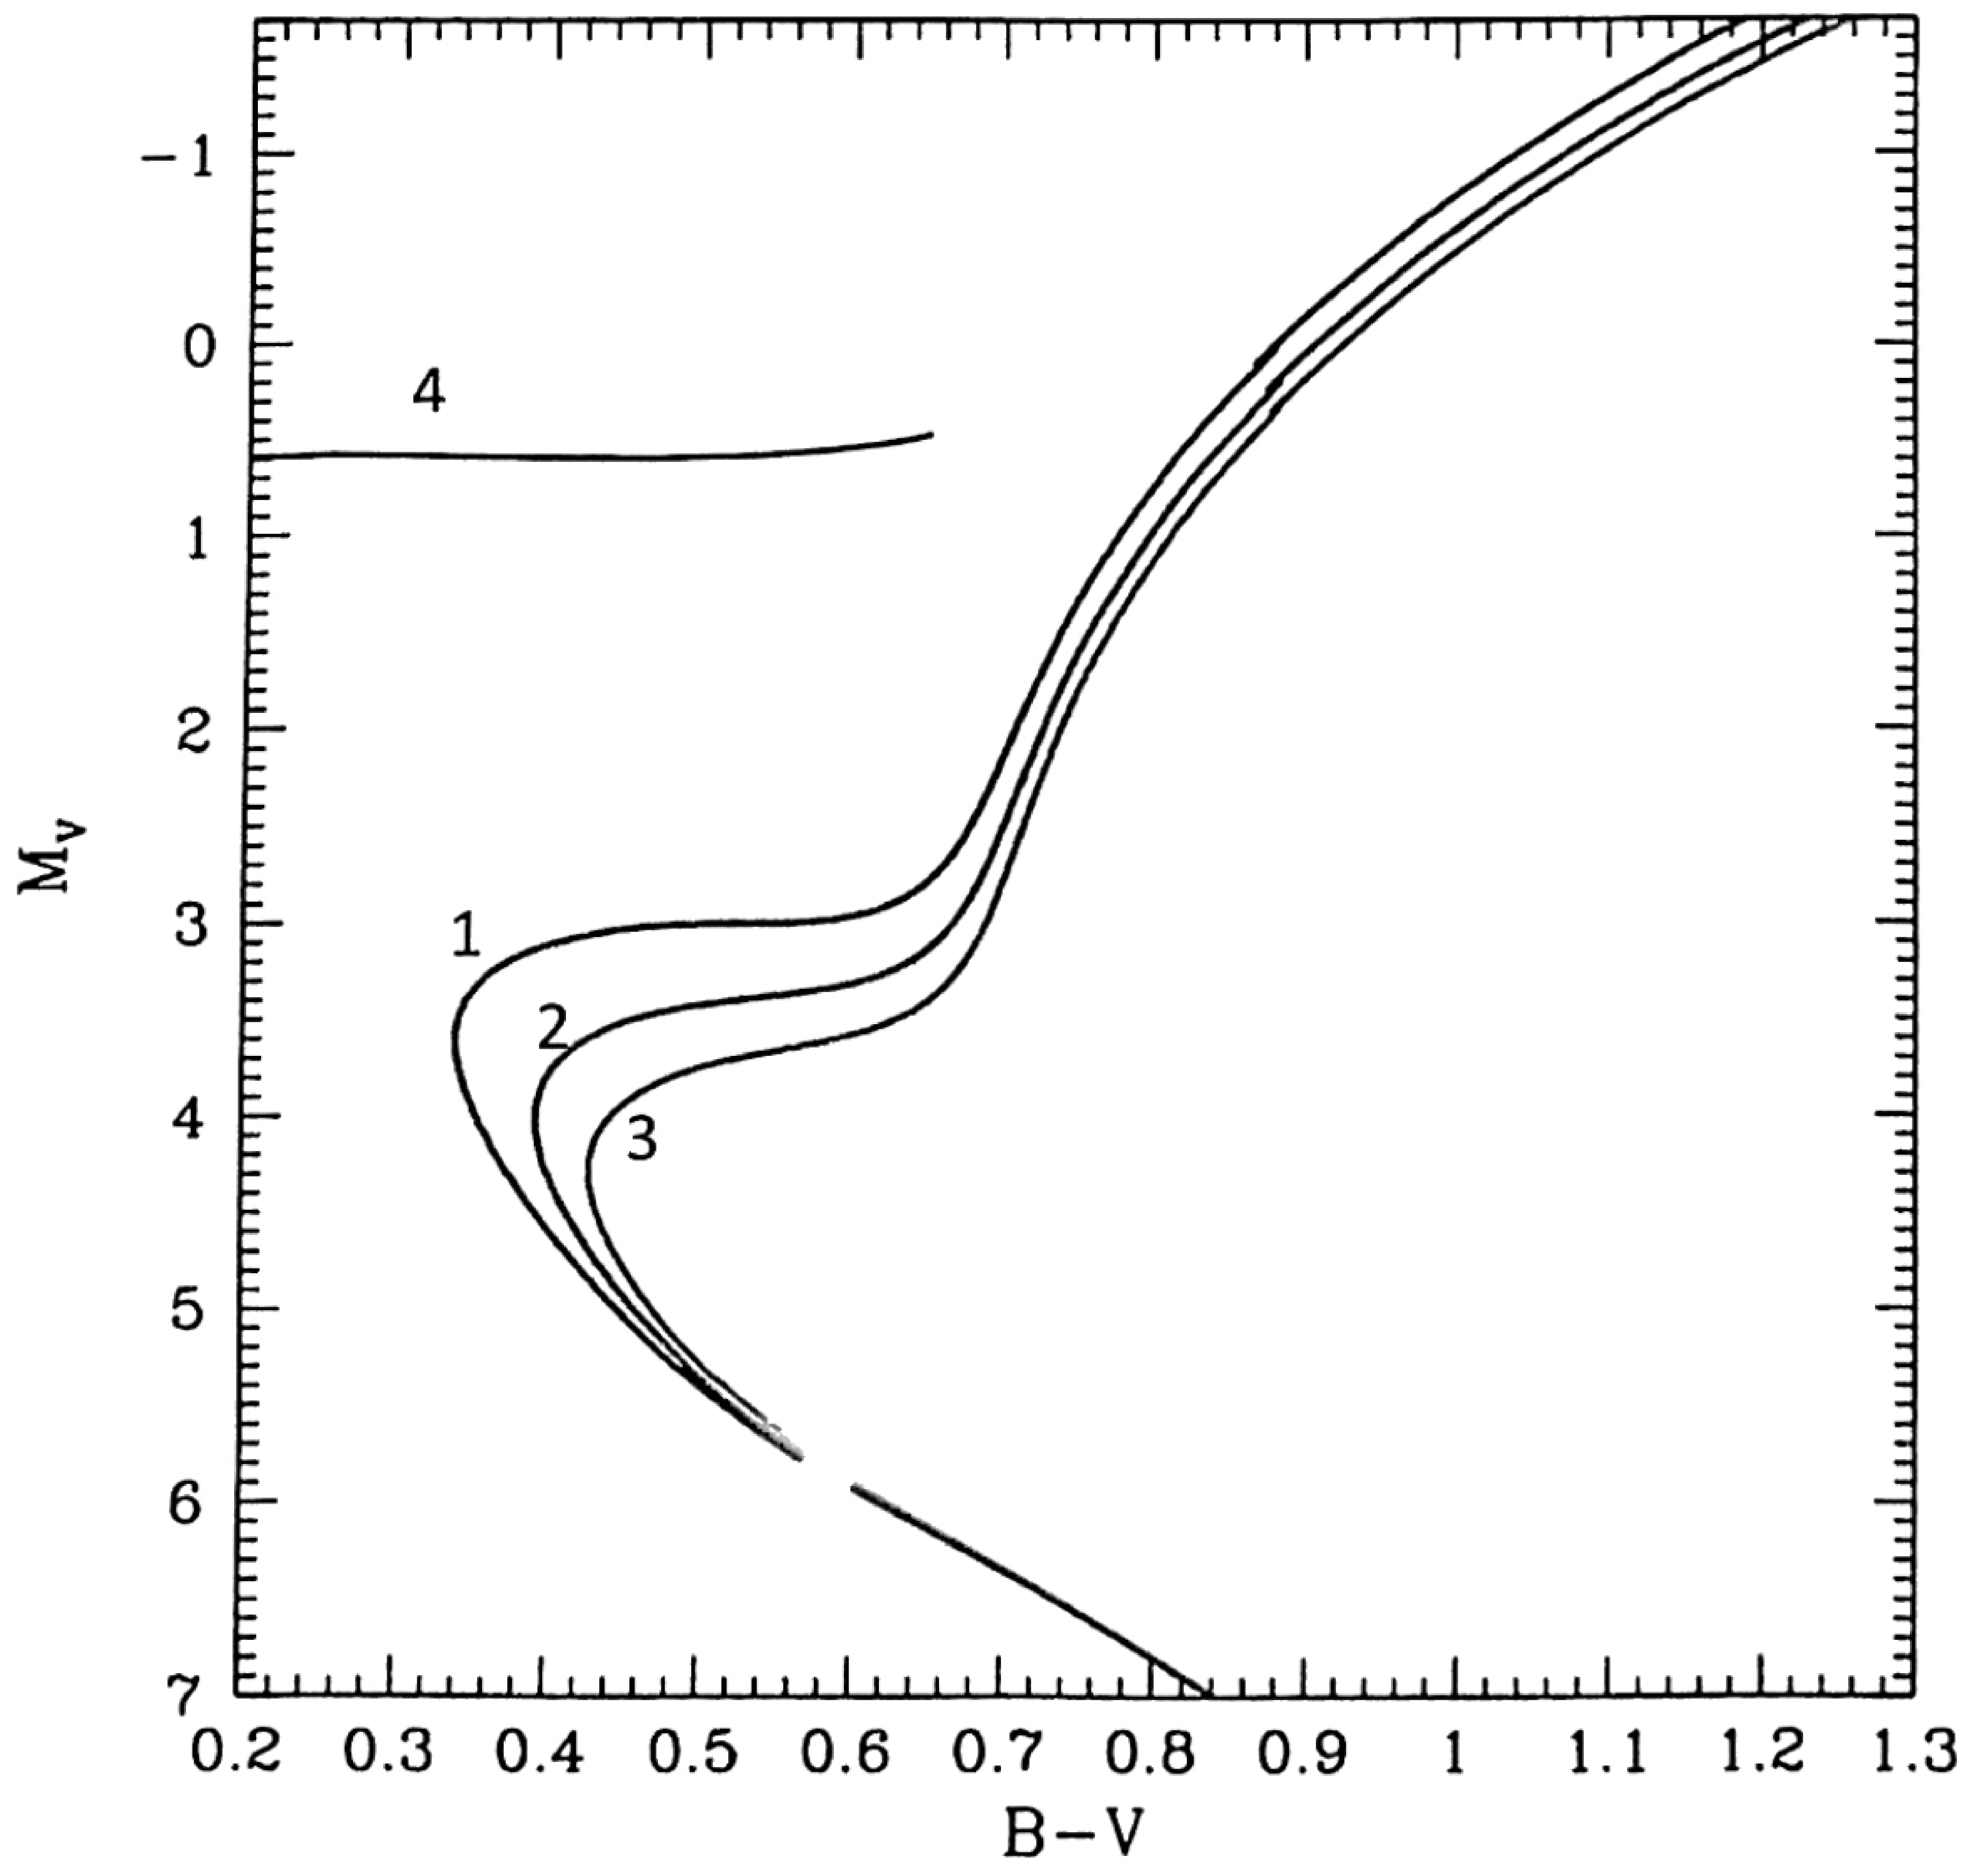
15. Grid
Решение
Внимание: Непълно решение
В архива няма официално решение на тази задача.
Теми и трудност
Трудност: неоценена.
Звезди · Диаграма на Херцшпрунг–Ръсел · Звездна еволюция
Предпоставки: Разширена олимпиадна подготовка
Оригинал в Архива: prac-IRAO2022.pdf