iGeo 2008, Мултимедиен тест, слайдове — Задача 27. Question 27

The Multimedia Test

Внимание: Бележка към темата

Слайдовете съдържат само снимки и карти без текста на въпросите, който е в отделната брошура с въпроси (igeo-2008-mmtquestions-doc).

Условие

Question 27
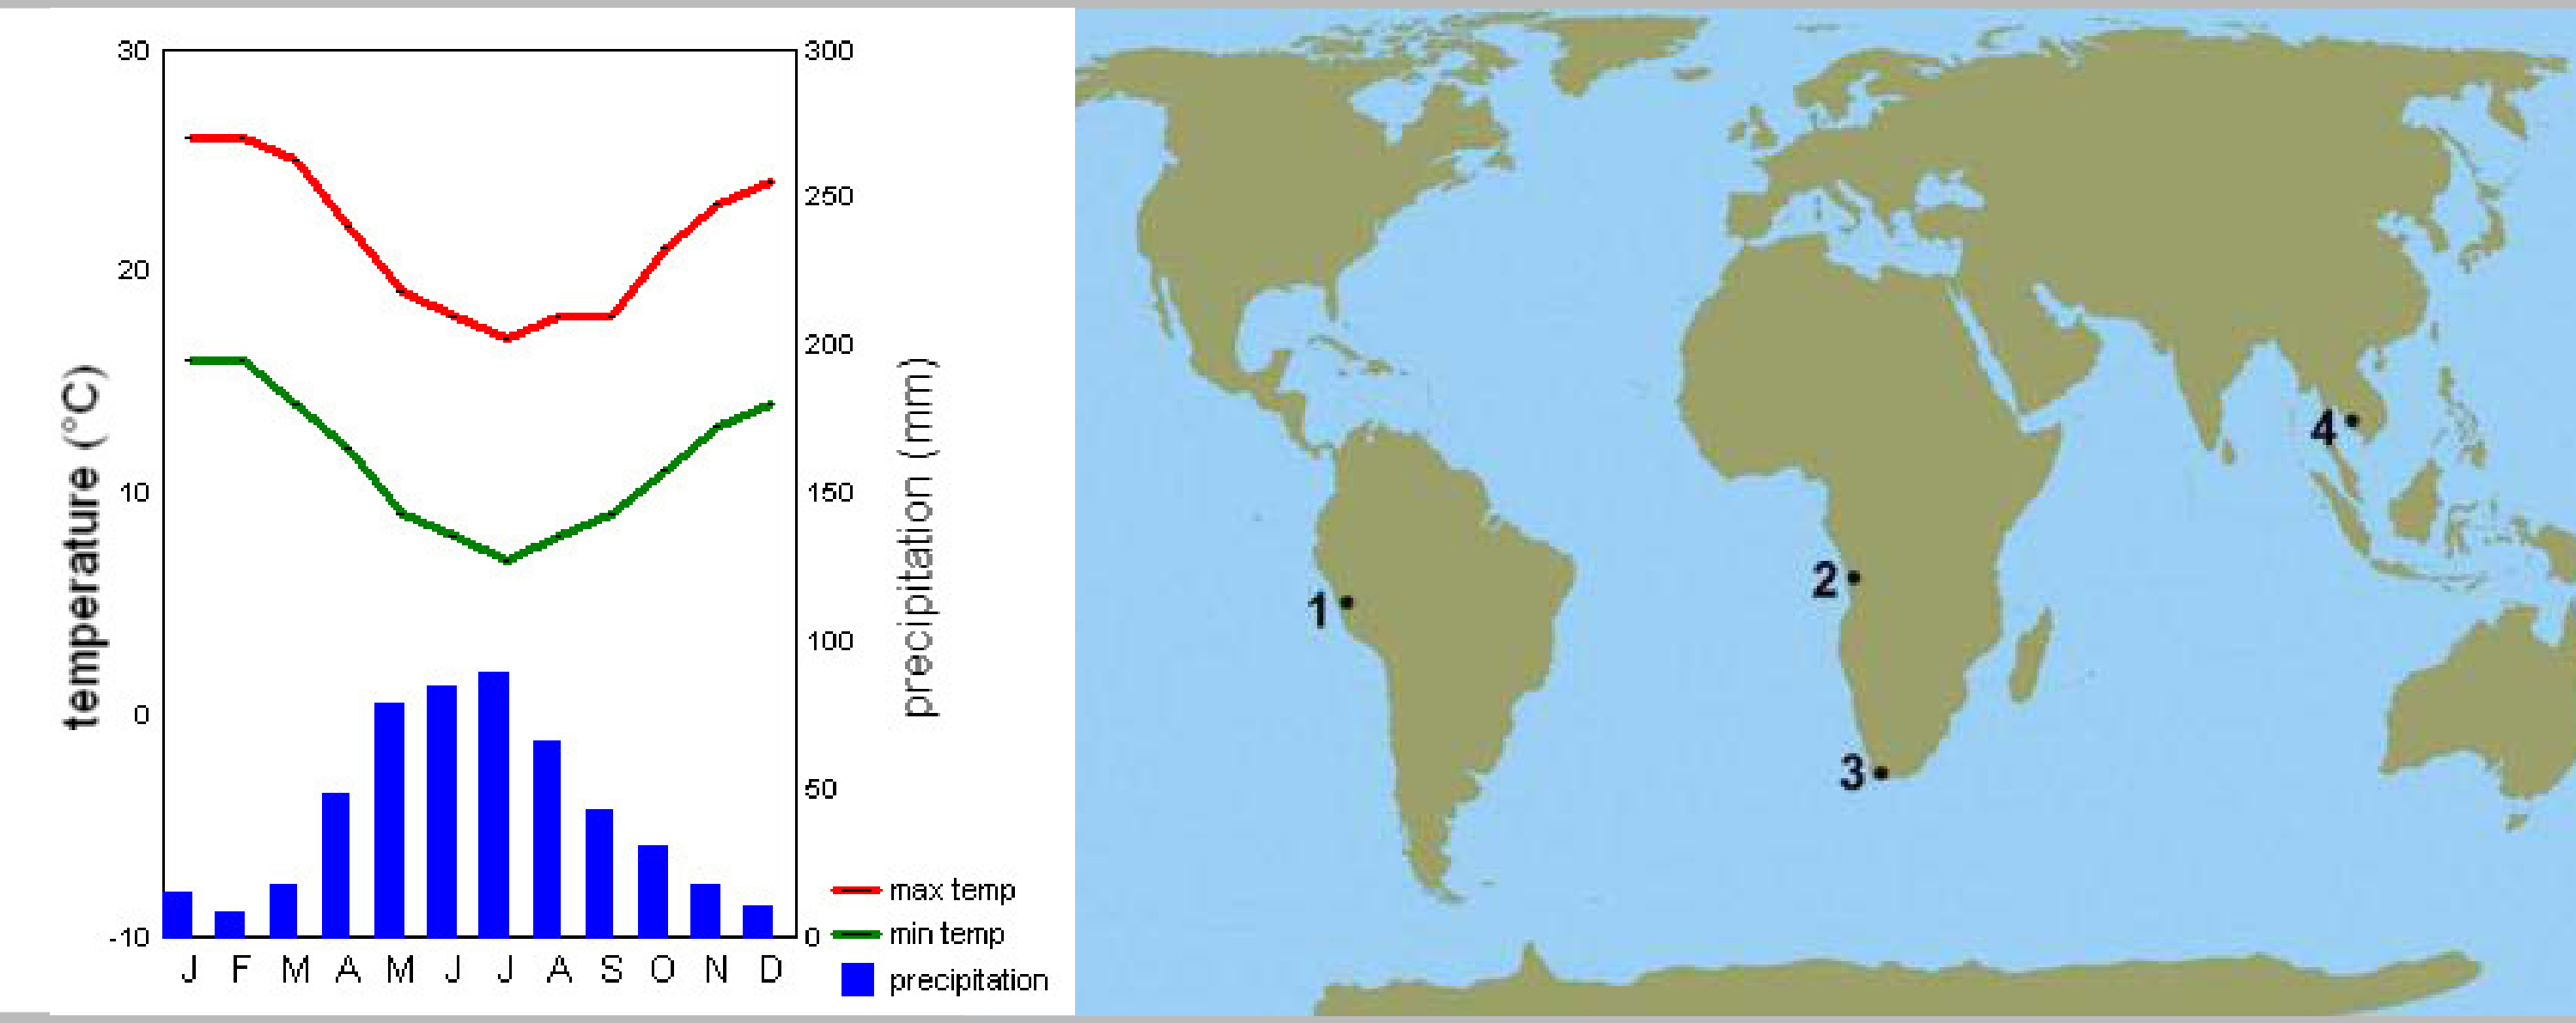
Left: climate graph with max temp (red line) and min temp (green line) on a temperature (°C) axis from -10 to 30 and precipitation (mm, blue bars) on an axis from 0 to 300, months J F M A M J J A S O N D; temperatures are highest in January–February (about 26 °C max, 16 °C min) and lowest in July (about 17 °C max, 7 °C min); precipitation peaks in April–July (about 80–90 mm) and is low in the other months. Right: world map with four numbered points: 1 on the west coast of South America (Peru), 2 on the west coast of southern Africa (Angola), 3 at the southern tip of Africa, 4 in South-East Asia (Thailand/Cambodia).

Отговори

Решение


Оригинал в Архива: 2008MMTTest.pdf · официални решения: 2008MMTAnswers.doc