iGeo 2012, Мултимедиен тест — Задача 21. Question 21
Multi Media Test 2012 Cologne, Germany
Edit
Edit:
Joop van der Schee
Luc Zwartjes
Указания
Look at every page and read the questions carefully.
This multi media test has 30 questions. You have 45 minutes to complete the test. If you are ready wait silently until the 45 minutes are over.
Each question is multiple-choice. Choose A, B, C or D. Only one answer is correct.
Some questions contain a short video clip (indicated with [film-reel icon]). Click inside the video frame to start it.
Mark your choice on the Answer Sheet by making a circle around the letter that you want to select. If you make a mistake cross out the selected letter and circle a new choice.
For navigation it is best to use the arrows ↑ ↓ on the keyboard to move to the next page. Do not click on the escape button, as that ends the presentation.
Good luck!
Условие
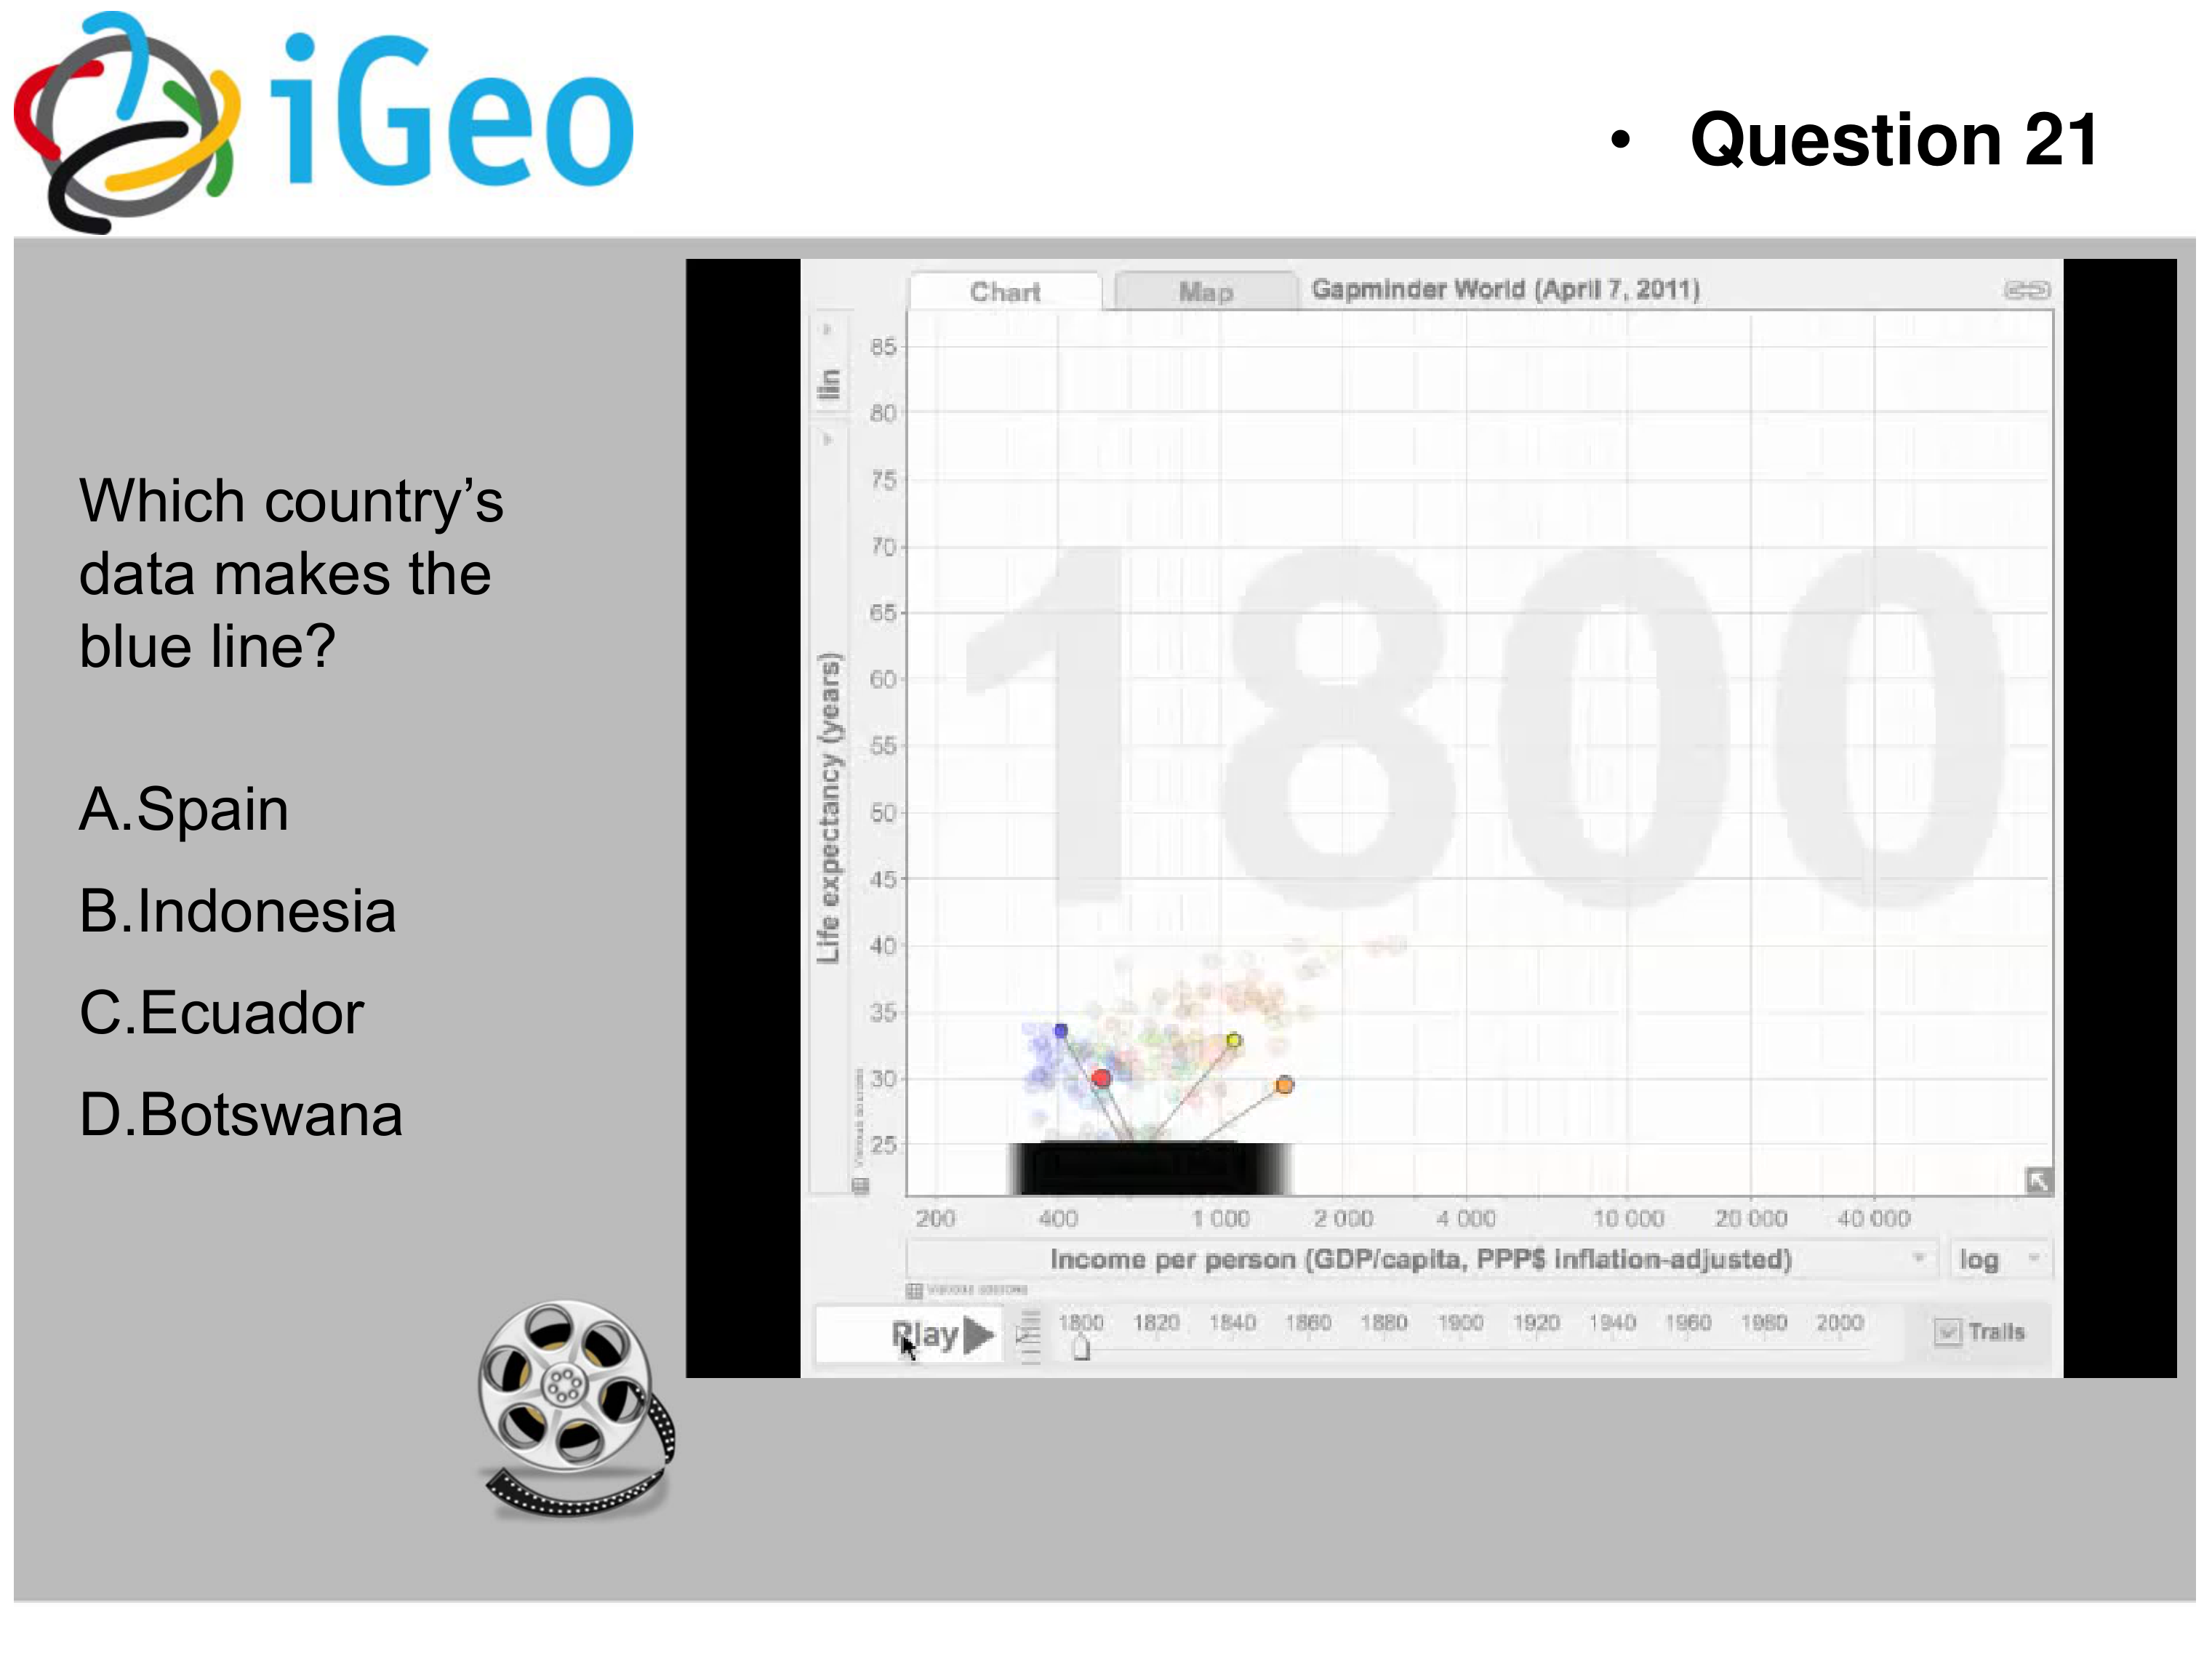
Which country’s data makes the blue line?
A.Spain
B.Indonesia
C.Ecuador
D.Botswana
Отговори
- D
Решение
Question 21: D
The End
You reached the last slide of the multi media test.
Click on the arrow ↑ to go back to the previous page(s) if you want to check your answers.
Or close Adobe Reader.
Оригинал в Архива: 2012MMT.pdf · официални решения: 2012MMTAnswers.doc