iGeo 2013, Мултимедиен тест — Задача 12. Q12
iGeo 2013 · Multimedia Test
Внимание: Бележка към темата
The archived PDF supplies static frames for Q13, E16 and Q31, and a black movie viewport for Q34. Motion originals and a blank response sheet are unavailable. The official key contains answer letters only. Native E16 and “biomass types” are retained.
Условие
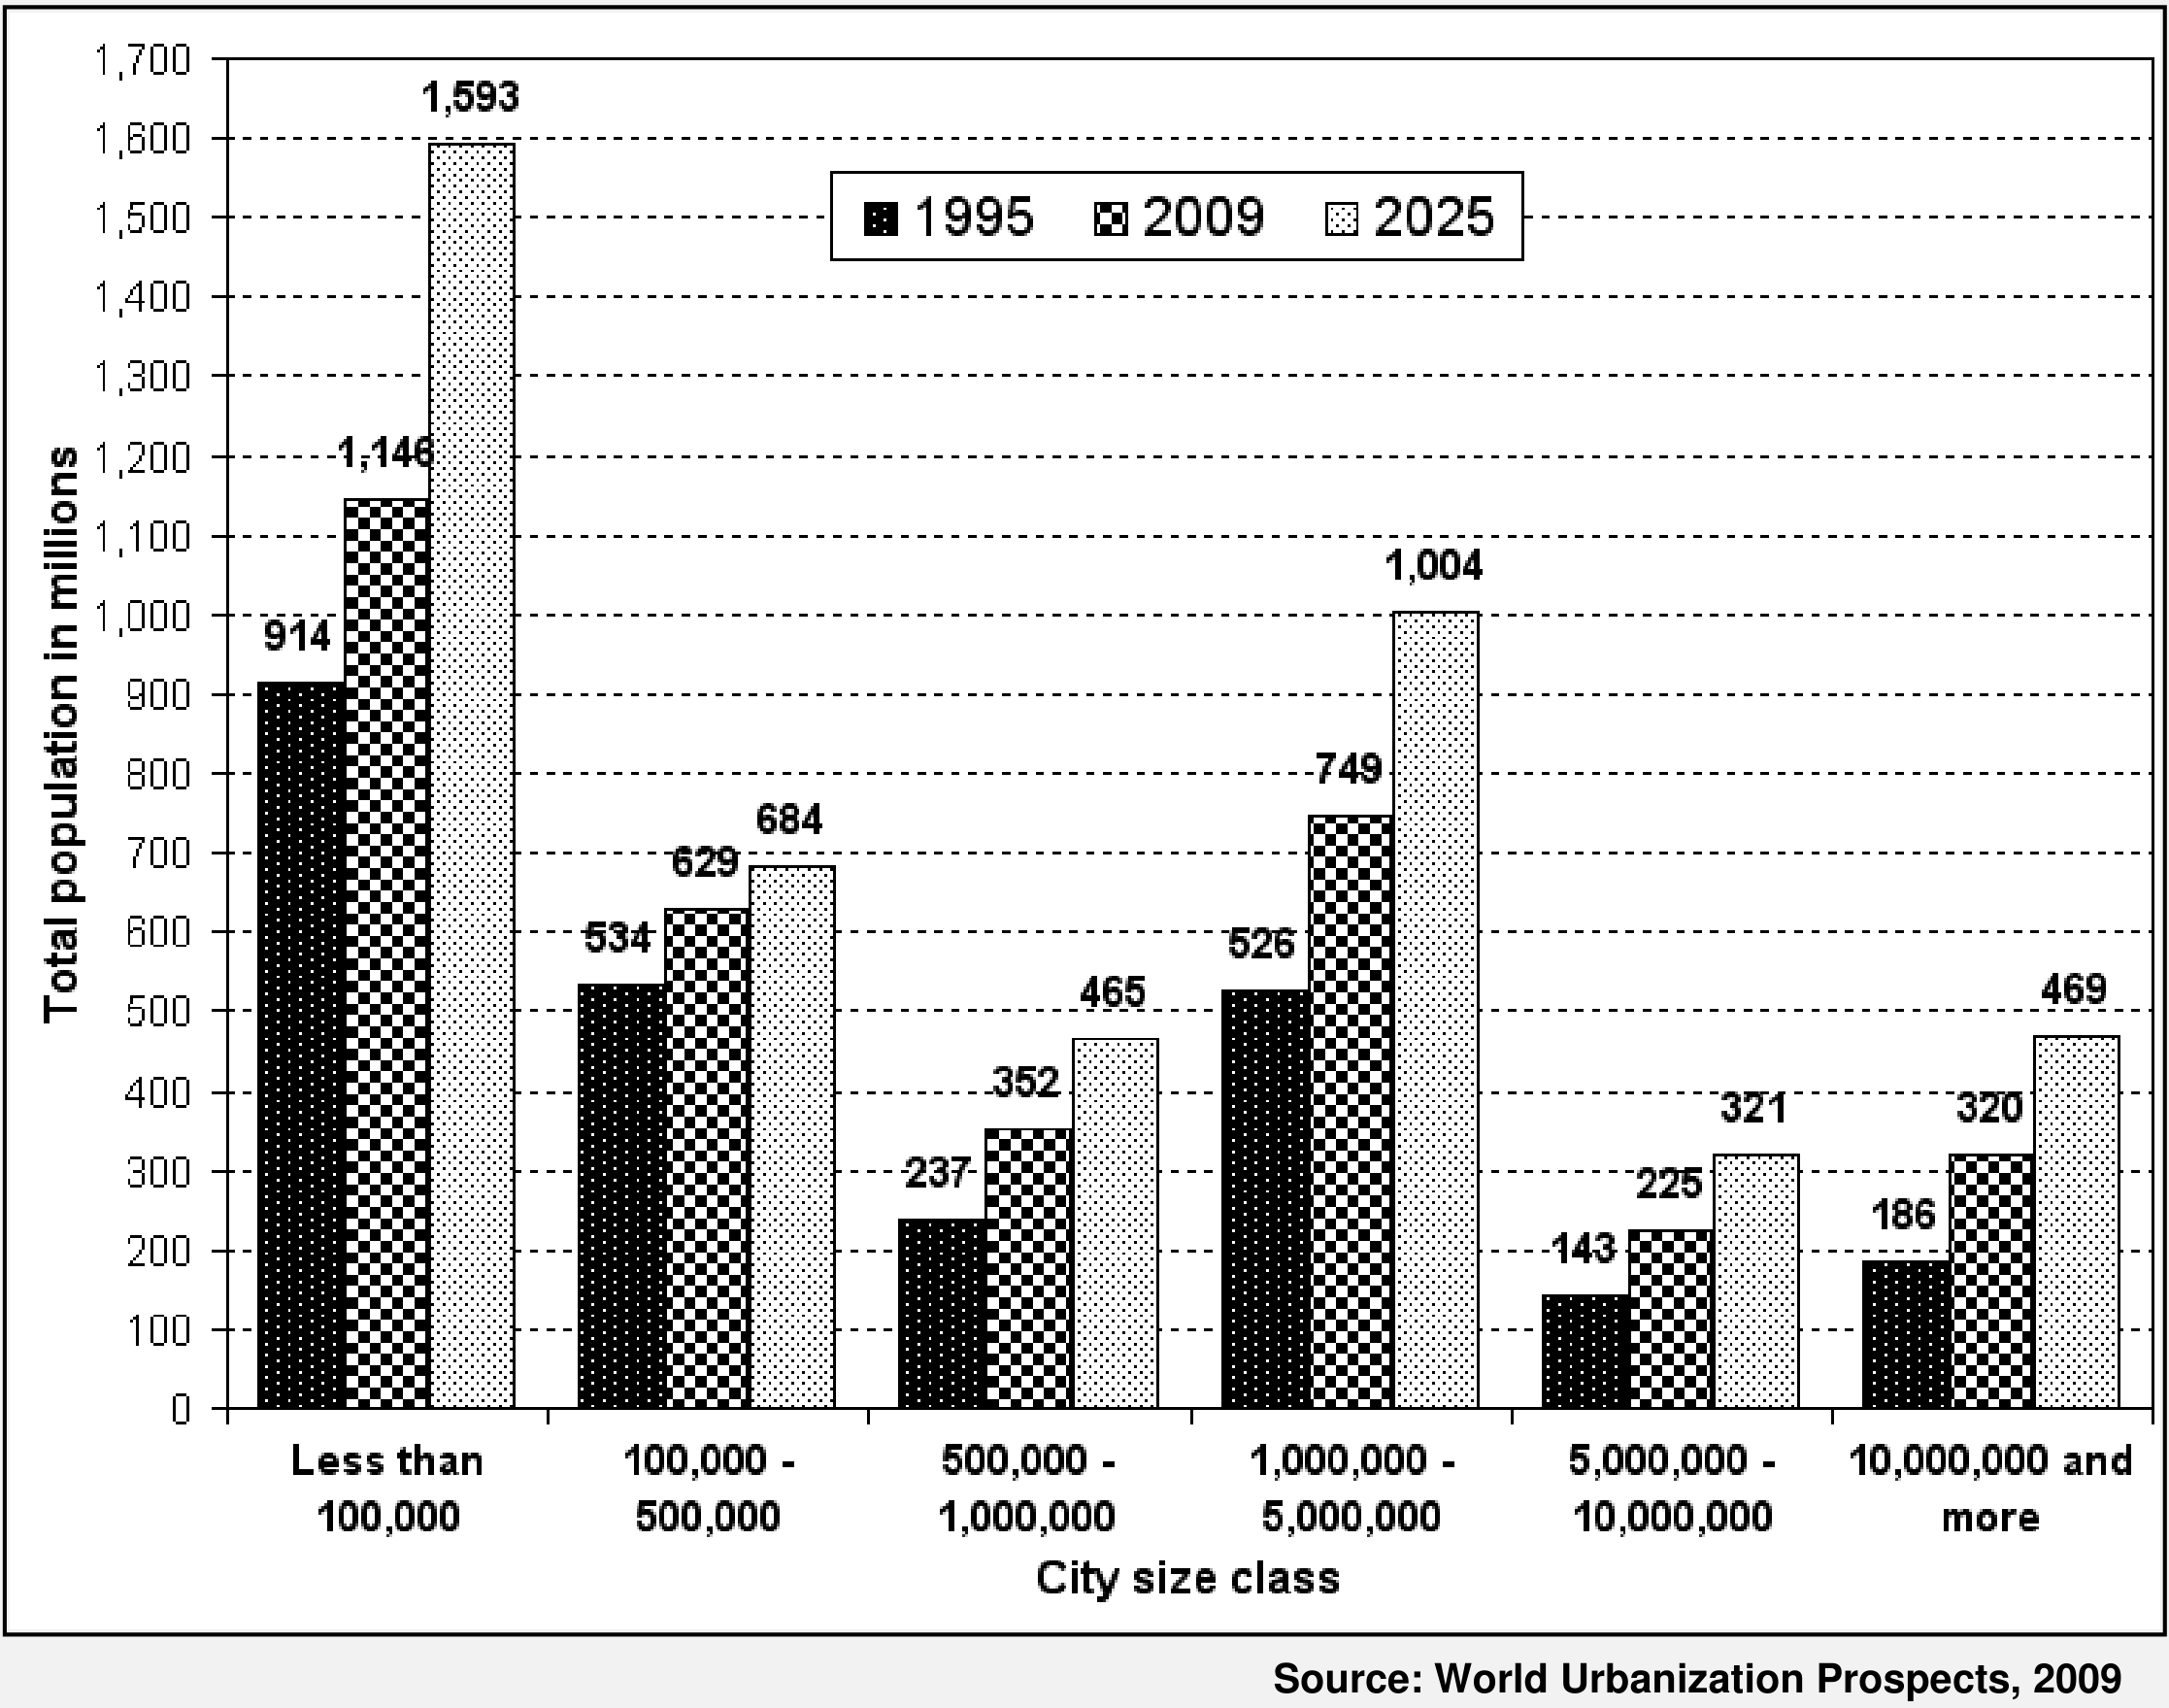
According to the graph, which city size class is expected to experience the greatest rate of population growth between 1995 and 2025?
A. less than 100,000
B. 500,000 to 1 million
C. 1 to 5 million
D. 10 million and more
Отговори
- D
Решение
ANSWER CODE: D
Оригинал в Архива: 2013MMT.pdf · официални решения: 2013MMTAnswers.pdf