iGeo 2013, Мултимедиен тест — Задача 33. Q33
iGeo 2013 · Multimedia Test
Внимание: Бележка към темата
The archived PDF supplies static frames for Q13, E16 and Q31, and a black movie viewport for Q34. Motion originals and a blank response sheet are unavailable. The official key contains answer letters only. Native E16 and “biomass types” are retained.
Условие
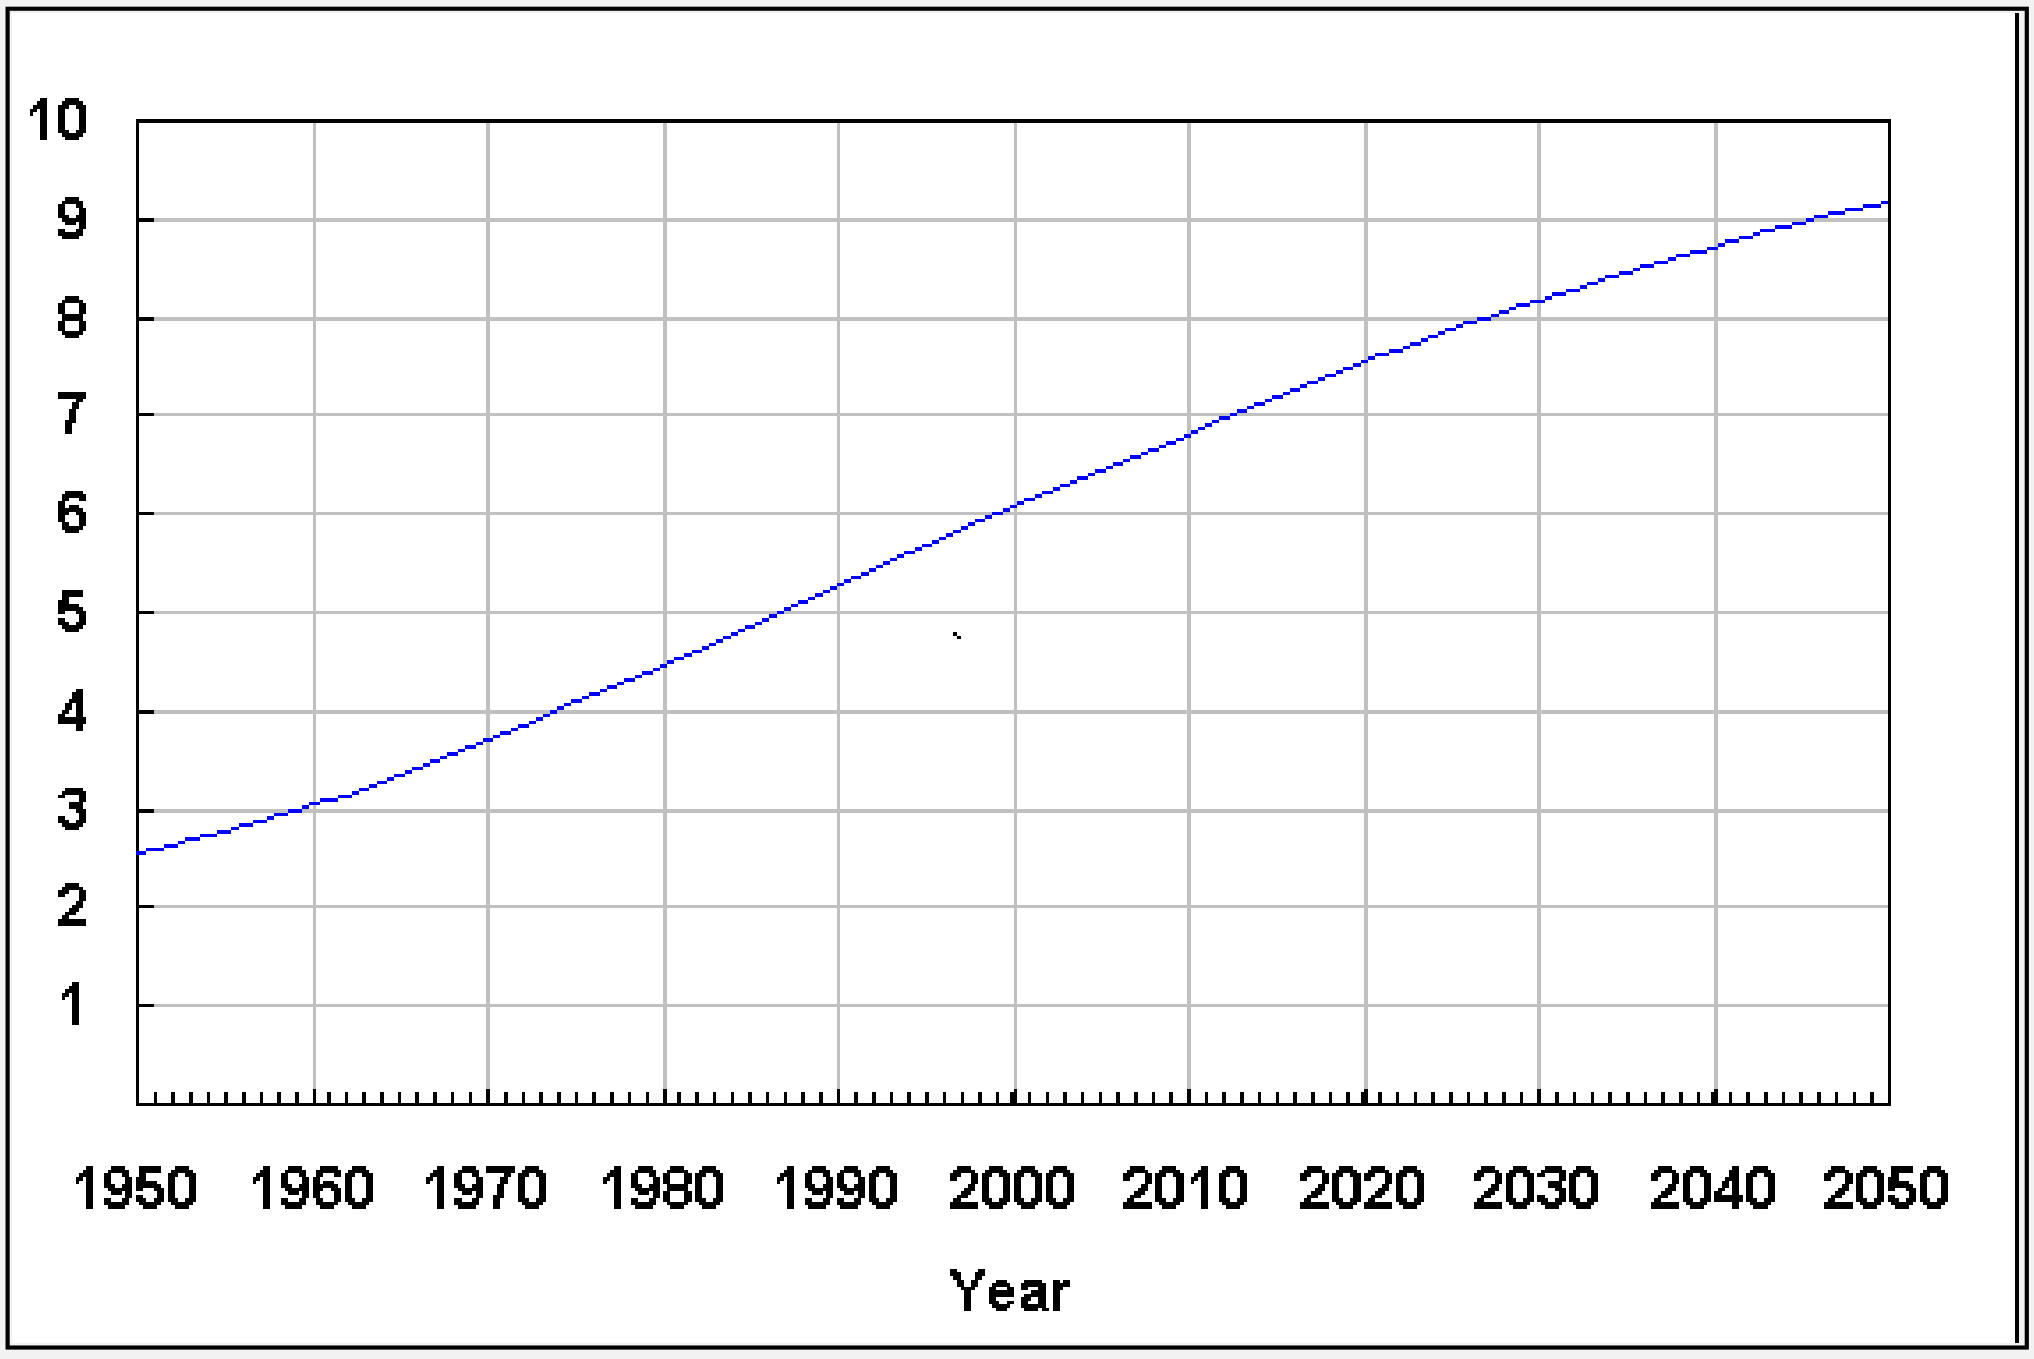
This time-series graph shows the projection of:
A. business development plans for 15 members of the European Union ( €)
B. iron ore mining growth (thousand tons per year)
C. petrol price in world market (USD per litre)
D. world population growth (thousand million people)
Отговори
- D
Решение
ANSWER CODE: D
Оригинал в Архива: 2013MMT.pdf · официални решения: 2013MMTAnswers.pdf