iGeo 2014, Мултимедиен тест — Задача 19. Q19
iGeo 2014 · Multimedia Test
Внимание: Бележка към темата
The official key supplies answer letters only. A blank response sheet and explanatory solutions are unavailable. Original movies and browser-compatible copies are linked for Q36 and Q38; the original PDF viewports are also retained.
Условие
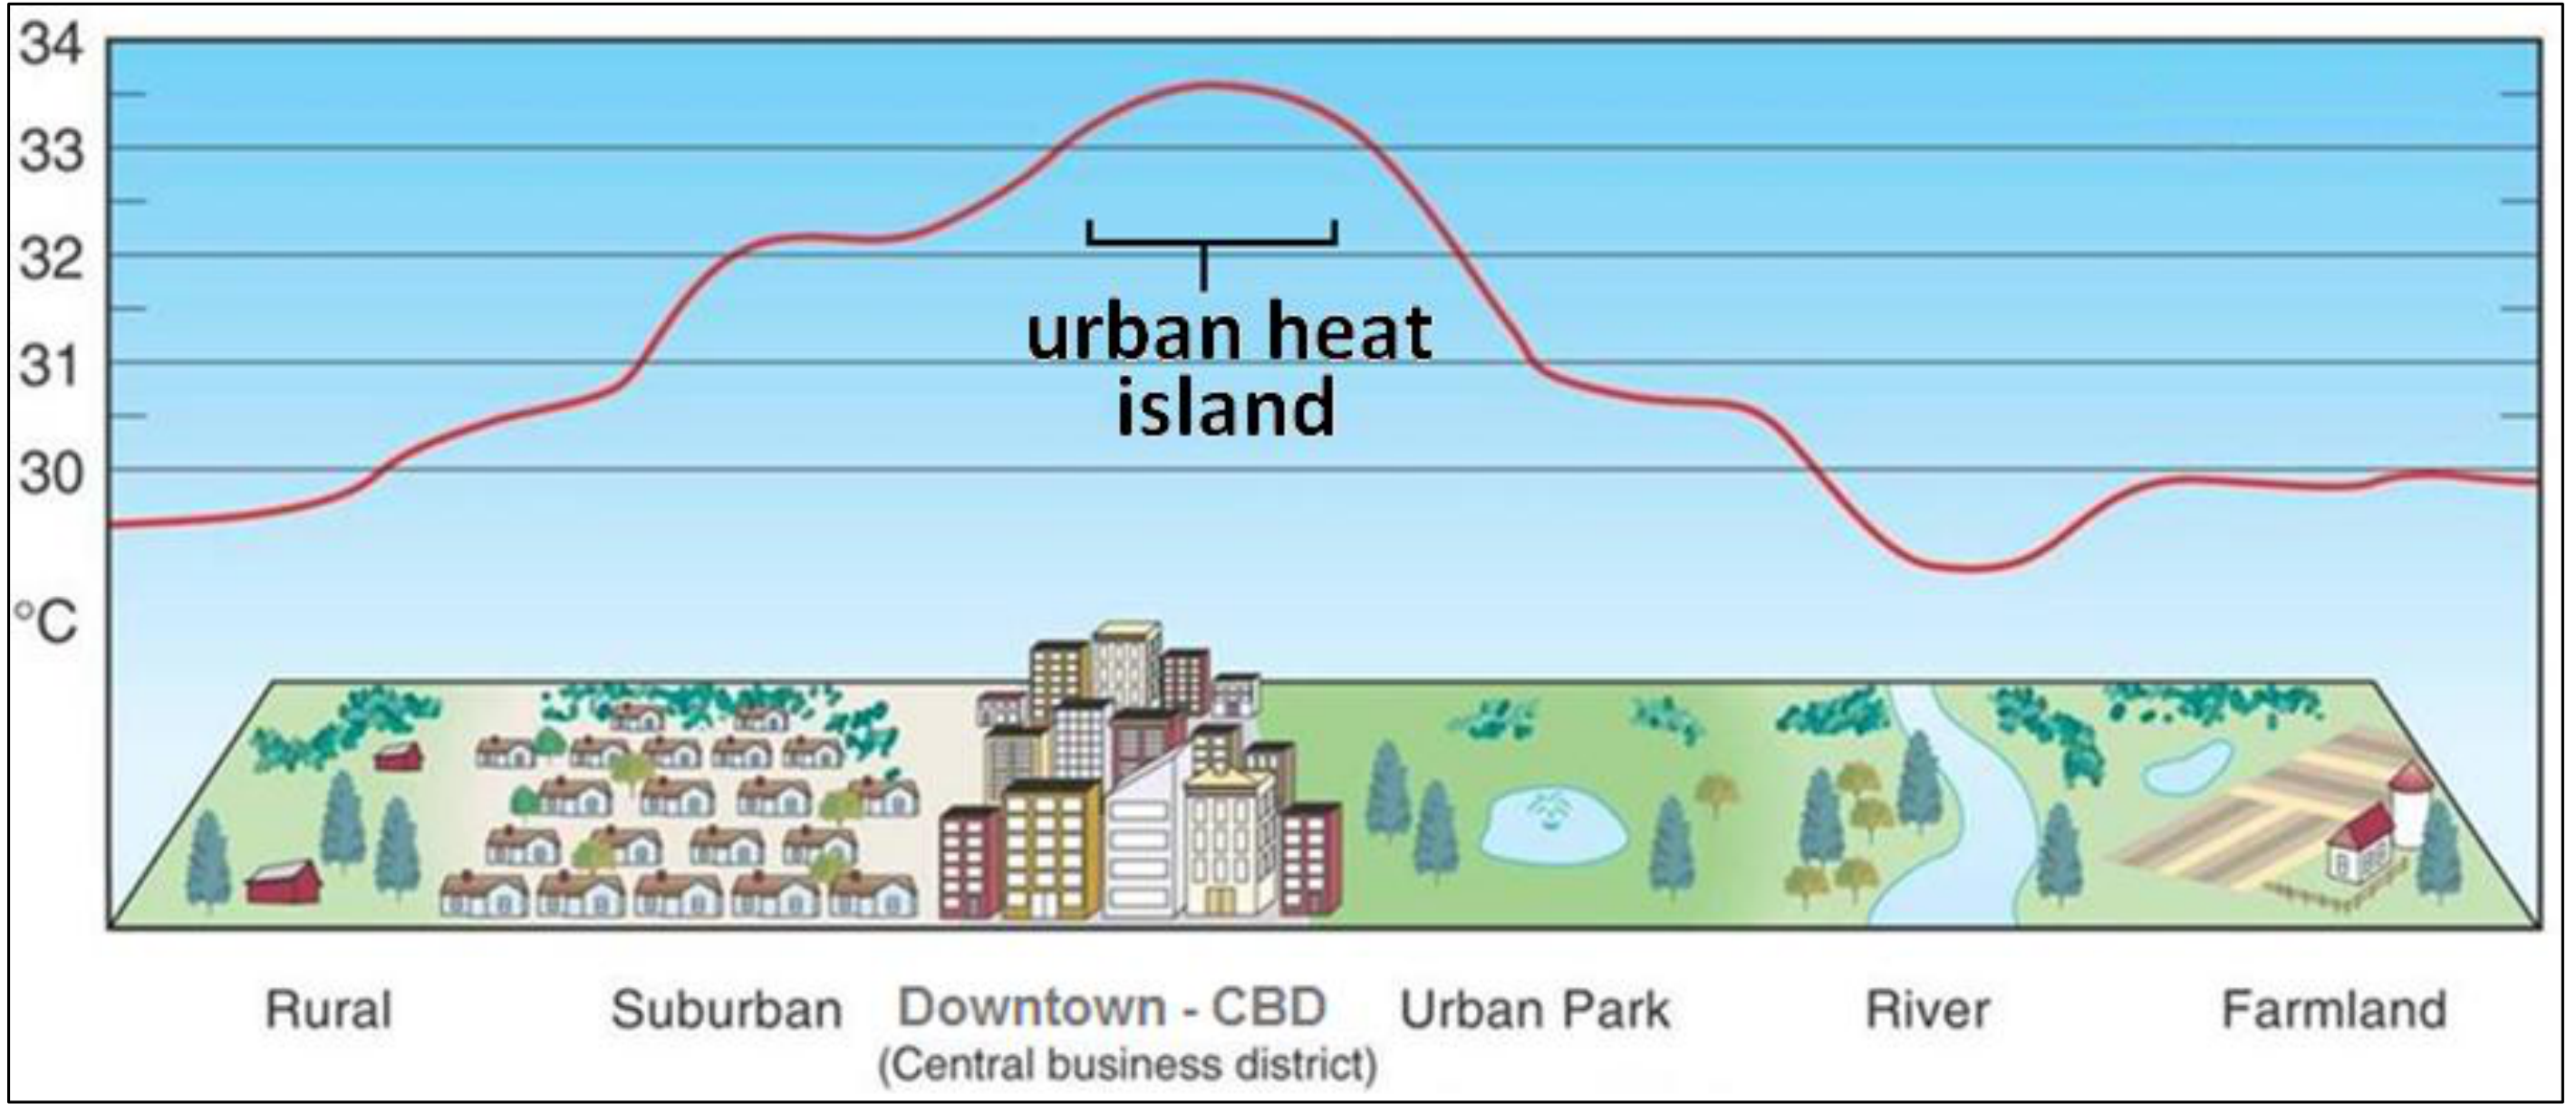
The diagram shows the typical temperature profile due to the urban heat island effect (UHIE). Which of the following statements is correct?
A. increasing building intensity reduces UHIE
B. the multiple reflection of sunshine is a cause of UHIE in CBD
C. UHIE effect is evident in windy environments
D. urban greening increases UHIE
Отговори
- B
Решение
ANSWER CODE: B
Оригинал в Архива: 2014MMtest.pdf · официални решения: 2014MManswercodes.pdf