iGeo 2015, Теренна работа — Задача 1.1. Residential population density of a Staritsa town block
Residential population density of a Staritsa town block · 4 т.
Source scope
The archived review gives the complete task-specific assessment, field estimates, comments and statistics. The estimates depend on the 2015 field observations; the other fieldwork tasks’ marking material is excluded.
Условие
TIME LIMIT 30 MINUTES. 4 MARKS MAXIMUM
Your task is to calculate the residential population density of the town block shown on the map (FIG. 1 – the area within dotted borders).
HINTS&TIPS
- To calculate density: first, walk around the area, count the number of inhabited dwellings in the area and then calculate the population on the basis that the average size of a household is 2.7.
- There are three main types of residential buildings in Staritsa (FIGS.2-4). Some dwellings are vacant or abandoned. Do not include these.
- Some buildings are not used for housing.
- Estimate the area using the map scale
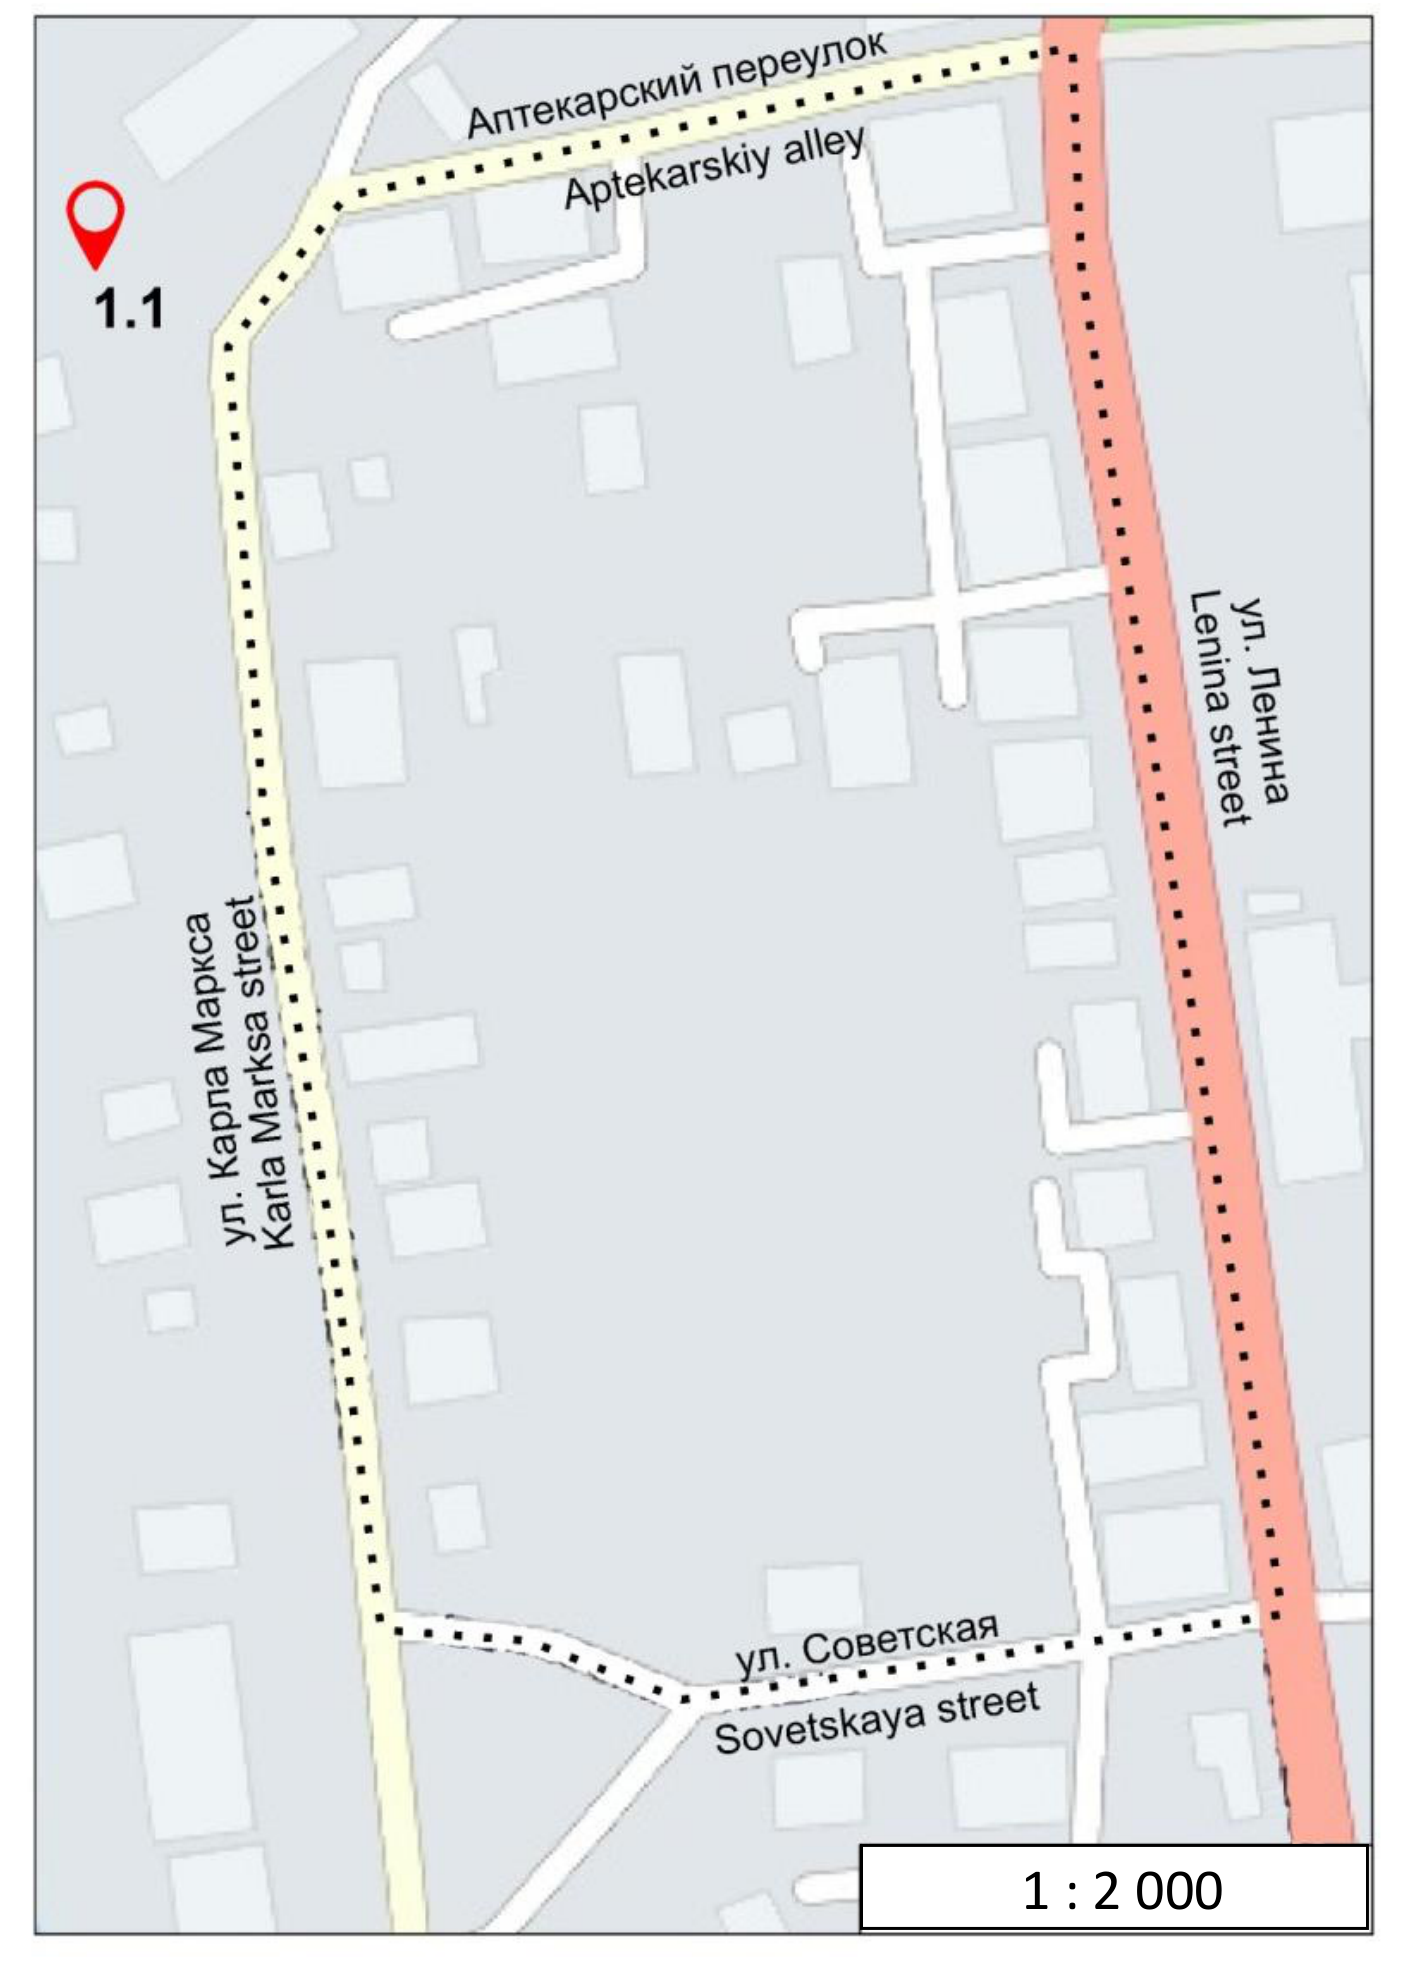
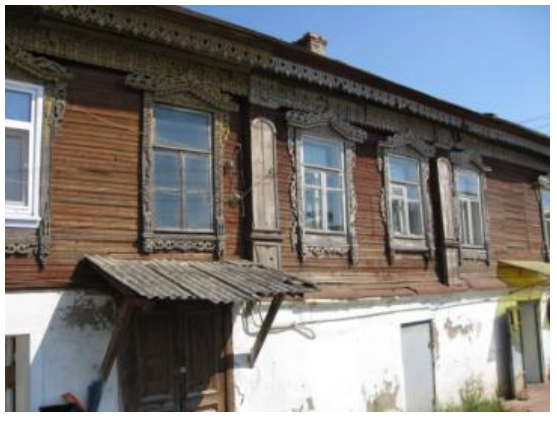
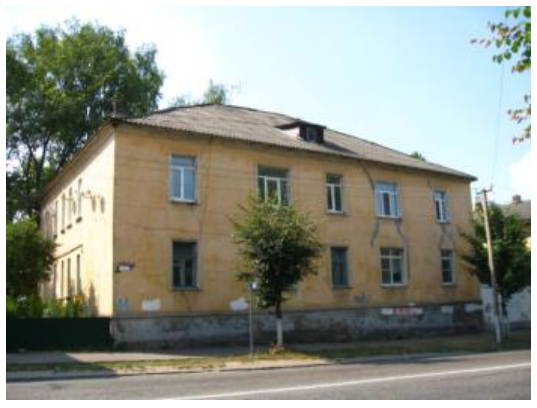
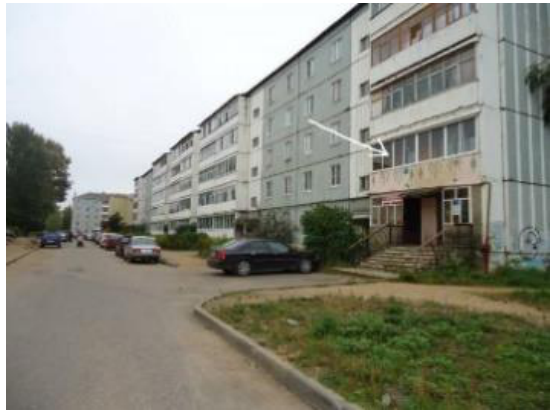
NOTES AND CALCULATIONS (you must show working)
ANSWER
Density of population within the town block (town quarter):
inhabitants per ha
Отговори
- 32.6 inhabitants per ha
Решение
The FWE1/1 task required students to observe a low-medium density area of residential development, assessing the type and number of dwellings in an older part of Staritsa. The size of the block needed to be calculated in the field using the scale statement. The calculations and estimated residential density were assessed. The calculation used the 2.7 average number of persons per household as ‘given’. The field data was supported by a Staritsa Population density map on page 10 of the Resource book and this geographical information was designed for use in FWE2/3.
FWE1/1 (marked out of 4)
Marking jury: Wei Dongying and Lex Chalmers (replacing Tricia Seow)
The assessment was based on evidence of (a) effective field observation and (b) completion of simple calculations.
Evidence of working was required, particularly (i) an estimate of households at around 46 giving a total population number of 124 (2.7*46), and (ii) an area estimate of around 3.8ha.
The optimal estimate of the density of the block became 46 households at an average of 2.7 persons per household (124) living an area of 3.8ha. The calculated density was therefore 32.6 persons per hectare (33/ha). Three marks were available for calculated estimate of population density.
3 marks for result in range of 121-127 for the total population and a density of 27.5- 37.5/ha. This estimate recognises accurate observation (124/3.8) and calculation.
2 marks for result in range of 117-131 for the total population and a density of 22.5- 42.5/ha. This estimate recognises acceptable observation (124/3.8) and calculation.
1 mark for result in range of 17.5 – 47.5/ha recognises the student probably has some idea of the expected range, can do calculation but has made some error in observation or estimation.
One additional mark was available for estimation processes. In many cases the mark was automatic if the calculation was correct. For all students, 1 mark was available if they include either evidence of a dwellings count between 40 and 50 or an area estimate between 3.5 and 4.0 hectares
Comments. While most students were reasonably close in terms of their observation and summation of dwelling numbers, a surprising number had no idea how to estimate area given a map drawn to scale. This was a surprising outcome. FWE1/1 turned out to be the most discriminating in FWE1.
Statistics
| Min | Max | Mean | Std |
|---|---|---|---|
| 0.0 | 4.0 | 1.49 | 1.35 |
Оригинал в Архива: 2015FWE1task1.pdf · решение от архива: 2015FWEMarking.pdf