iGeo 2021, Теренна работа, част II — Задача 2.1. Task 2.1 - Calculate the population density of sites near Ataturk urban forest
17th International Geography Olympiad, Istanbul, Turkey, 10-16 August 2021 — Fieldwork Exercise Part II — Tasks and Resources · 10 август 2021 г. · 6 т.
Условие
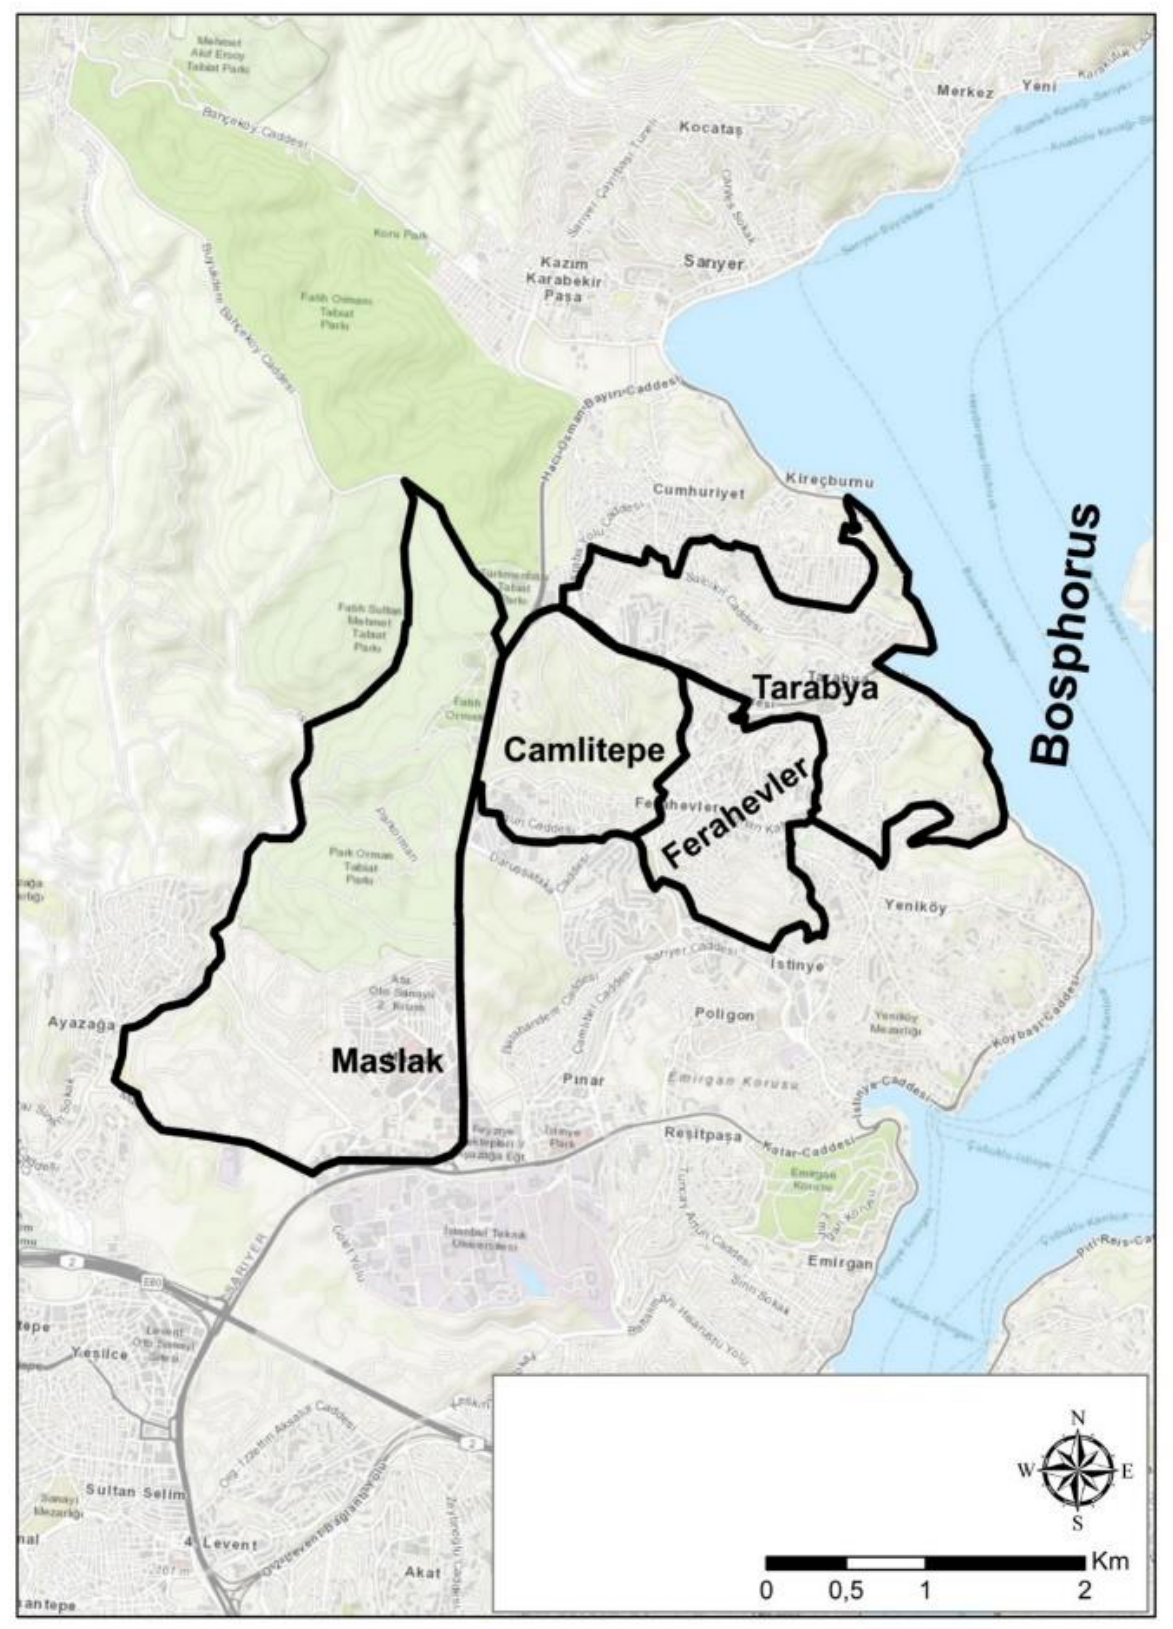
Table 1. Some information about the four neighbourhoods
| Tarabya | Maslak | Camlitepe | Ferahevler | |
|---|---|---|---|---|
| Total population (persons) (2020 data) | 17,710 | 9,895 | 5,885 | 15,417 |
| Young / Middle aged / elderly (ratio) | 27% / 55% / 18% | 31% / 62% / 7% | 33% / 55% / 12% | 33% / 55% / 13% |
| Persons per household | 2.91 | 2.31 | 3.42 | 3.34 |
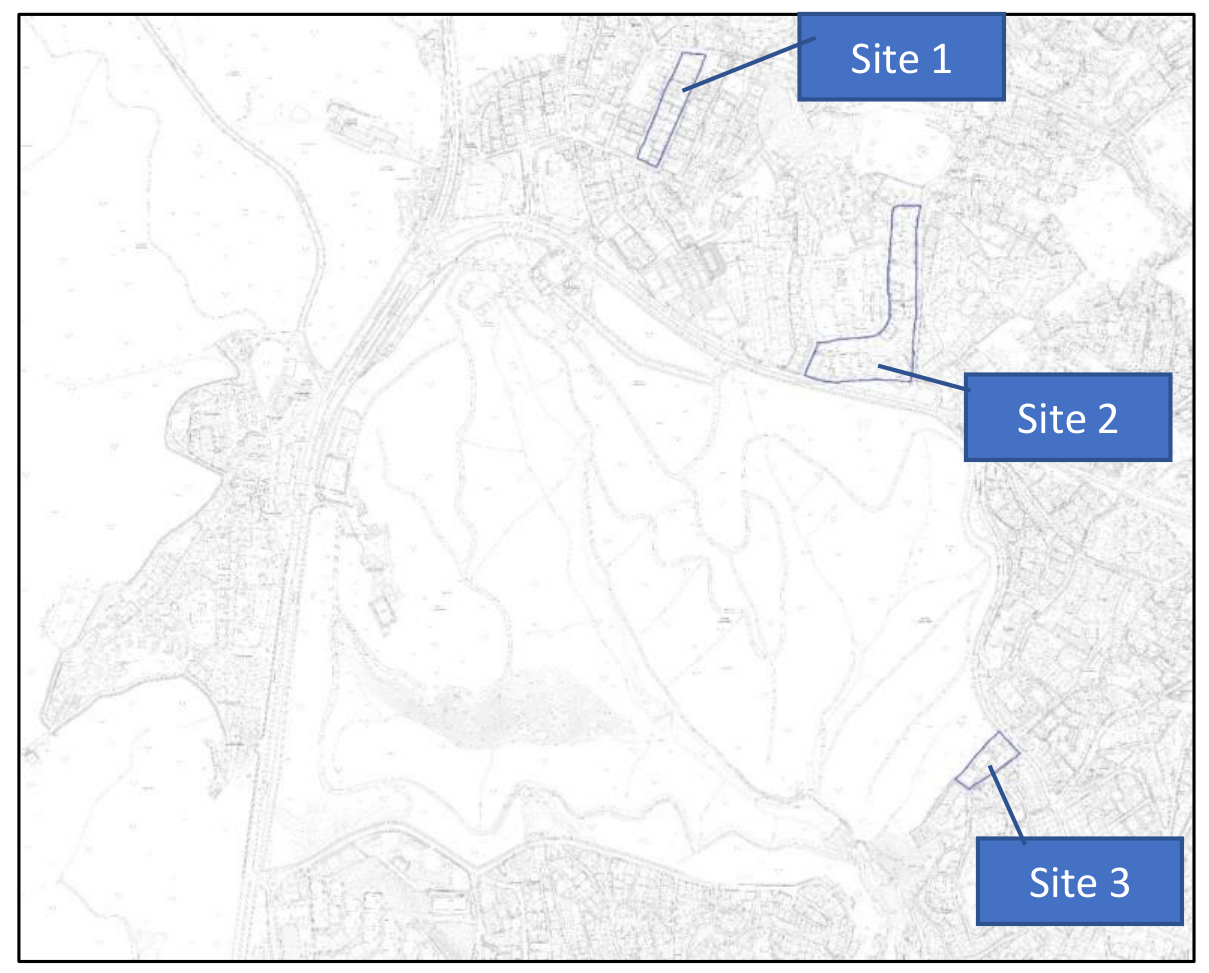
For more details about sites 1-3 see next three slides.
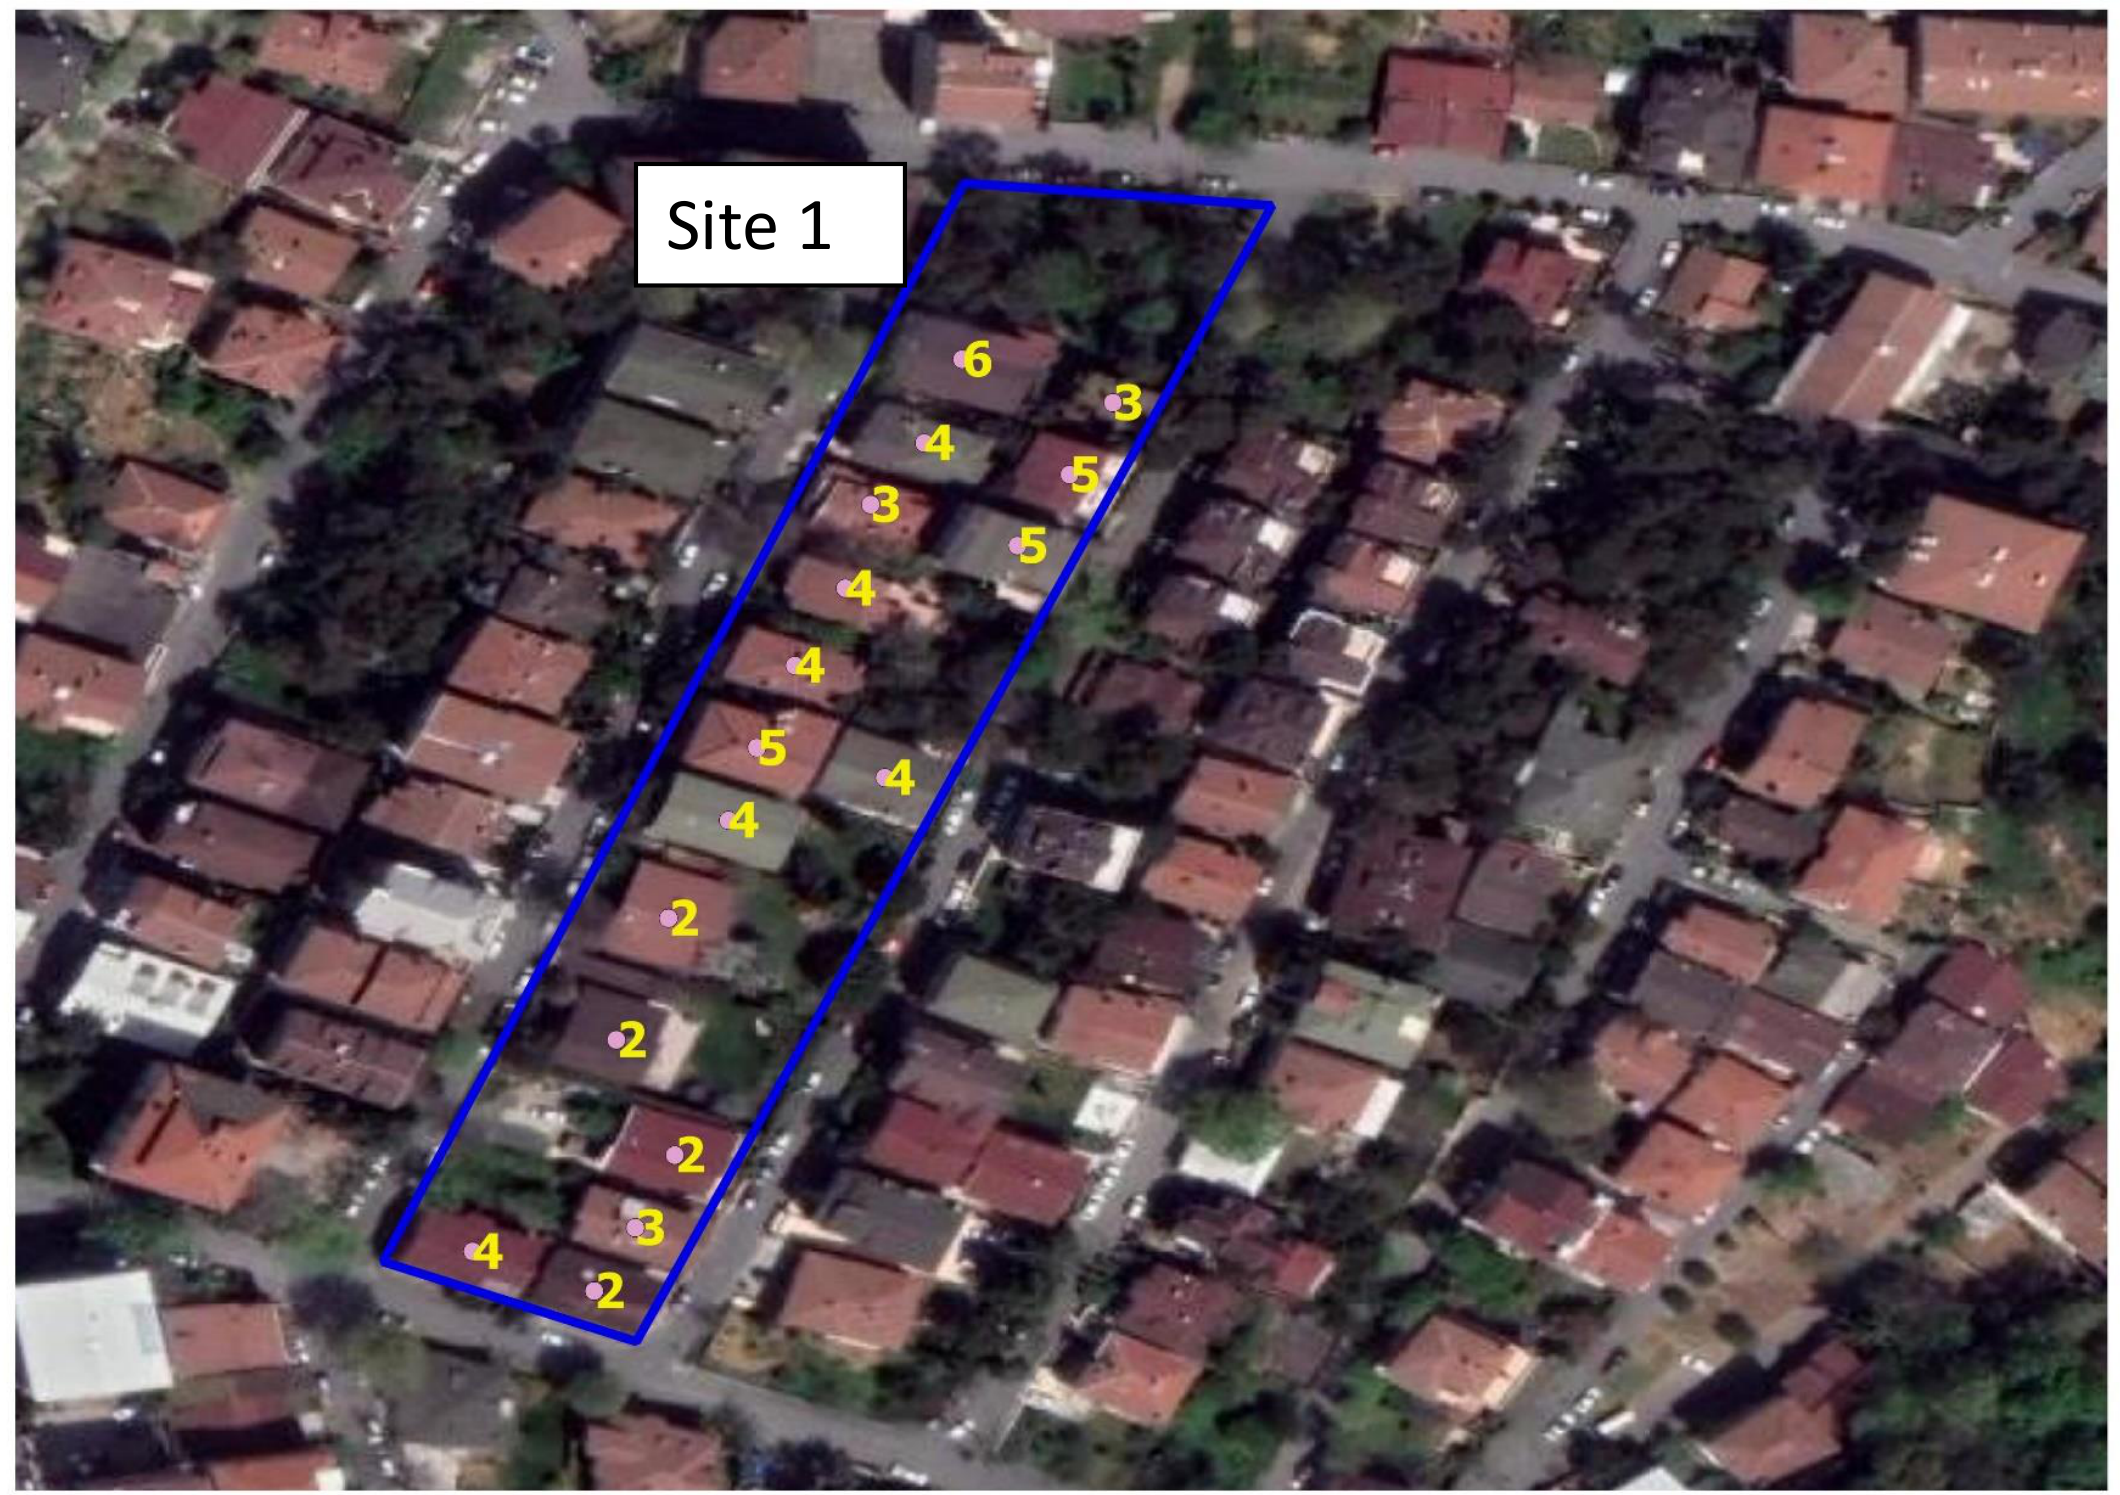
Task 2.1 - Site 1
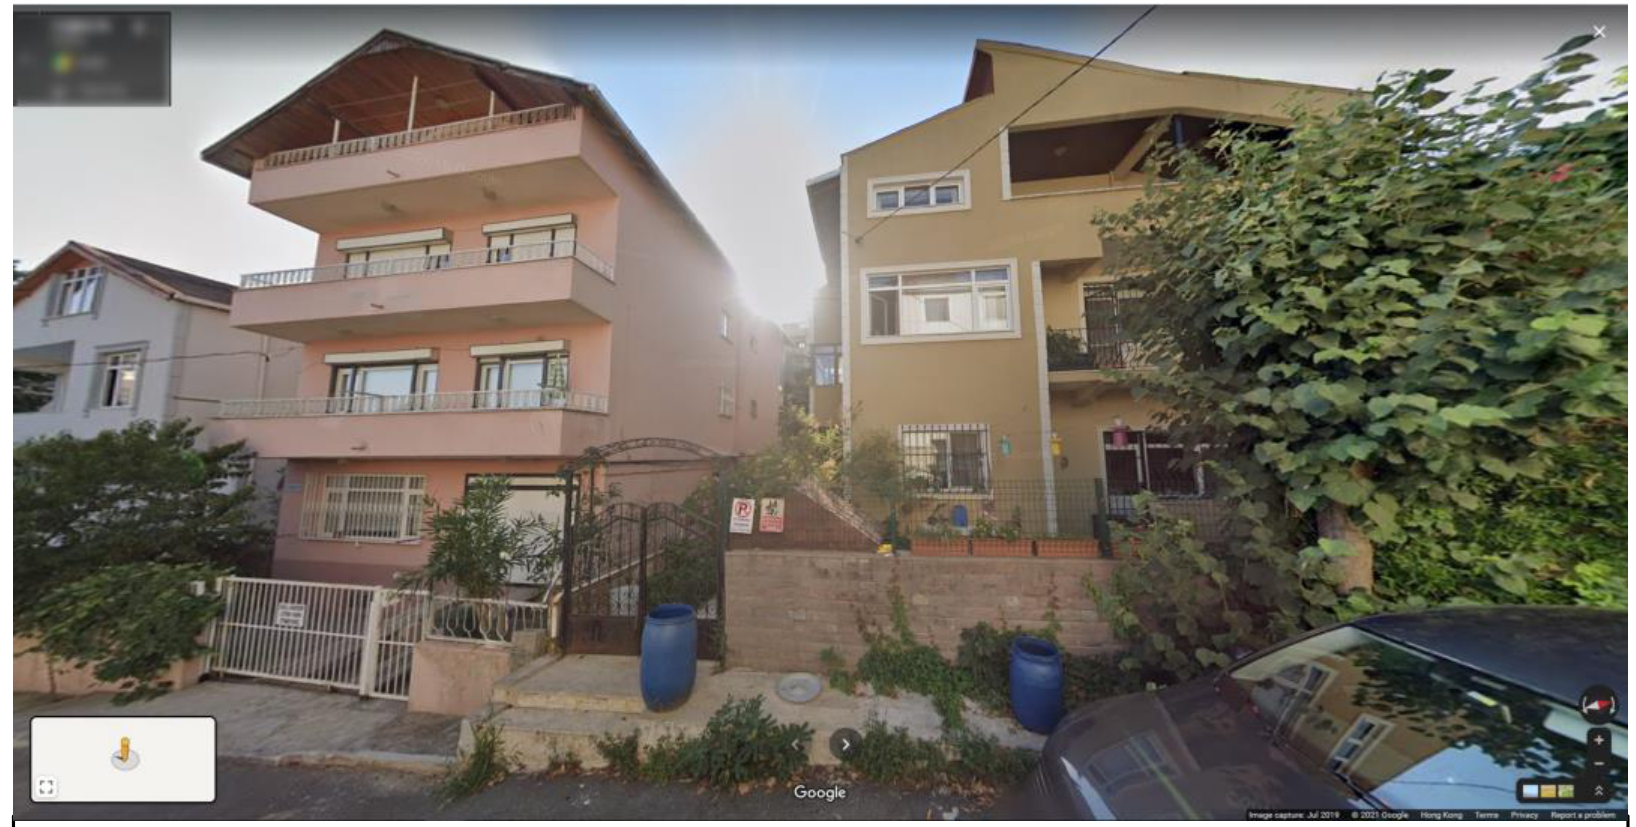
Most common housing type in this site:
Estimated number of families living in this housing type: 1 family per floor
Note: The number represents the number of floors.
| Task 2.1 - Site 1 | Write your answers in the table on the response sheet: |
|---|---|
| A. Estimated site area: | |
| B. Estimated population: | |
| C. Estimated population density of this site: |

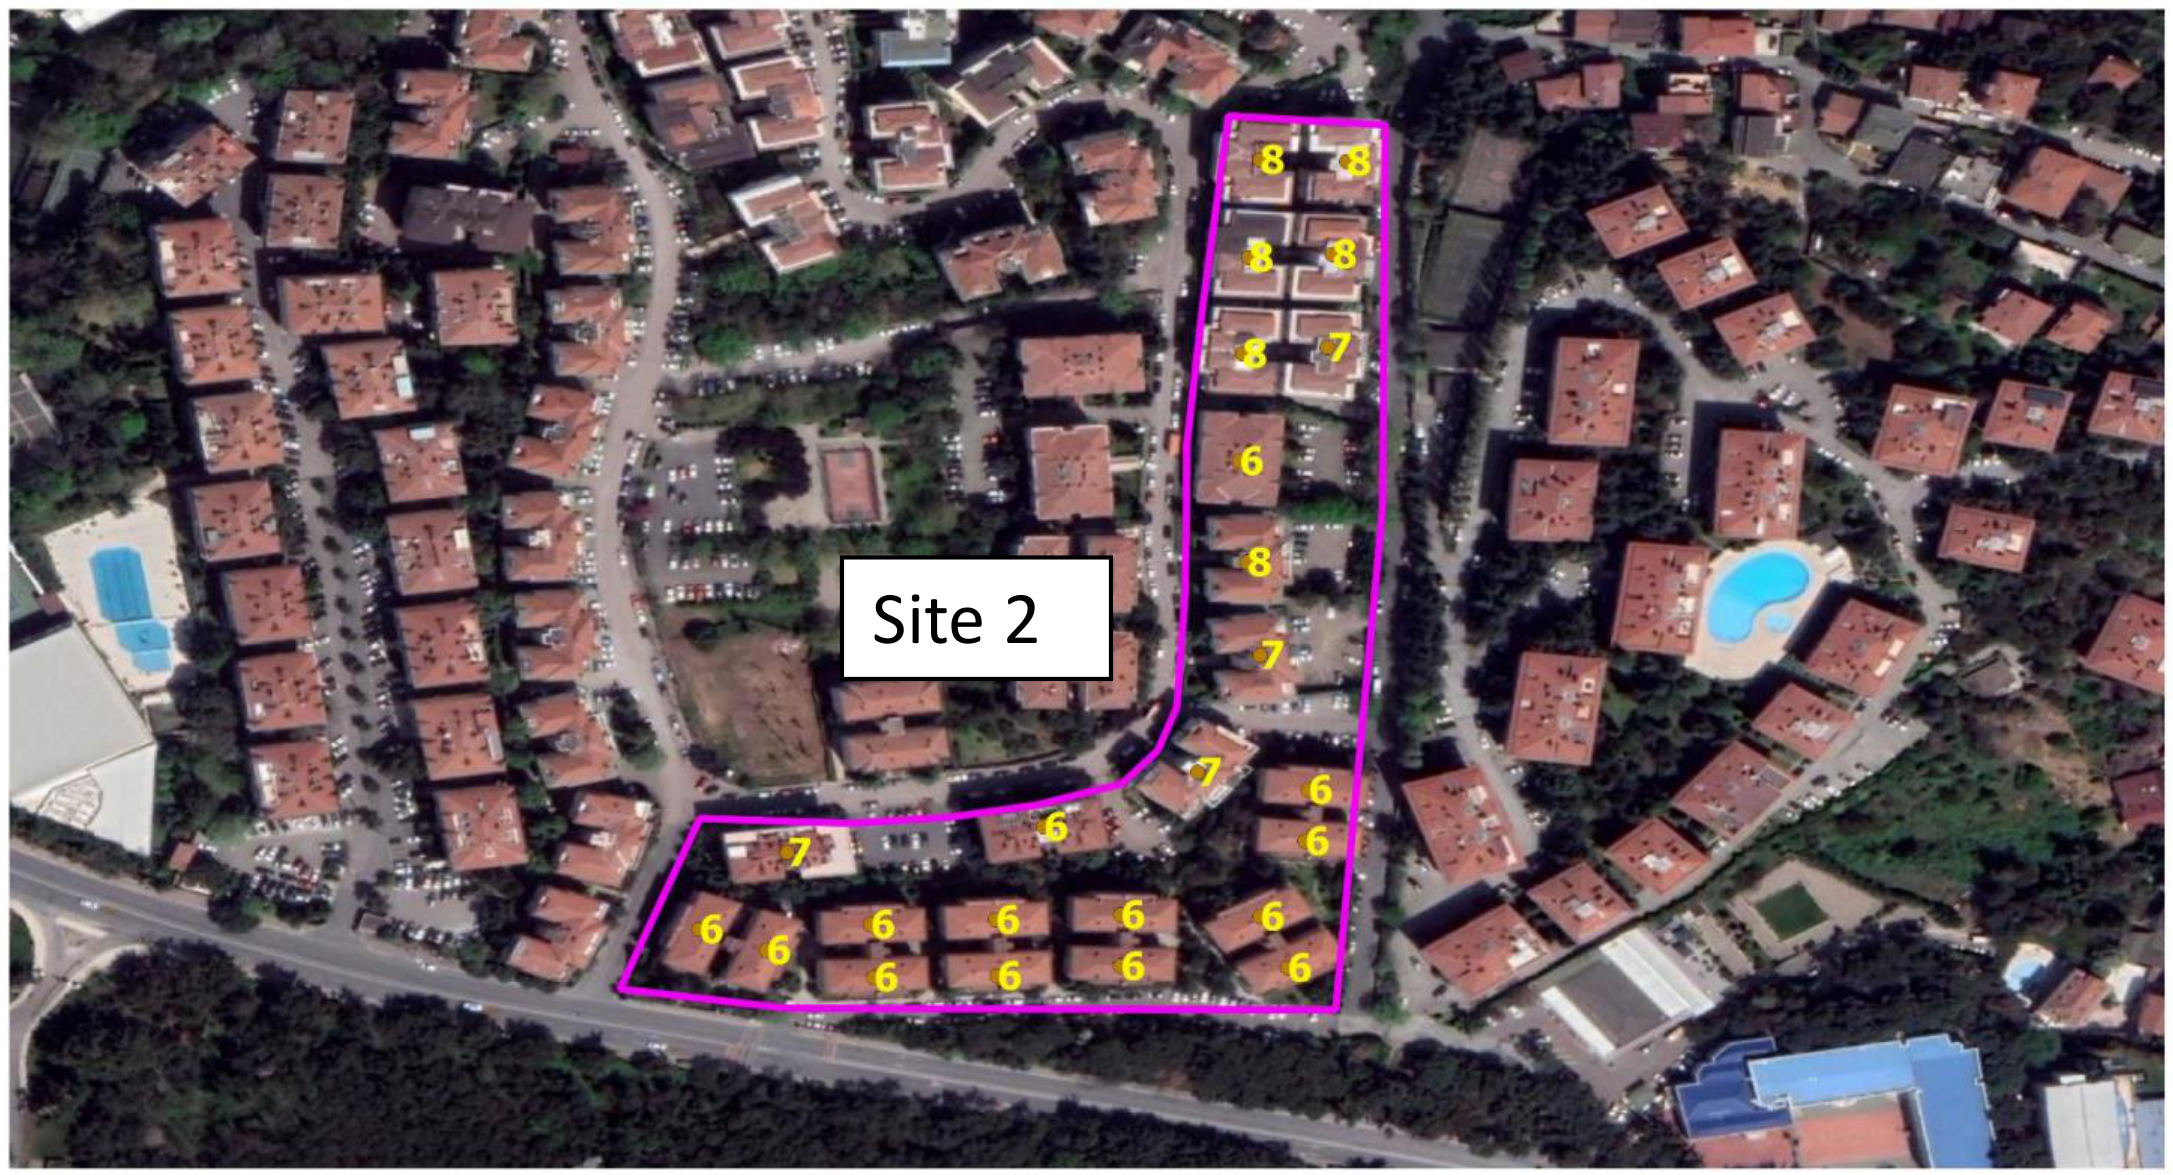
Task 2.1 - Site 2
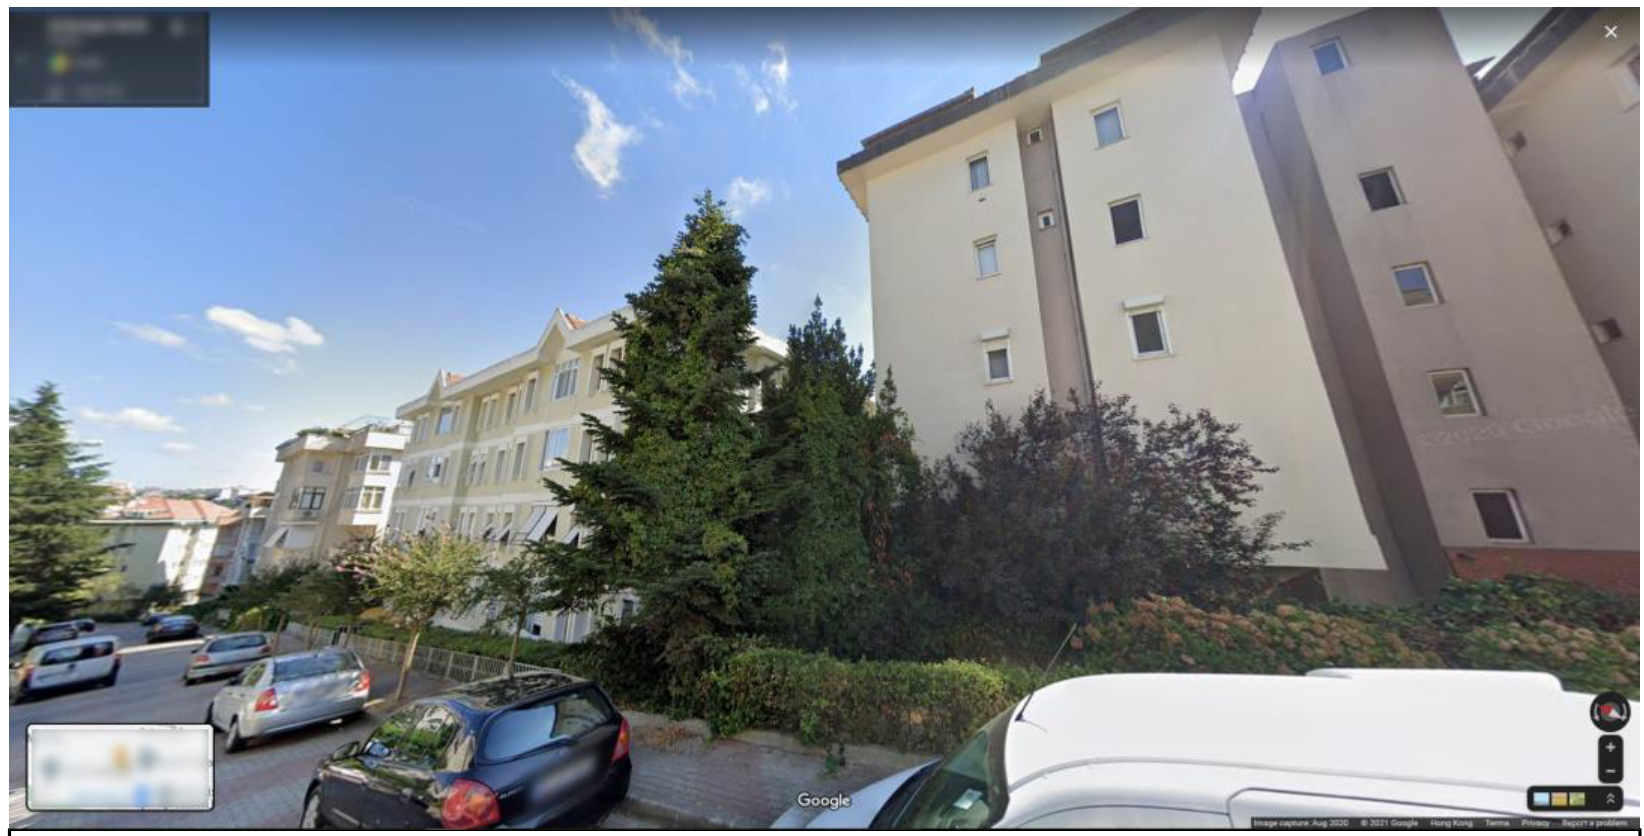
Most common housing type in this site:
Estimated number of families living in this housing type: 4 families per floor
Note: The number represents the number of floors.
| Task 2.1 - Site 2 | Write your answers in the table on the response sheet: |
|---|---|
| A. Estimated site area: | |
| B. Estimated population: | |
| C. Estimated population density of this site: |

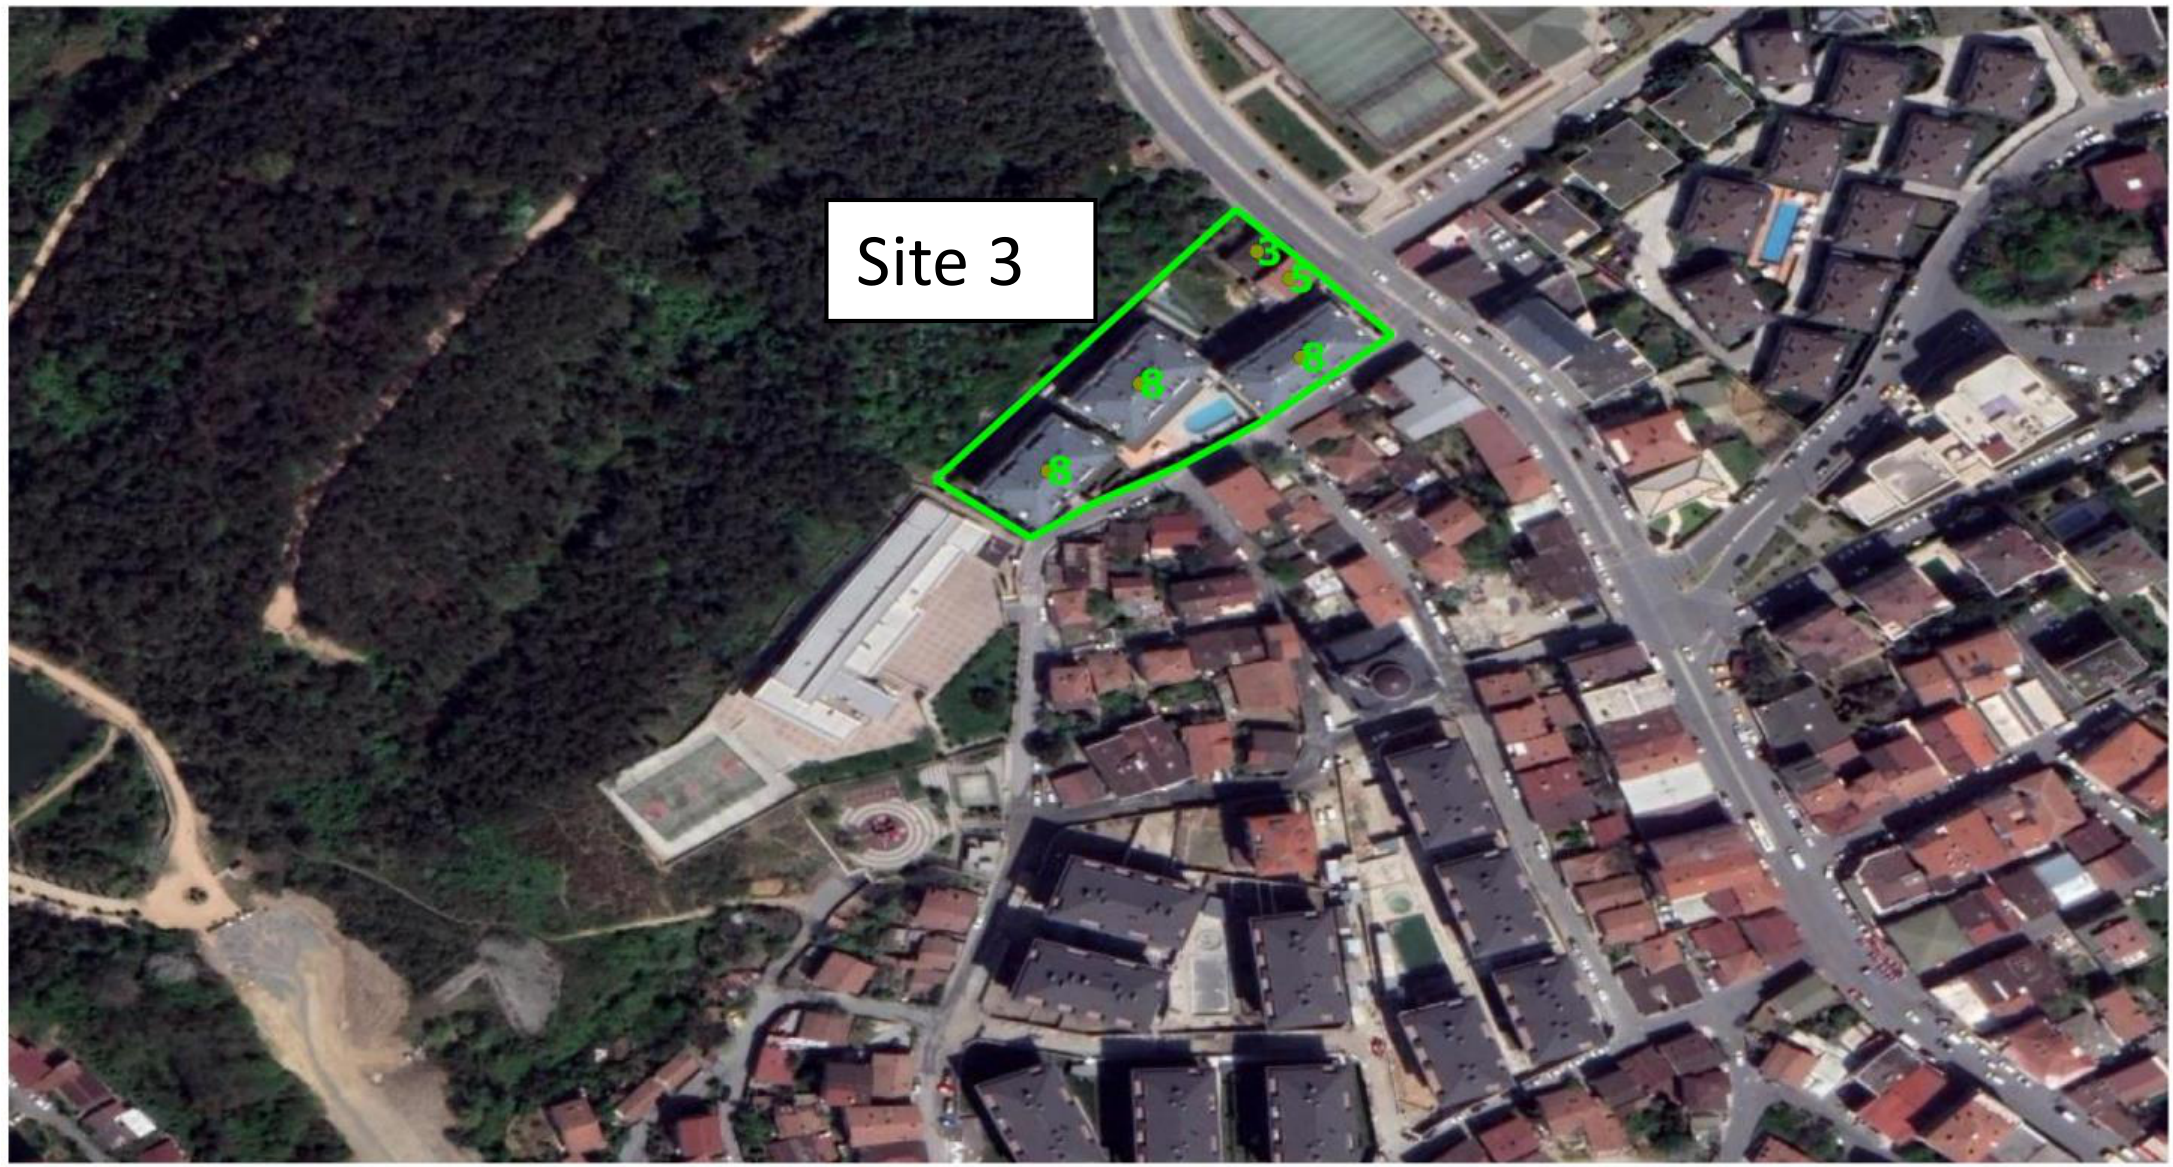
Task 2.1 - Site 3
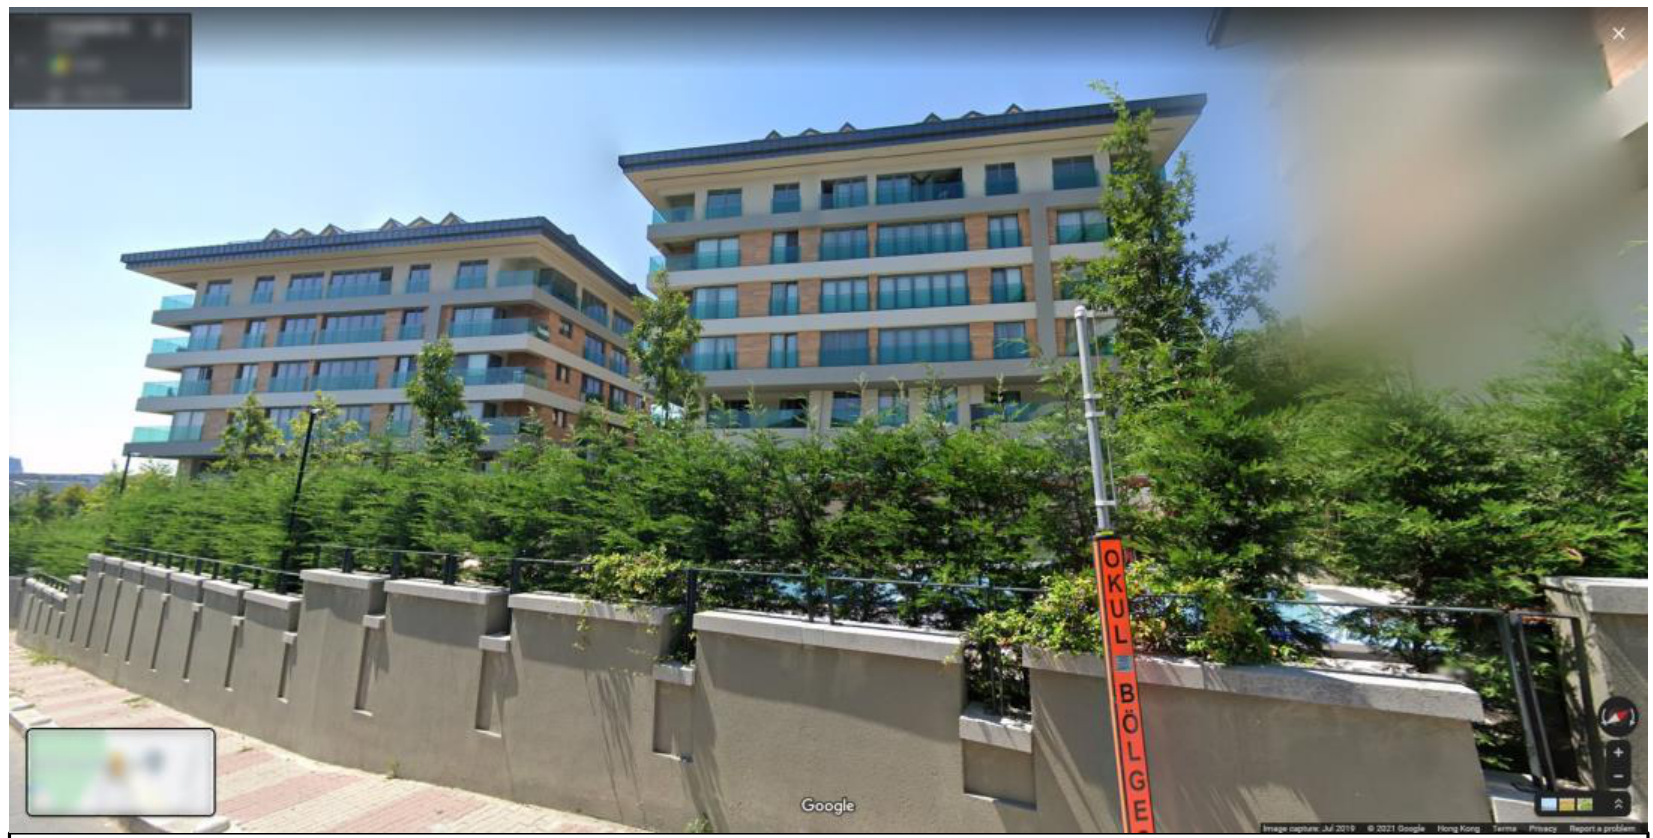
Most common housing type in this site:
Estimated number of families living in this housing type: 8 families per floor
Note: The number represents the number of floors.
| Task 2.1 - Site 3 | Write your answers in the table on the response sheet: |
|---|---|
| A. Estimated site area: | |
| B. Estimated population: | |
| C. Estimated population density of this site: |

Решение
Внимание: Непълно решение
В архива няма официално решение на тази задача.
End of Fieldwork Exercise Part II
Authors of FWE Part II: Alice S.Y. Chow, Alexey Naumov, Eyup Artvinli
Sources of information:
- Google Map, Google Earth Pro
- OpenStreet Map
- Endeksa Teknoloji A.Ş. (real estate data analytics platform) (https://www.endeksa.com/en)
Оригинал в Архива: iGEO_2021_FWE_II Tasks and resources.pdf