iGeo 2021, Мултимедиен тест — Задача 36. Question 36
iGeo 2021 MMT F2 · 1 т.
Question export
IGEO
IGEO17MMT
14 augustus 2021
iGeo 2021 MMT F2
Условие
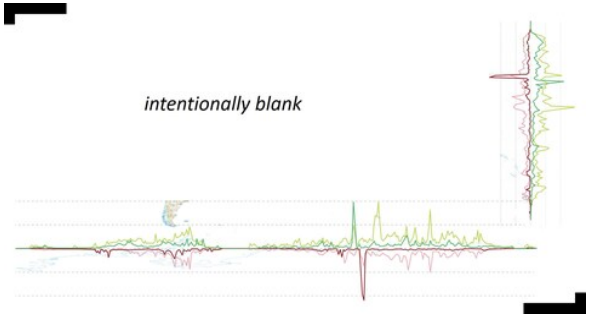
This pair of graphs shows which worldwide distribution?
A. Change in salinity (1970-1990).
B. Change in biomass (1960-2020).
C. Change in surface area of waterbodies (1980-2010).
D. Change in average surface temperature (1990-2020).
Отговори
- C
Решение
C. Change in surface area of waterbodies (1980-2010).
Answer-marked export
IGEO
IGEO17MMT
13 september 2021
iGeo 2021 MMT F2
Оригинал в Архива: iGeo_2021_MMT.pdf · решение от архива: iGeo_2021_MMT_ans.pdf