INPhO 2022, Теория — Задача 2
Indian Olympiad Qualifier in Physics (IOQP) 2021-2022 — Part II: Indian National Physics Olympiad (INPhO) · 13 март 2022 г. · 10 т.
Указания
This booklet consists of 4 pages and total of 5 questions. Write roll number at the top wherever asked.
Booklet to write the answers is provided separately. Instructions to write the answers are on the Answer Booklet.
Marks will be awarded on the basis of what you write on both the Summary Answer Sheet and the Detailed Answer Sheets in the Answer Booklet. Simple short answers and plots may be directly entered in the Summary Answer Sheet. Marks may be deducted for absence of detailed work in questions involving longer calculations.
Strike out any rough work that you do not want to be considered for evaluation. You may also use the space on the Question Paper for rough work – this will NOT be evaluated.
Non-programmable scientific calculators are allowed. Mobile phones cannot be used as calculators.
Please submit the Answer Booklet at the end of the examination. You may retain the Question Paper.
Условие
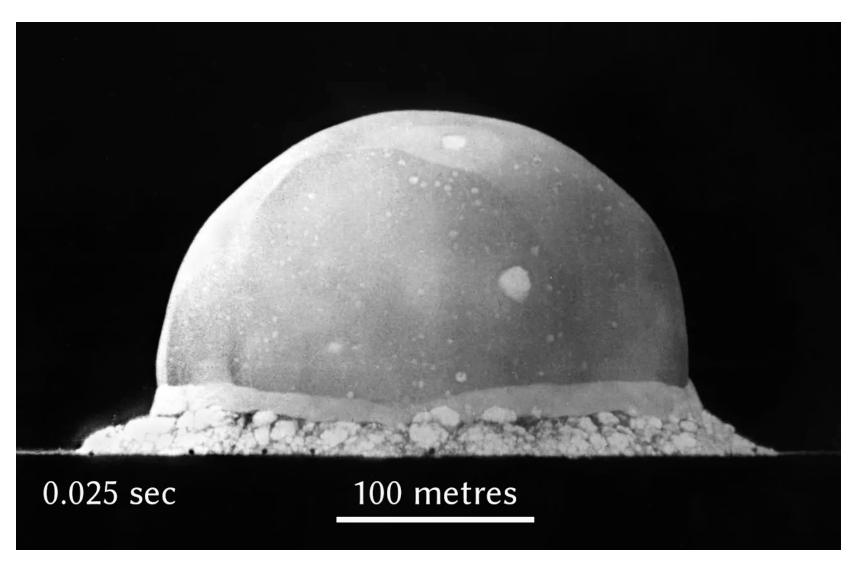
The first explosion of an atomic bomb was the Trinity test in New Mexico in 1945. This explosion released a very large amount of energy which created an expanding fireball (known as the Trinity fireball). A snapshot of this fireball taken after the explosion is shown in the photograph below.
A scientist, Prof. Geoffrey Taylor, could make an estimate of the energy released by the bomb from an analysis of such photographs. Here we try to follow in his footsteps, with some suitable simplifications.
To begin, we assume that the fireball is spherical in nature. Its radius () increases with time () depending on the explosion energy and the density of the surrounding air (which is taken as constant and uniform).
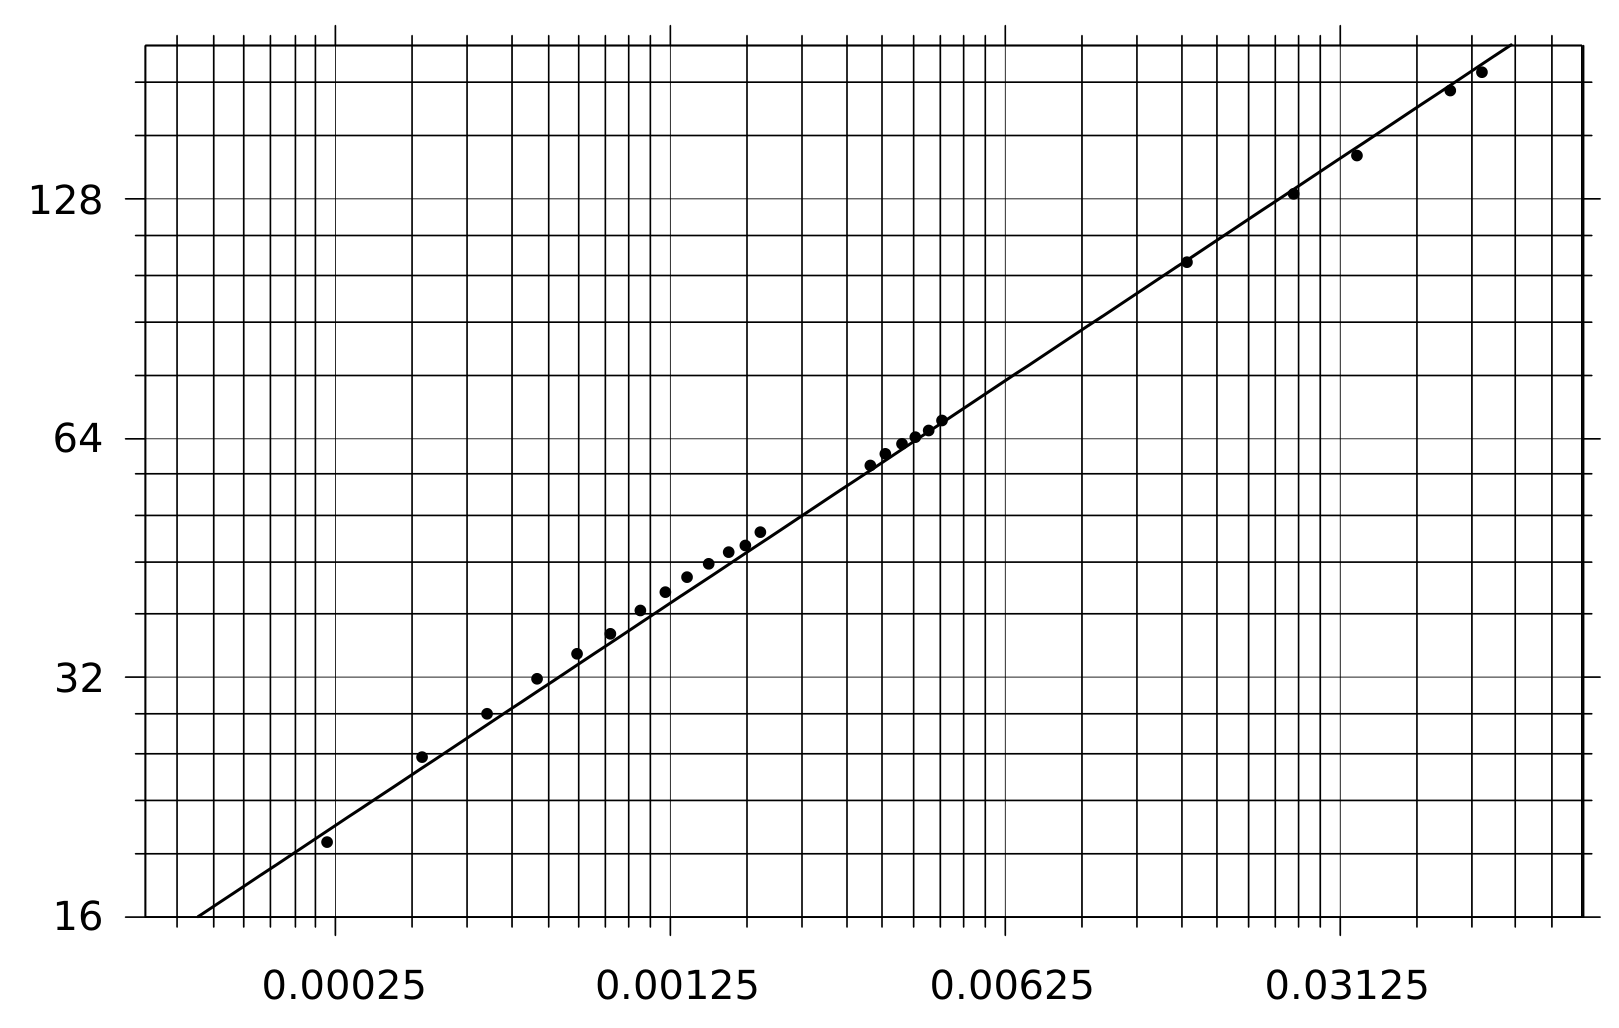
We are also given a graph of the data obtained by Prof. Taylor, as shown below. However, the axes labels of the graph are missing.
Given data:
1 kiloton (kt) of TNT
Density of air outside the fireball .
(a) What are the quantities represented by the axes of the graph? Also state the respective units in which they are expressed. In the detailed answer sheet, justify your answer. [3 т.]
(b) Find the slope () of the best fit line shown in the graph. What are the dimensions of the quantity ? [4 т.]
(c) From a dimensional analysis based on the above simplified model, make an estimate of the energy released (in kt of TNT) in the Trinity test. [3 т.]
Отговори
(a) Radius R (m) vs time t (s) on a log-log scale
(b) 0.43
The slope is dimensionless.
(c) 26 kt TNT
Official solution: E ≈ 26 kt TNT; the official yield estimate quoted there is 21 kt TNT.
Решение
(a) It is clear that this graph is on a log-log scale. Physical quantities which are involved: and time . Here and are constant. Possible answers can be vs , vs , or vs . We can get a relation between and and then verify from the slope of the straight line. Also, from the time and length scale given in the explosion picture tells us that at , is in between 100-200 m.
Thus, it is a (m) vs (s) plot on a log-log scale.
(b) We take two random points on the line passing through the grid. Then the slope of the graph is
The slope is dimensionless.
(c) Using the dimensional analysis, can be expressed as . Using the dimensions of the quantities involved,
According to the above equation, a plot of vs on a log-log scale will have a slope of 0.4. This we have already found in the previous part.
From , .
The yield of the Trinity test was officially estimated as 21 kt TNT.
Оригинал в Архива: IOQP2022-PartII-Questions-en.pdf · официални решения: IOQP2022-PartII-Solutions-20220503.pdf