INPhO 2022, Теория — Задача 4
Indian Olympiad Qualifier in Physics (IOQP) 2021-2022 — Part II: Indian National Physics Olympiad (INPhO) · 13 март 2022 г. · 7 т.
Указания
This booklet consists of 4 pages and total of 5 questions. Write roll number at the top wherever asked.
Booklet to write the answers is provided separately. Instructions to write the answers are on the Answer Booklet.
Marks will be awarded on the basis of what you write on both the Summary Answer Sheet and the Detailed Answer Sheets in the Answer Booklet. Simple short answers and plots may be directly entered in the Summary Answer Sheet. Marks may be deducted for absence of detailed work in questions involving longer calculations.
Strike out any rough work that you do not want to be considered for evaluation. You may also use the space on the Question Paper for rough work – this will NOT be evaluated.
Non-programmable scientific calculators are allowed. Mobile phones cannot be used as calculators.
Please submit the Answer Booklet at the end of the examination. You may retain the Question Paper.
Условие
A student performed an experiment to determine the acceleration due to gravity () using a simple pendulum which has a spherical bob of diameter hung with a long string. She varied the length of the string , and measured the period of oscillation every time. She calculated the value of from each measurement as shown in the table below.
She noticed that not only was the average value of smaller than the expected value, each one of the measurements had yielded a value smaller than the true value.
Next, she plotted a graph between and from the same data, and obtained the value of from the slope of the best fit line.
| (in cm) | (in s) | (in cm/s) |
|---|---|---|
| 20 | 0.93 | 912 |
| 40 | 1.29 | 948 |
| 60 | 1.58 | 948 |
| 80 | 1.81 | 963 |
| 100 | 2.02 | 967 |
| Average | 947 |
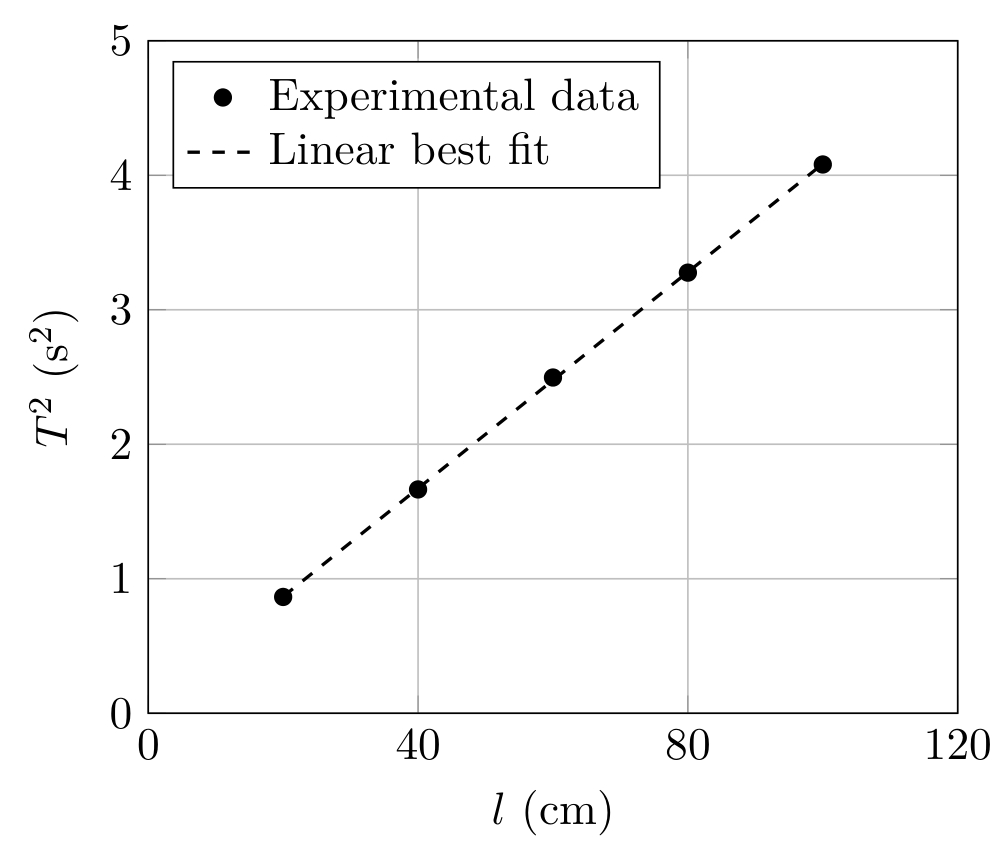
(a) What do you think might be the main cause for the consistently low values of that she obtained from each of her measurements? [3 т.]
(b) Explain in detail why she still obtained a correct value of from the slope of the graph plotted from the same data. [4 т.]
Assume that the instruments of measuring time and length were accurate enough, and all the measurements of the stated quantities were correct within the accuracy of the instruments. It is verified that the graph and the linear best fit were correctly plotted, and all numerical calculations in the above are correct. Note that you are not expected to plot any graph (no graph paper is provided to you).
Отговори
- (a) The student recorded only the length of the string and did not add the radius of the bob, so l (and hence g) was underestimated.
- (b) Omitting the bob radius only adds a constant intercept b = 4π²r/g to T² = al + b; the slope a = 4π²/g is unaffected.
Решение
(a) A low value of from the formula can result either from an underestimation of or an overestimation of .
The latter can happen in case of either a fast-running clock (stopwatch) or a consistent error in the measurement. We are told that the instruments were accurate and the measurements were properly made. So this possibility is ruled out.
Under the given assumption that the measurements of were accurate, the only way that the value of can be underestimated systematically is by ignoring the size of the bob of the pendulum. Since the student recorded only the length of the string, and did not add the radius of the bob, this caused an underestimation of , and consequently, of .
(b) When is plotted against , one should obtain a linear graph of the form
where, in the ideal case, represents the distance of the centre of mass of the bob from the suspension point, the slope , and the intercept .
If the size of the bob is not included in the measurement of , one should still get a linear graph, with same value of , but now with , where is the radius of the bob. Careful inspection of the graph indeed shows a positive intercept on the -axis, confirming this scenario. However, since the slope of the line is unaffected by the underestimation of , the value of is still correctly determined from the slope.
Note that an overestimation of by , say, would have caused the slope of the graph, and hence the derived , to change since would have been modified by a term proportional to itself.
Оригинал в Архива: IOQP2022-PartII-Questions-en.pdf · официални решения: IOQP2022-PartII-Solutions-20220503.pdf