INPhO 2023, Теория — Задача 5. If Prof. Snell had a smartphone
Indian National Physics Olympiad (INPhO)-2023 — Question Paper · 29 януари 2023 г. · 16 т.
Указания
Date: 29 January 2023
Time: 09:00-12:00 (3 hours) Maximum Marks: 60
Instructions Roll No.:
- This booklet consists of 6 pages and total of 5 questions. Write roll number at the top wherever asked.
- Booklet to write the answers is provided separately. Instructions to write the answers are on the Answer Booklet.
- Non-programmable scientific calculators are allowed. Mobile phones cannot be used as calculators.
- Please submit the Answer Sheet at the end of the examination. You may retain the Question Paper.
Table of Constants
| Speed of light in vacuum | ||
| Planck’s constant | ||
| Universal constant of Gravitation | ||
| Magnitude of electron charge | ||
| Rest mass of electron | ||
| Value of | ||
| Avogadro’s number | ||
| Acceleration due to gravity | ||
| Universal Gas Constant | ||
| Boltzmann constant | ||
| Permeability constant | ||
| 1 Angstrom unit | 1Å | |
| 1 micro unit | units | |
| 1 electron volt | 1 eV |
| Q No | 1 | 2 | 3 | 4 | 5 | Total |
|---|---|---|---|---|---|---|
| Maximum Marks | 6 | 6 | 16 | 16 | 16 | 60 |
Указания
Date: 29 January 2023
Time: 09:00-12:00 (3 hours) Maximum Marks: 60
Instructions Roll No.:
- This booklet consists of 19 pages and total of 5 questions. Write roll number at the top wherever asked.
- Booklet to write the answers is provided separately. Instructions to write the answers are on the Answer Booklet.
- Non-programmable scientific calculators are allowed. Mobile phones cannot be used as calculators.
- Please submit the Answer Sheet at the end of the examination. You may retain the Question Paper.
Table of Constants
| Speed of light in vacuum | ||
| Planck’s constant | ||
| Universal constant of Gravitation | ||
| Magnitude of electron charge | ||
| Rest mass of electron | ||
| Value of | ||
| Avogadro’s number | ||
| Acceleration due to gravity | ||
| Universal Gas Constant | ||
| Boltzmann constant | ||
| Permeability constant | ||
| 1 Angstrom unit | 1Å | |
| 1 micro unit | units | |
| 1 electron volt | 1 eV |
| Q No | 1 | 2 | 3 | 4 | 5 | Total |
|---|---|---|---|---|---|---|
| Maximum Marks | 6 | 6 | 16 | 16 | 16 | 60 |
Please note that alternate/equivalent methods and different way of expressing final solutions may exist. A correct method will be suitably awarded.
Условие
A typical smartphone screen is made up of mainly two components: a sheet of touch-sensitive glass (where you move your finger to operate the phone) of thickness at the top and a LCD screen below it consisting of a regular array of “RGB elements” that emit light. These elements have a separation of between them. There is a thin air gap of depth between the touch-sensitive glass and the LCD screen (see Fig. (1)for a cross sectional view). We estimate the value of from the following experiment.
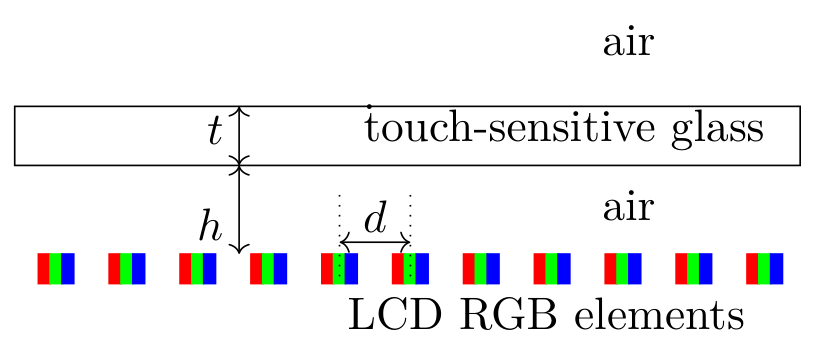
We use two smartphones (S-I and S-II) in this exercise – S-I is the target instrument in which we want to estimate , and S-II is the measuring instrument that can capture photos of the screen of S-I which we then analyse using a image-processing software.
A digital image captured by the camera of a smartphone (S-II here) consists of discrete picture elements called pixels. The image captured by S-II is processed through a software. A red color reference line is drawn on the image (see Fig. 3(a)). The software plots the “brightness value” at every point of the reference line as a function of the number of pixels from the left end of the line. Thus, pixel number is a marker for distance here. First, we need to calibrate distance in terms of pixel number.
The phone S-I is kept horizontal and the display is kept ON. A ruler is placed on its screen. S-II is fixed above S-I to capture images. The image of the screen captured is shown in Fig (2).
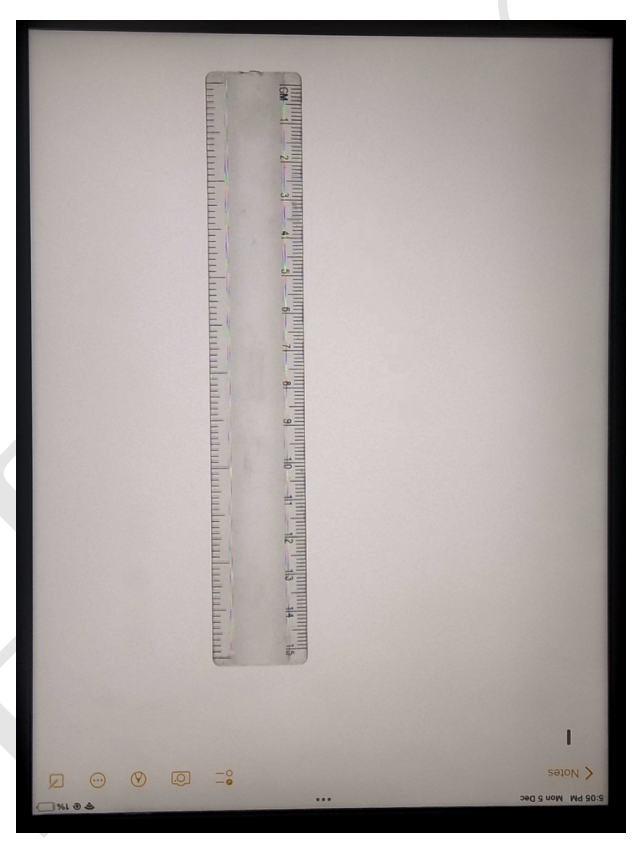
Figure 3(a) shows a part of the image of the ruler and its brightness value profile along the red reference line in Fig. 3(b).
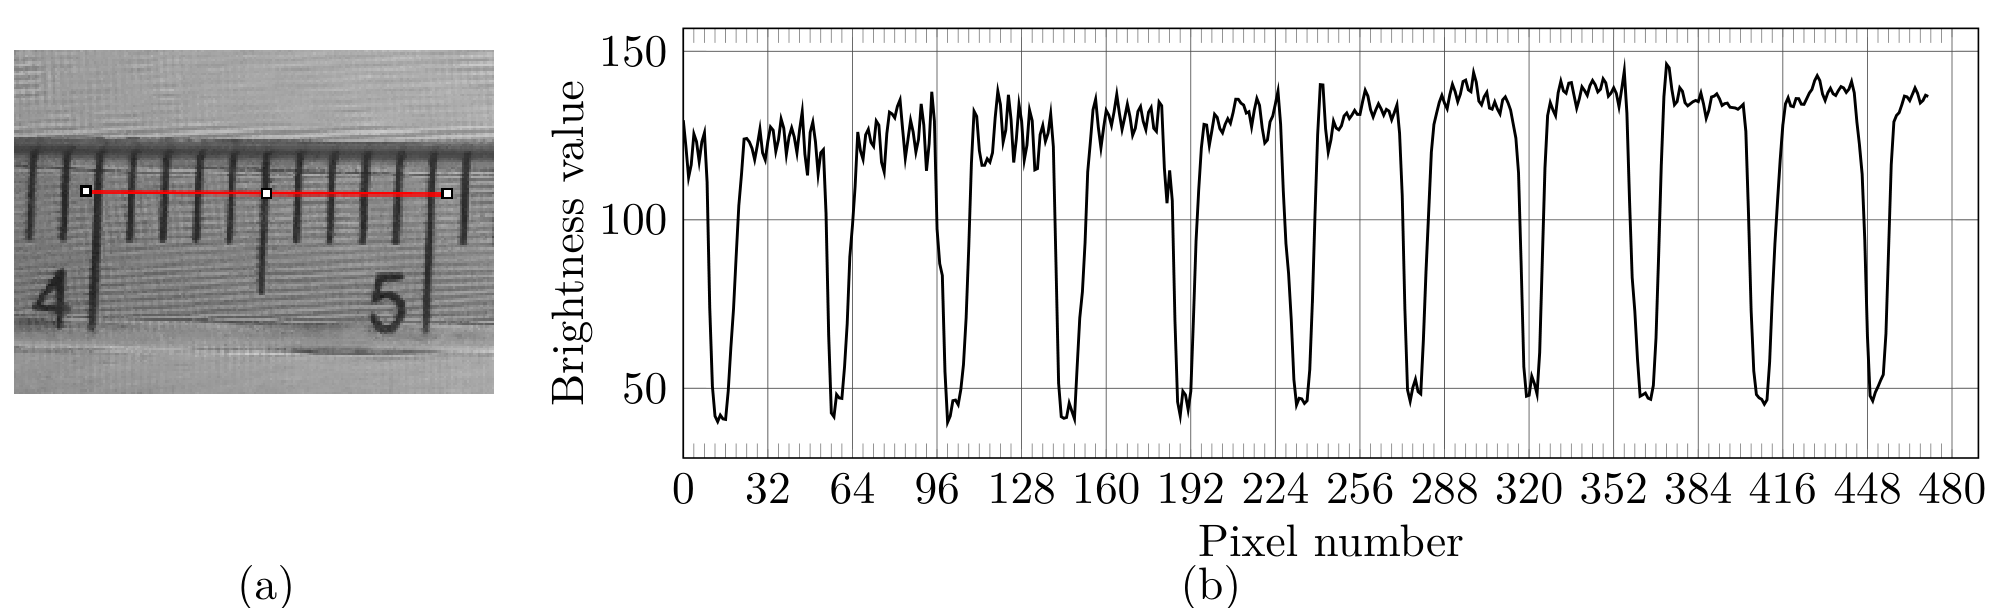
(a) [2 marks] State the number of pixels used by the camera of S-II to capture one centimeter of the screen of S-I.
(b) [5 marks] We keep the setup the same as the last part. Next, a few small water drops are placed on the glass screen of S-I beside the ruler (see Figs. 4(a) and 4(b) for a top and side view, respectively). We model every drop as a hemispherical lens of radius that magnifies the array of RGB elements of the LCD screen of S-I (see Fig. 4(c); the figure is not to scale).
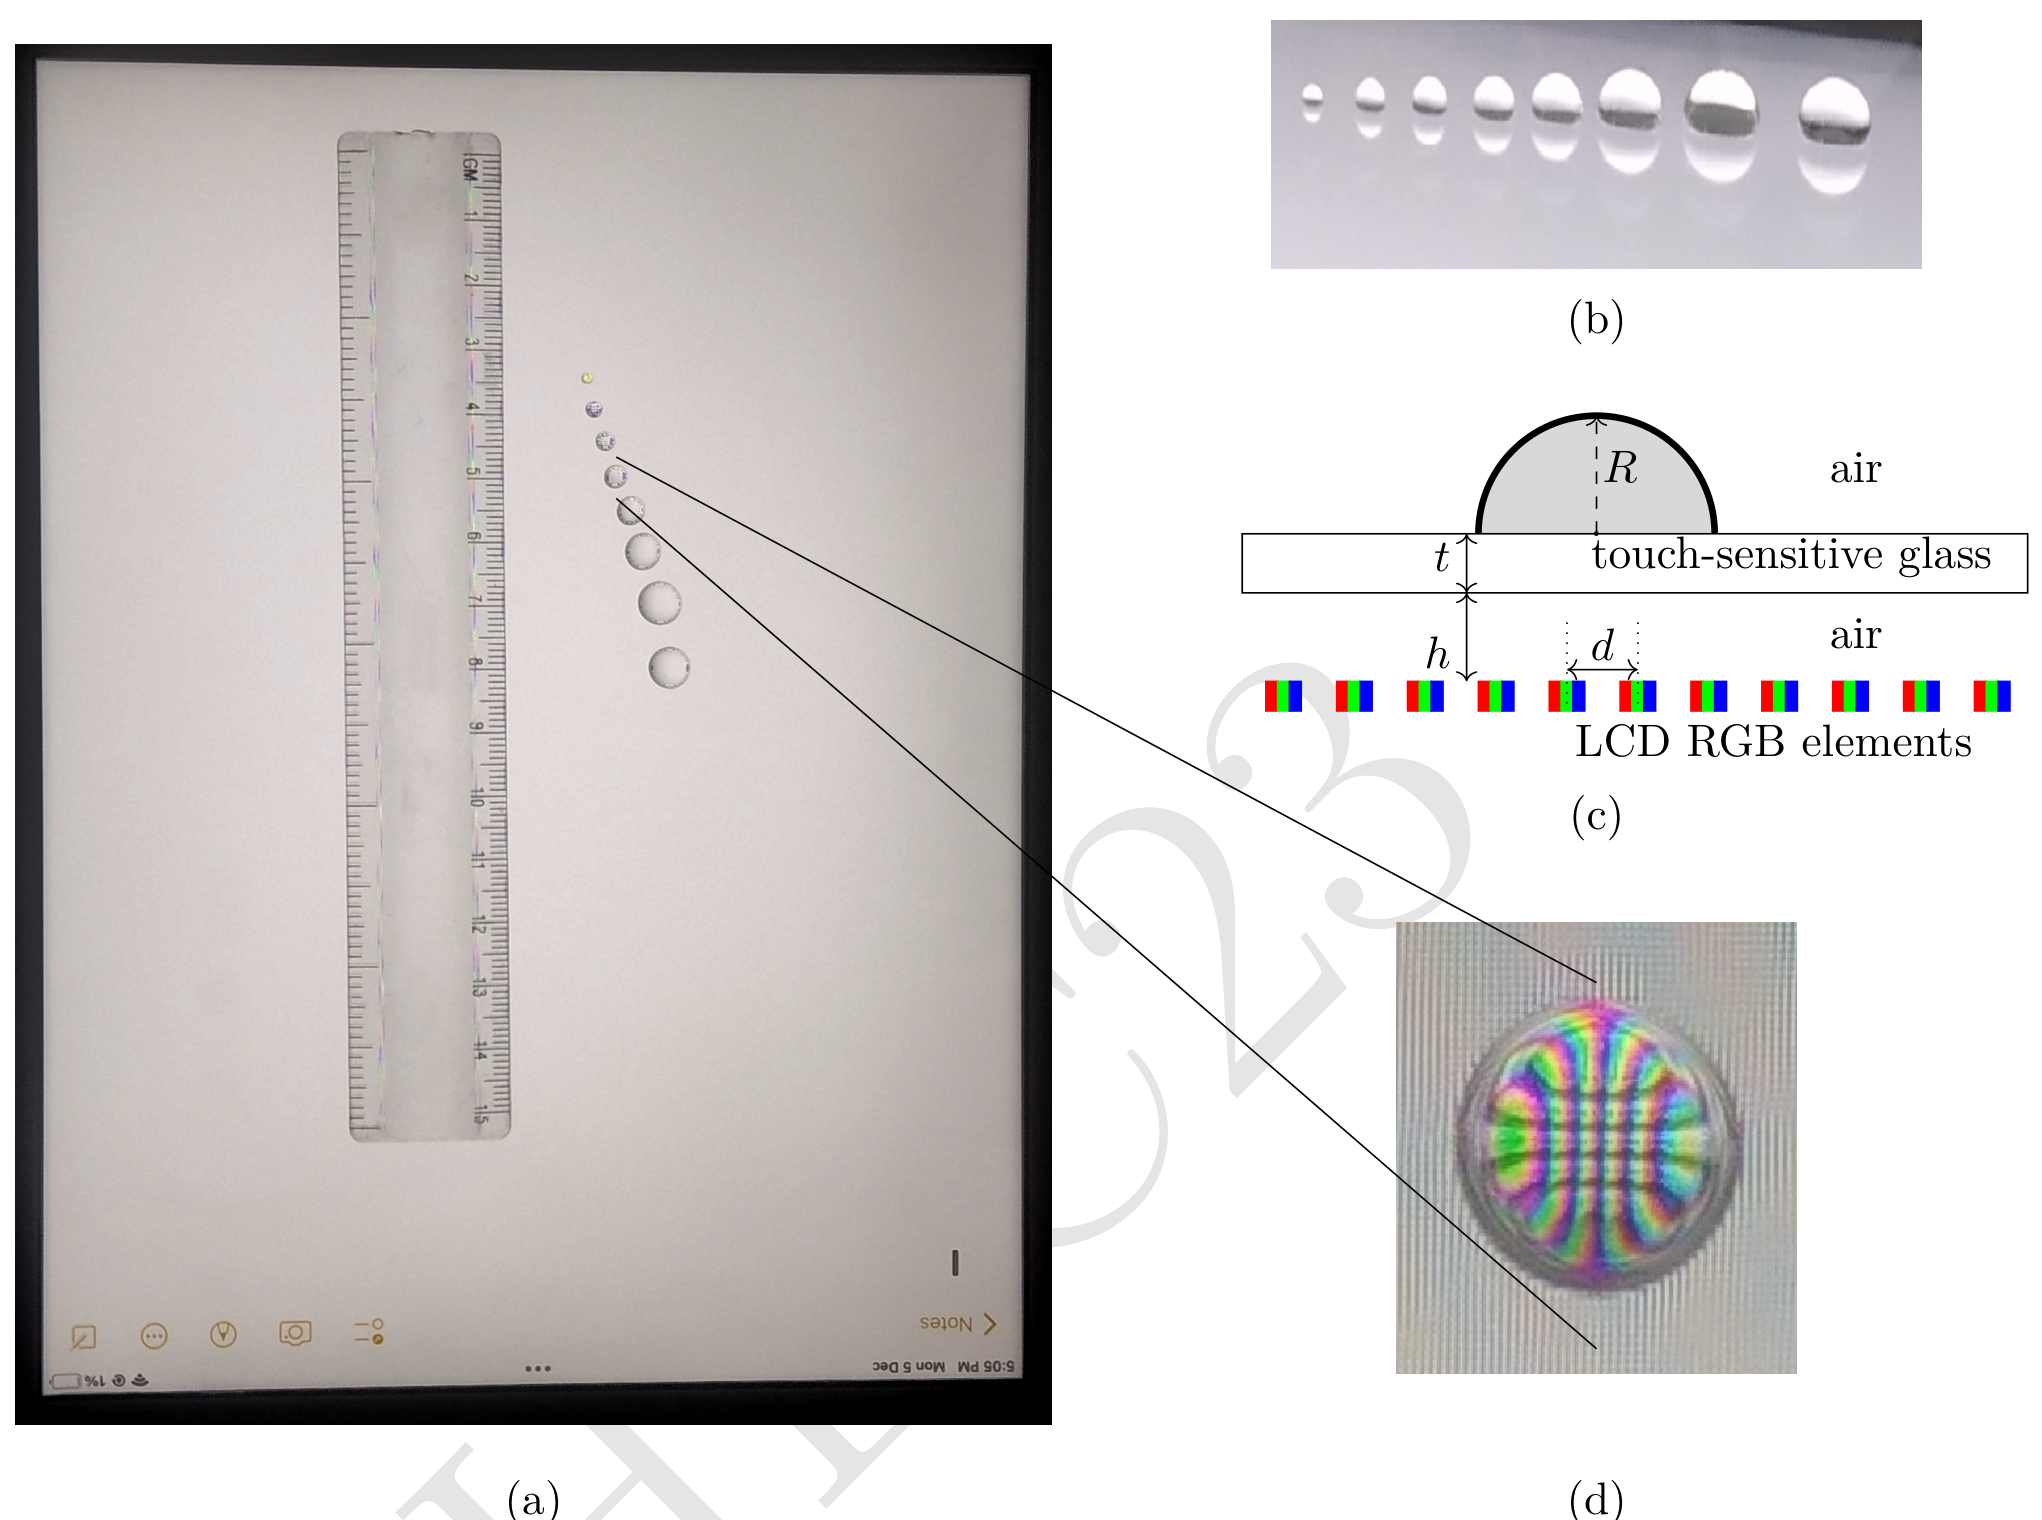
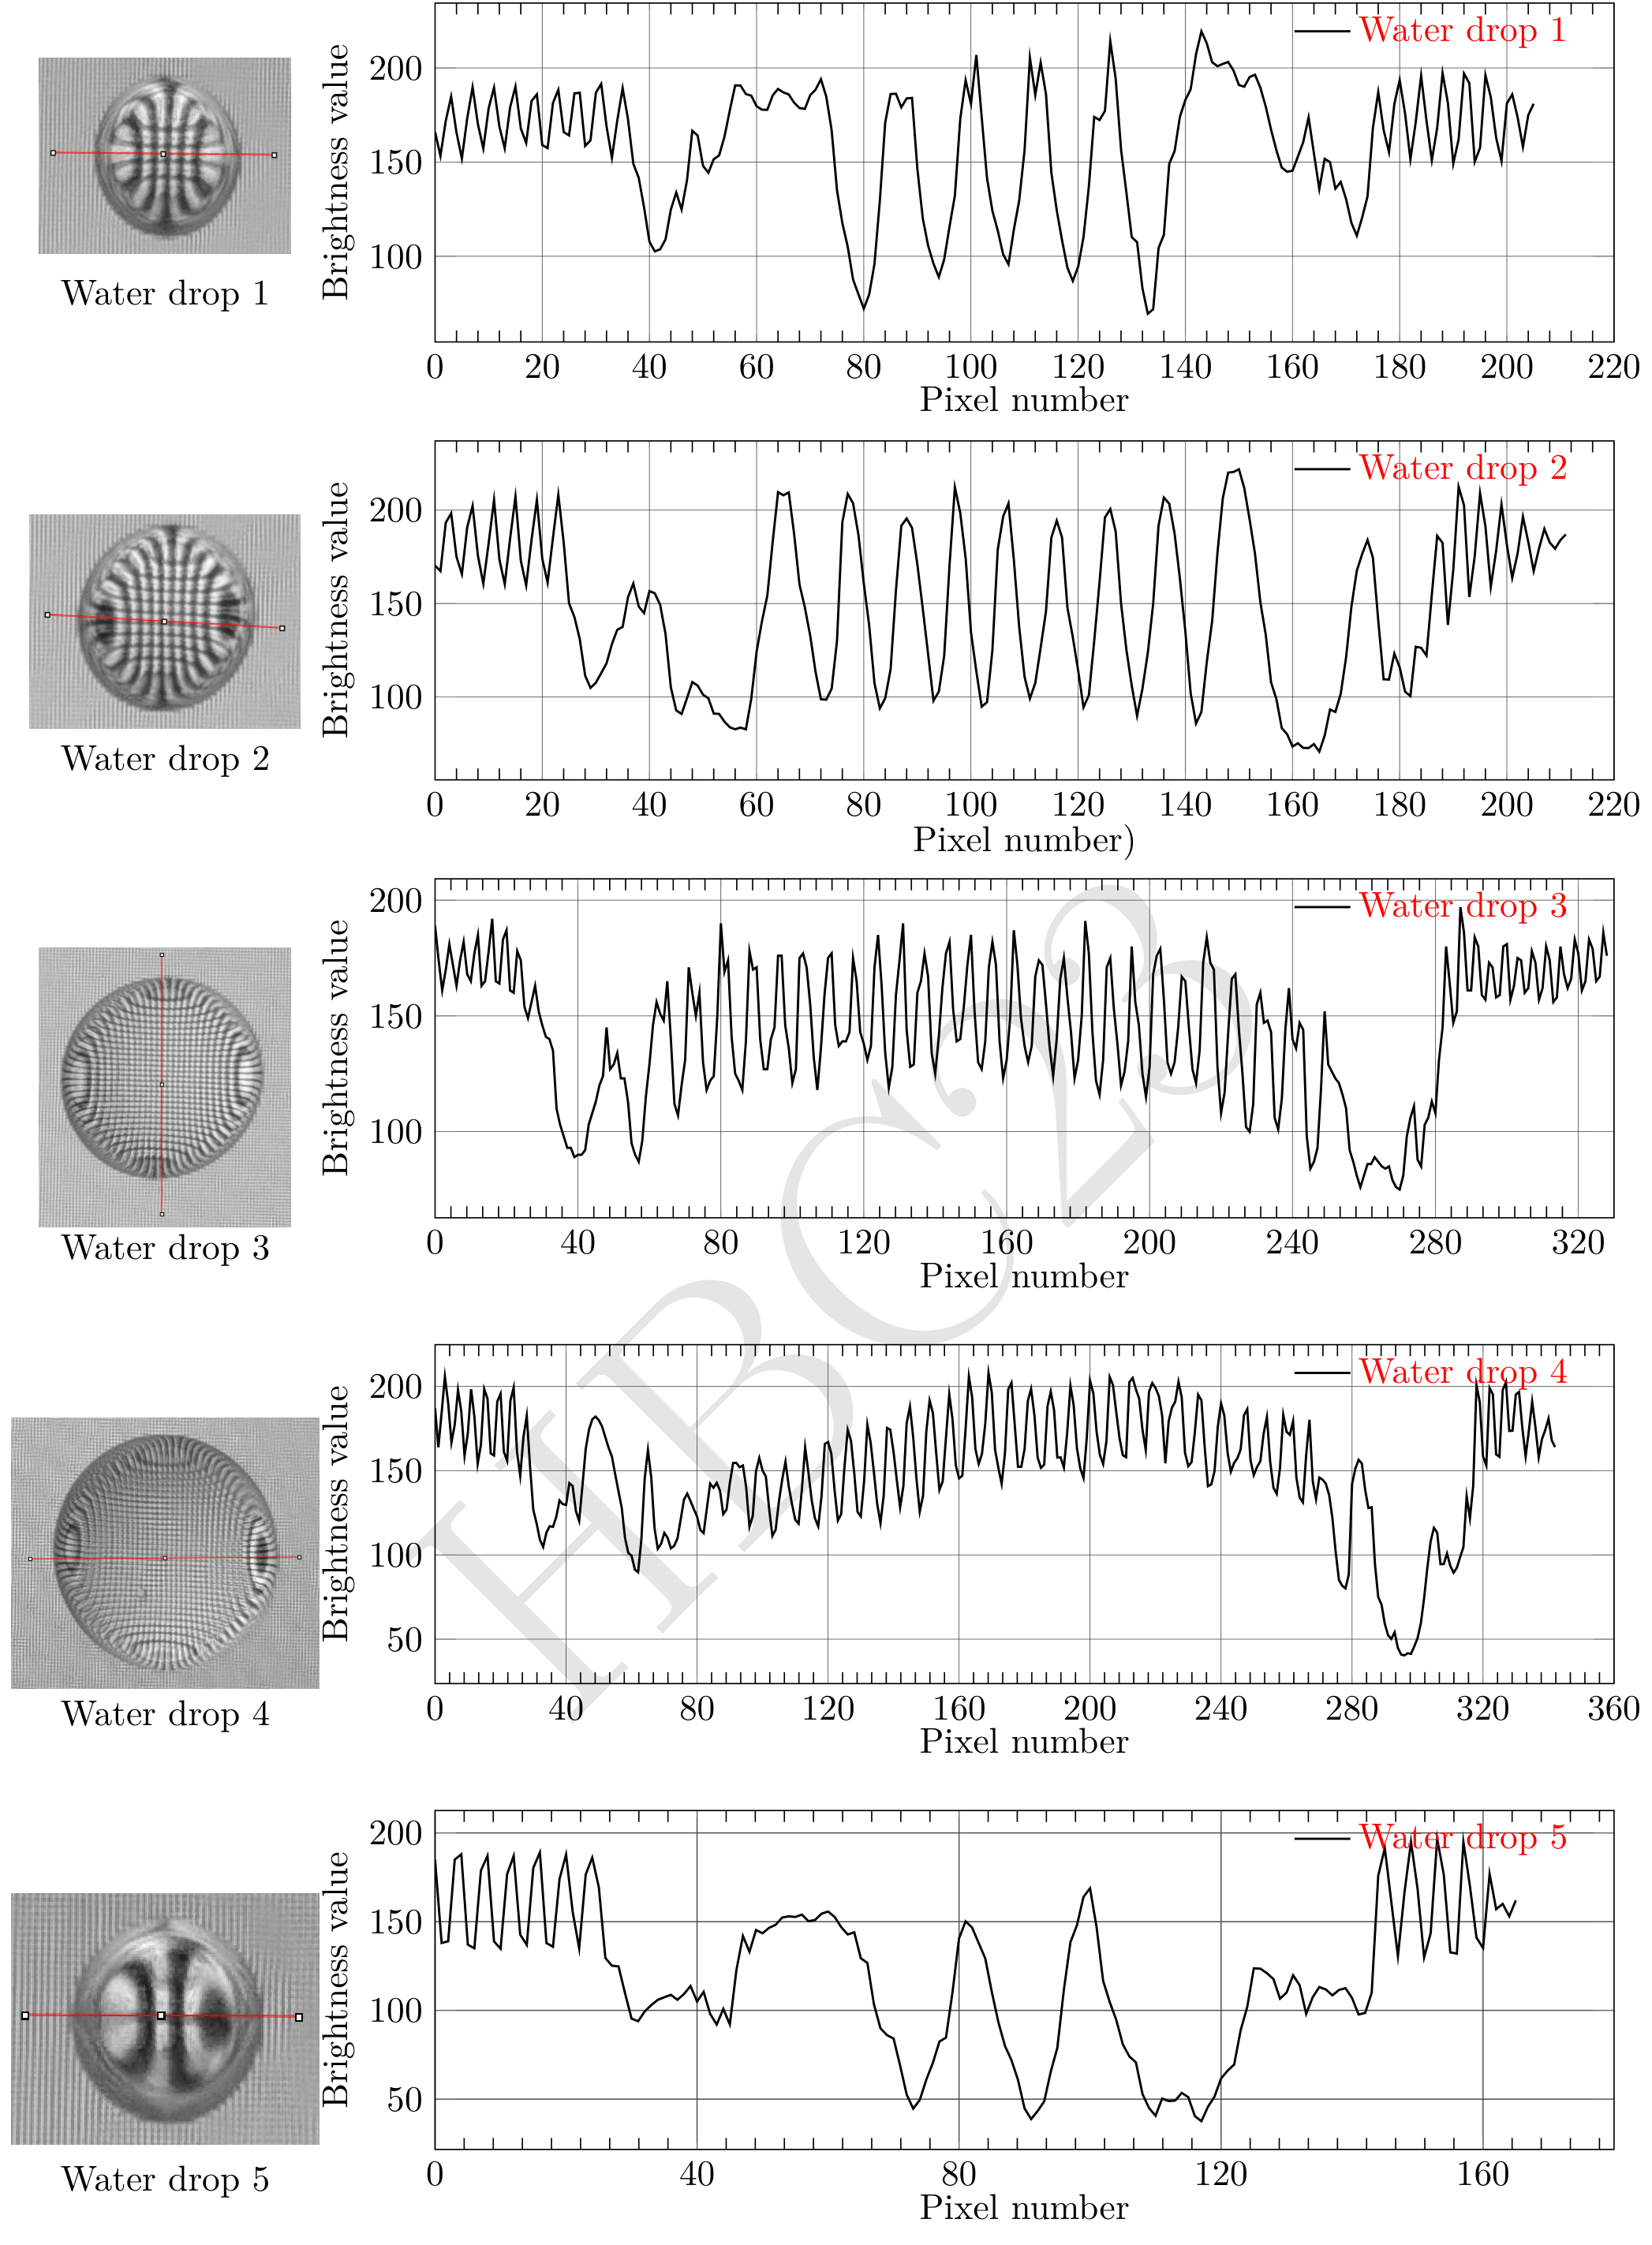
Figure 4(d) shows the magnified image of the array of the RGB elements of the screen as viewed from the top through one of the drops. This image is captured by S-II keeping the camera settings and distance same as in the previous part. The brightness value profiles of the images of the five chosen drops along the reference lines are shown in Fig. (5) on the next page.
Using the profile plots, write the radius of the water drop ( in mm) and the corresponding magnification () of the separation between the array of RGB elements of S-I for each waterdrop lens. Use the table in the Summary Answer sheet to report your data. Describe the method you have used and the calculations in the Detailed Answer sheet.
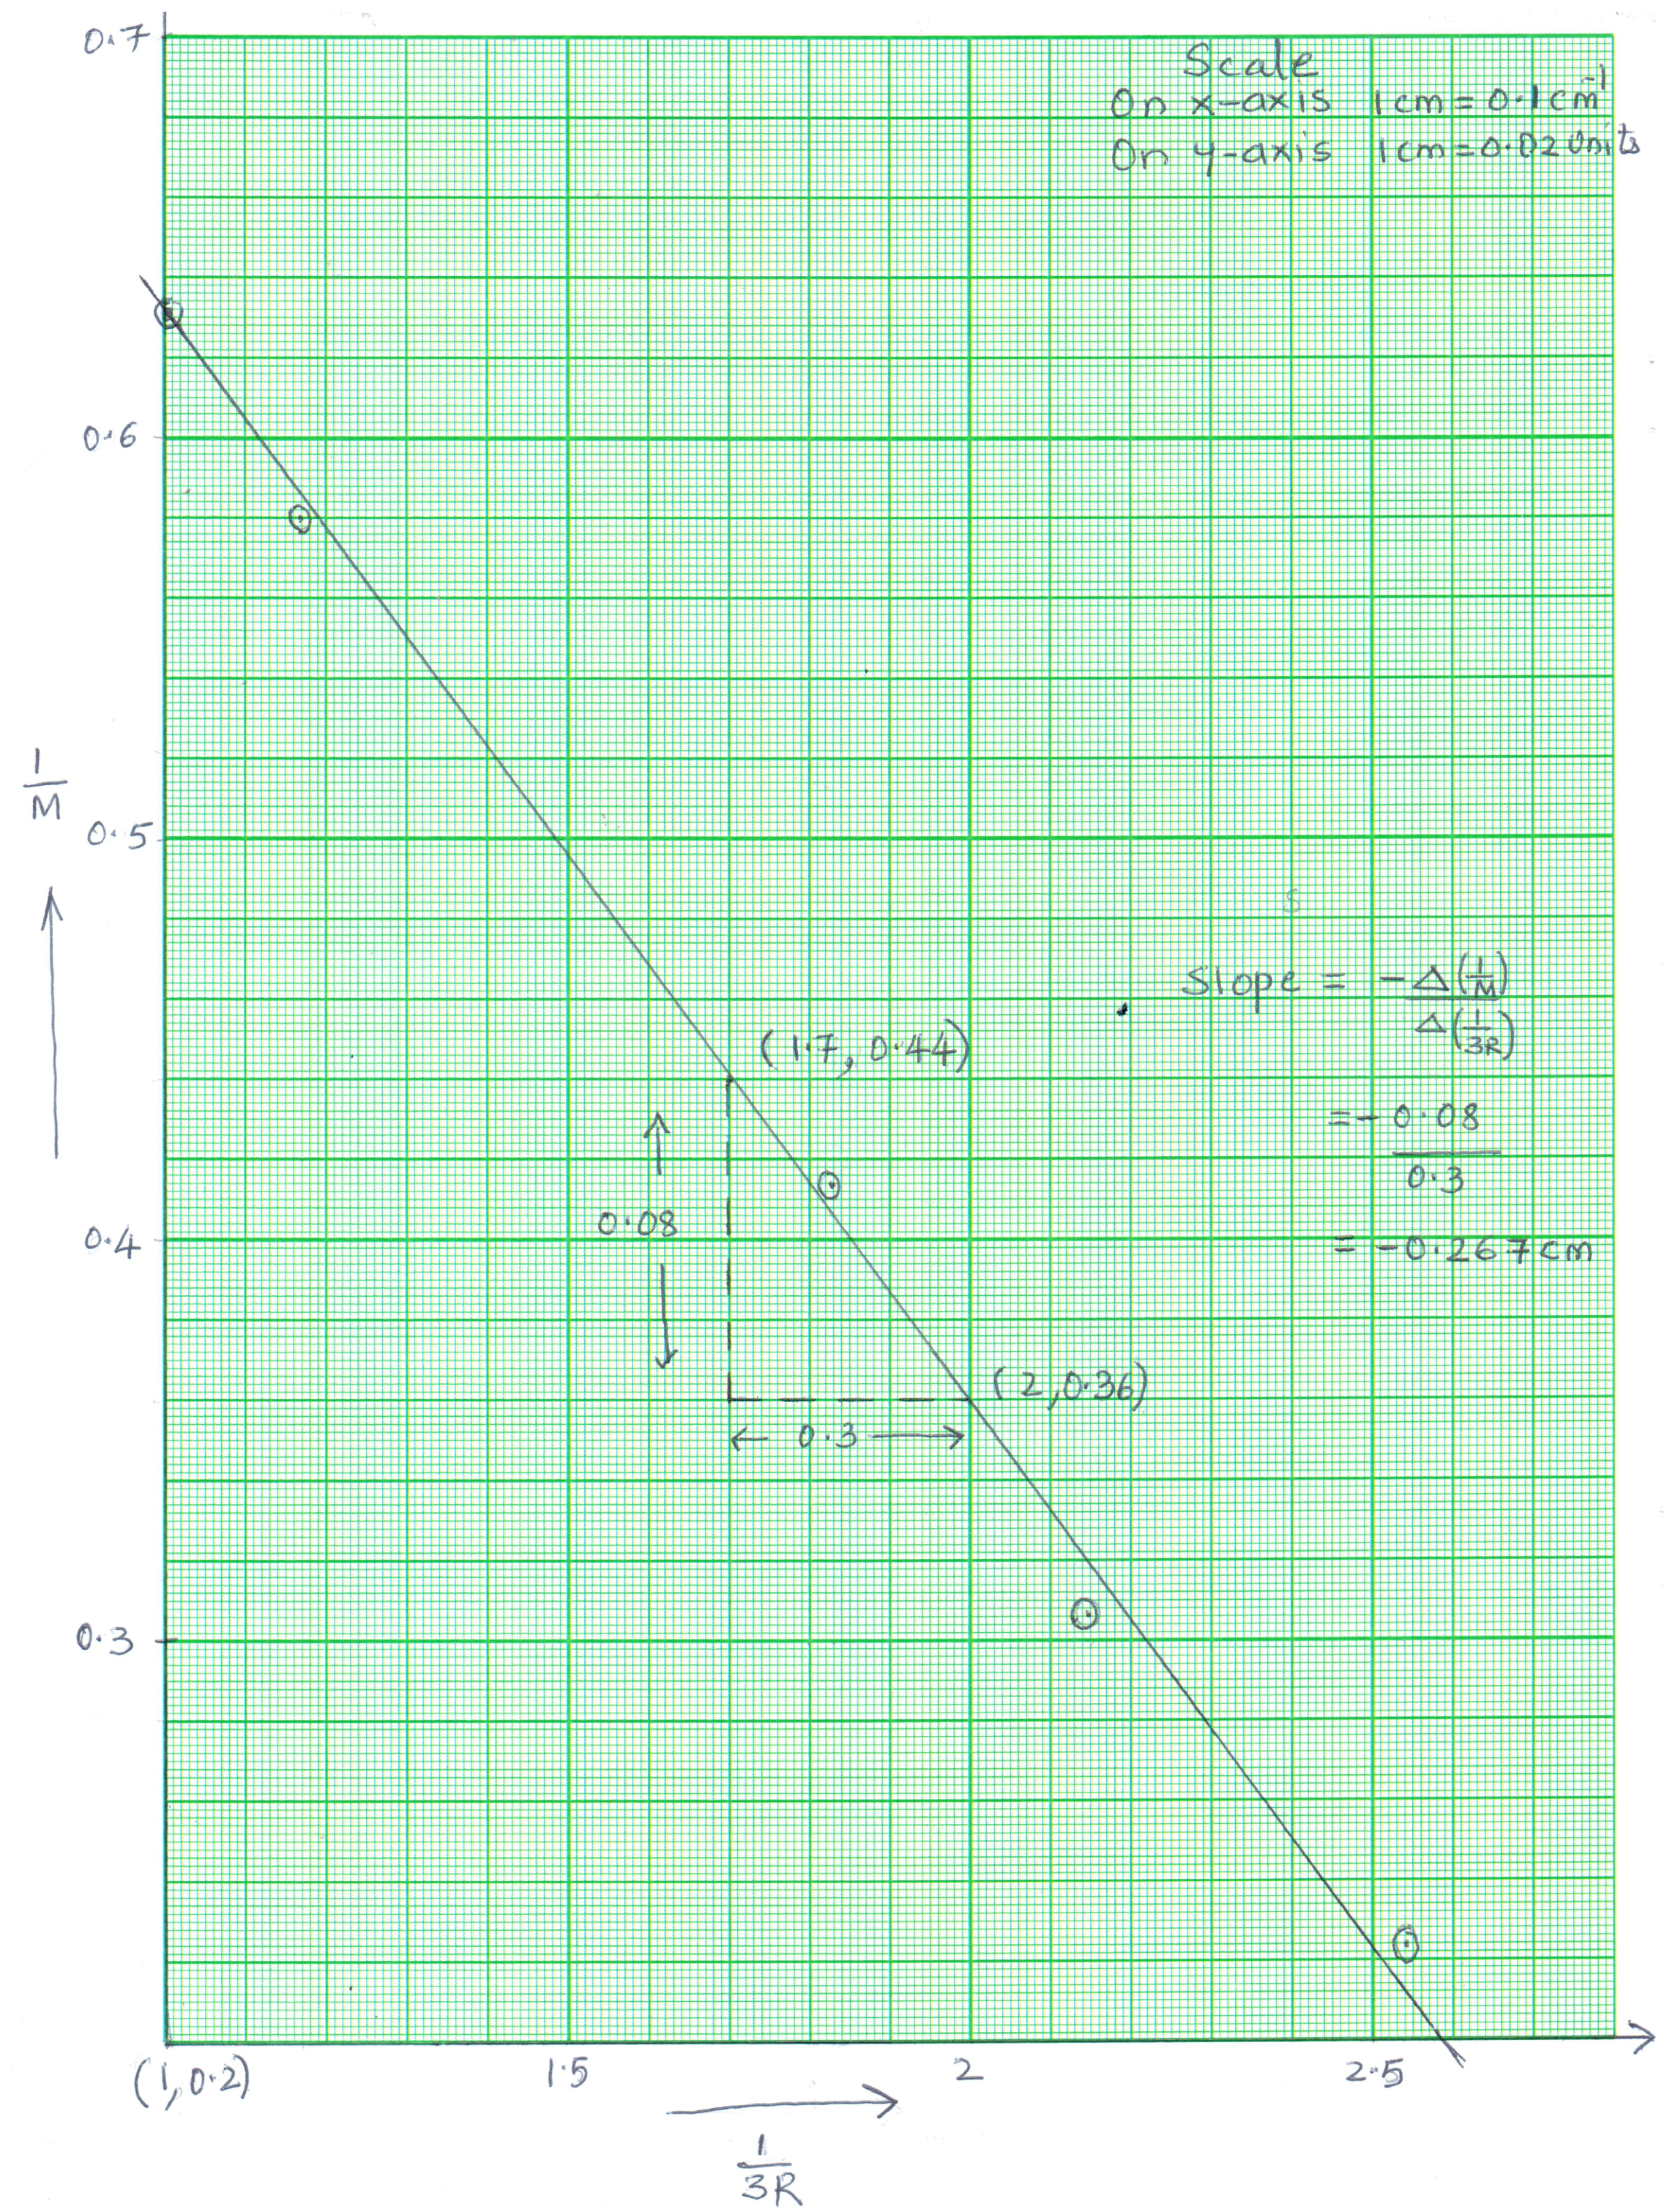
(c) [9 marks] For the given smartphone, , the refractive indices of the touch-sensitive glass, water drop, and the air to be , and 1 respectively. Using the data table of the previous part, plot a suitable linear graph to obtain the distance () of the RGB elements from the touch-sensitive glass. Use the table given in the summary answer sheet to enter the data used to plot the graph. Show your detailed theoretical calculation in the Detailed Answer sheet.
Отговори
(a) 440 pixels
Accepted answer range: 432 – 448 pixels.
(c) 2.34 mm
Accepted answer range: (2.34±5%) mm.
Решение
(a) Solution:
Wherever there is a black color comes into the picture, the brightness value profile will show a dip. There is a dip at pixel number 12 that refers to the 4 cm marker of the ruler. Similarly, the brightness value dip at pixel number 452 is for the 5 cm marker of the scale. Hence the number of pixels present in 1cm of the image is 440. We denote the value to be the scaling factor to convert the measurements obtained in pixels to the centimeter scale.
Accepted answer range : pixels.
(b) Solution: The red line is drawn beyond the waterdrops’ diameters. In each brightness value profile, there are three distinct regions present. Reading from the left, a closely packed peaks, then the central region where the peaks are dispersed and the right side to the central region is again a closely packed peaks. The right and left regions are the plots of the smartphone S-I’s screen without the waterdrop lens. The distance between each peak in these regions refers to the distance between the RGB elements of S-I. Note that for each picture will be the same since all the images are extracted from one single image Fig. (4a).
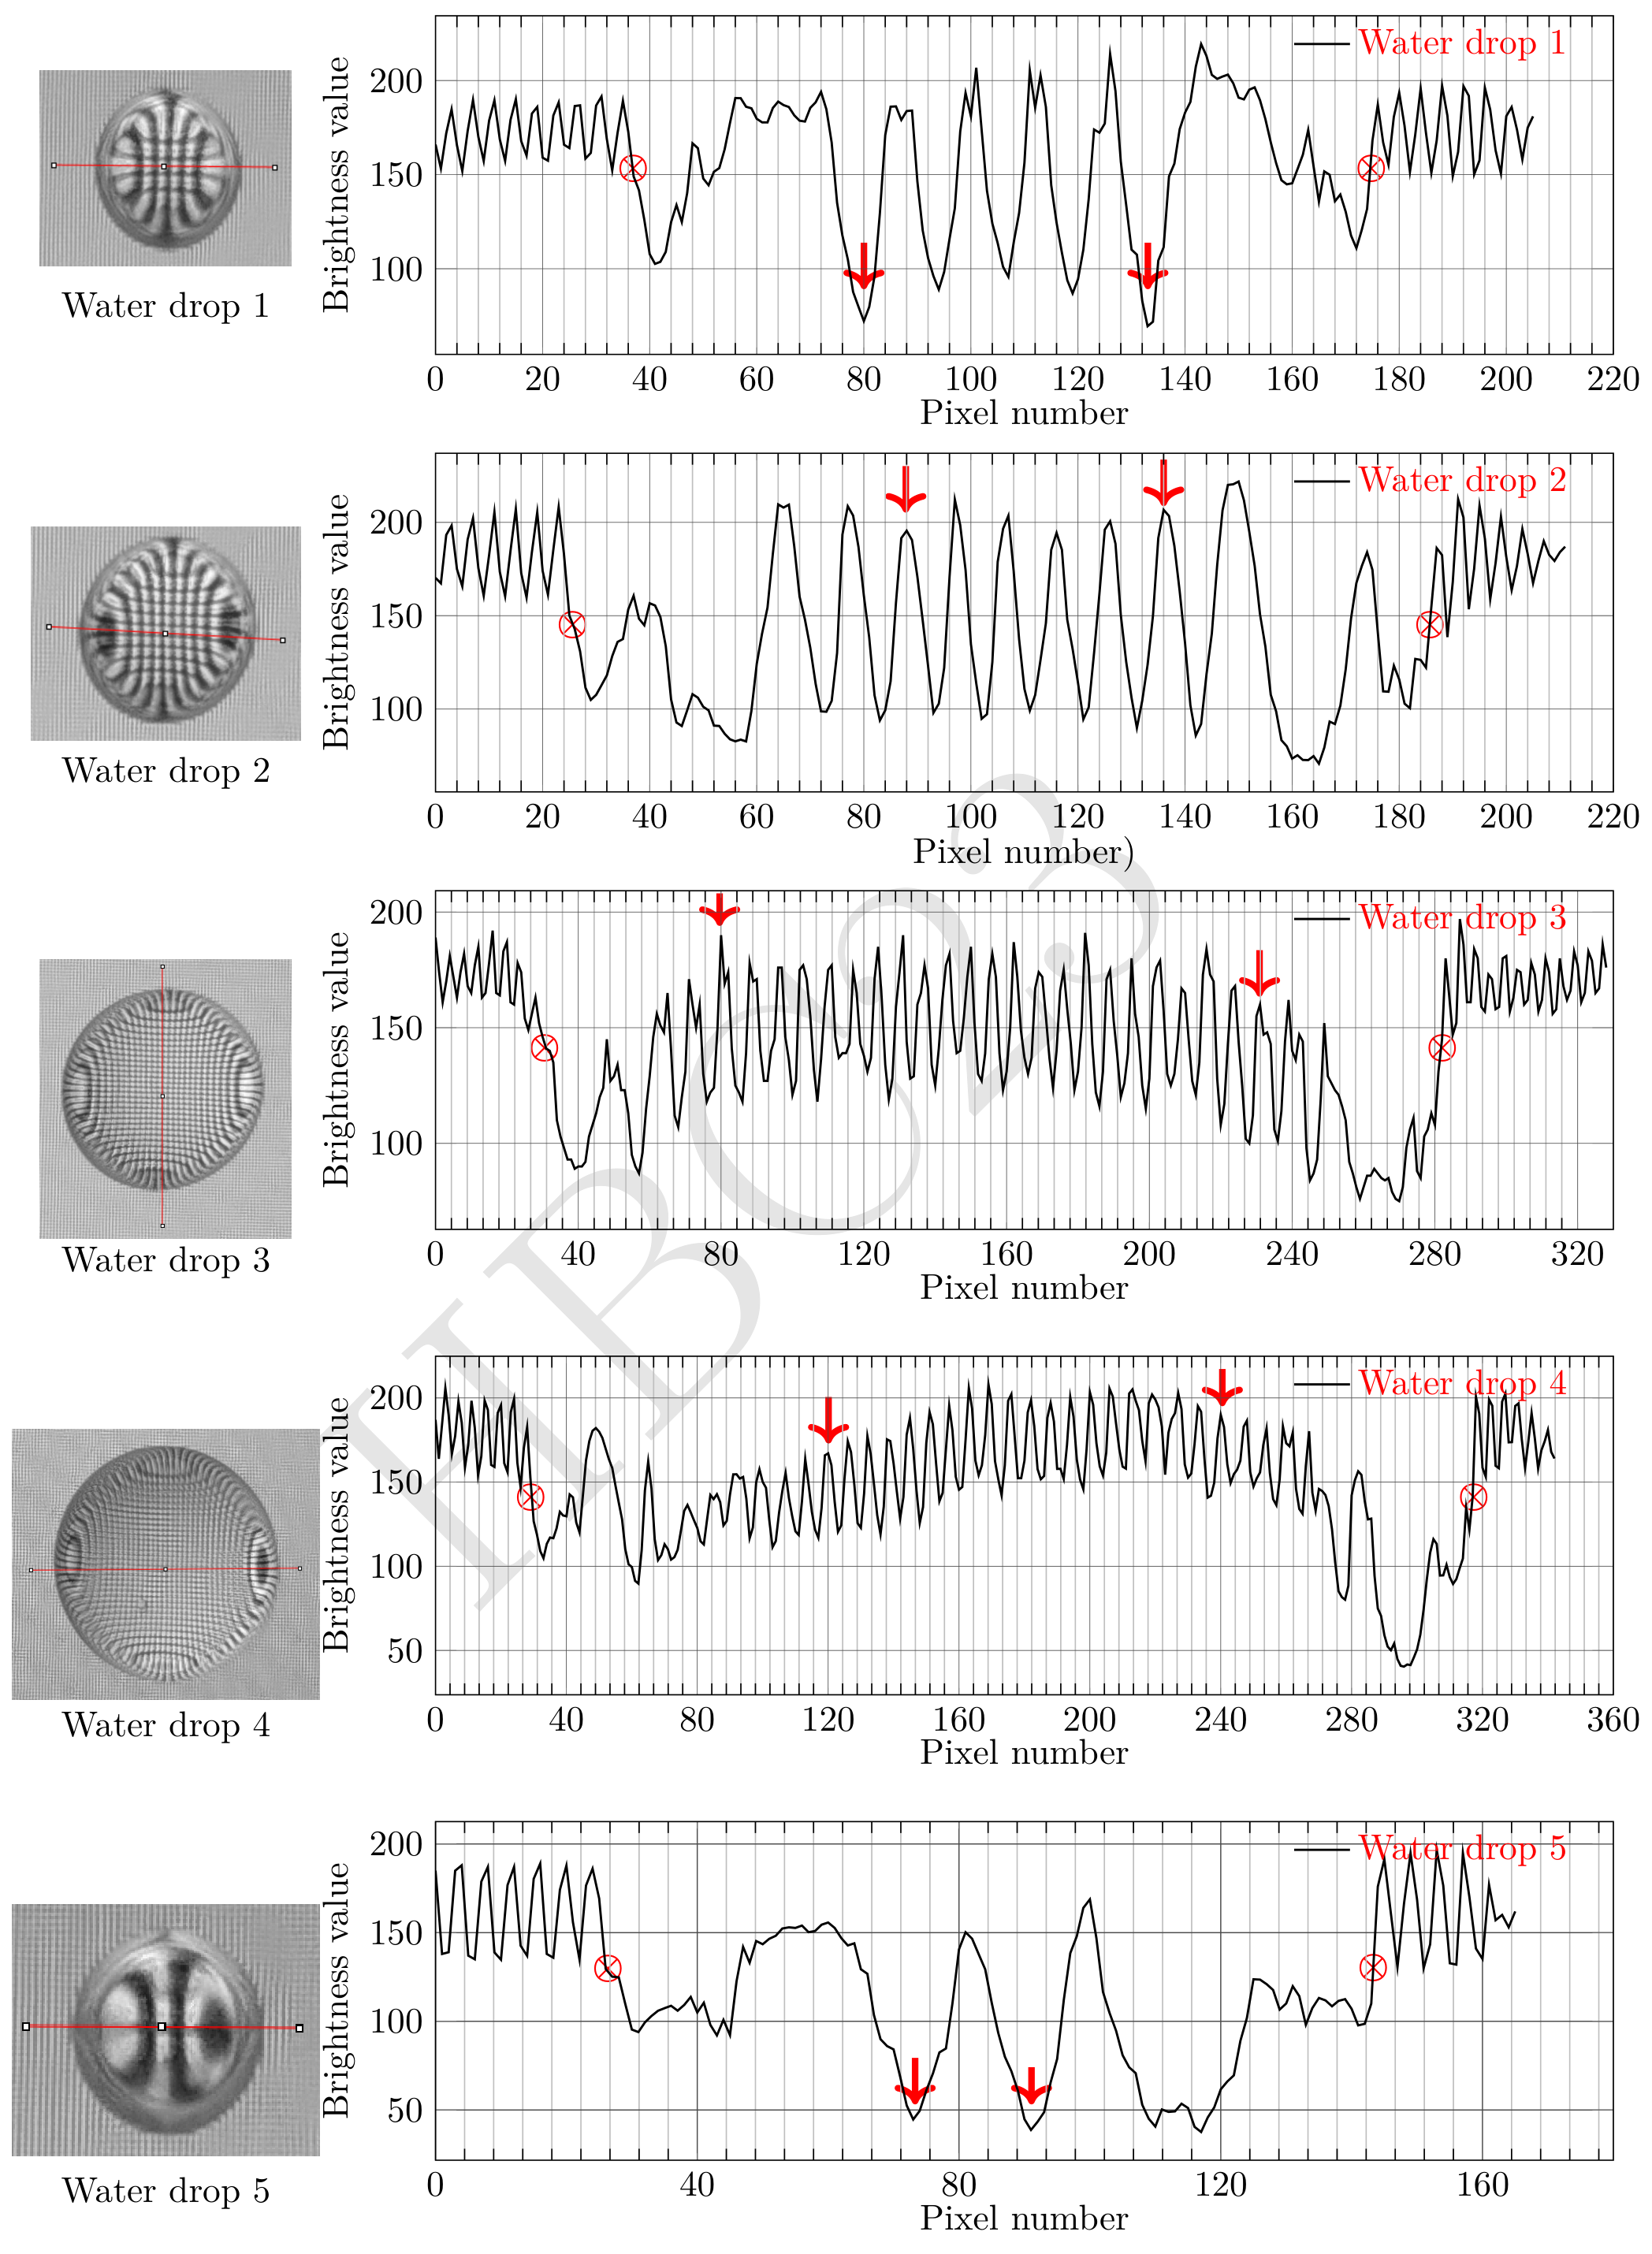
The magnified distance will be different for the drops, depending on the radius . The central region is the magnified plot of the smartphone S-I screen seen through the waterdrop. The distance between the two peaks in the central region is the magnified distance between S-I’s RGB elements. The magnification is . For accuracy, we will count the number of peaks for a distance and then divide the distance by . The exact locations we have used on the plots to calculate are indicated by a red color arrow ↓ (see Fig. (6)).
For each drop, we identify the pixel number which separates the waterdrop region. The distance along this region will be the diameter of the drop. Alternatively, you can also measure the length of the region with a physical ruler and then convert it into a pixel number. The boundary points of the waterdrop regions which we have used on the plots to calculate are indicated by a red color symbol ⊗ (see Fig. (6)).
Every time we obtain the distance from the graph in terms of the pixel number, we multiply it by the scaling factor (obtained in part (a)) to convert it to the centimeter scale.
| No. | Drop region: Start pixel | Drop region: End pixel | (cm) | Magnified distance: Distance: Start pixel | Magnified distance: Distance: End pixel | (cm) | |
|---|---|---|---|---|---|---|---|
| 1 | 36 | 172 | 0.155 | 4 | 80 | 132 | 0.030 |
| 2 | 24 | 184 | 0.182 | 5 | 88 | 136 | 0.022 |
| 3 | 31.11 | 280 | 0.283 | 22 | 80 | 231.11 | 0.016 |
| 4 | 31.11 | 315.56 | 0.323 | 19 | 120 | 240 | 0.014 |
| 5 | 26.67 | 142.22 | 0.131 | 1 | 71.11 | 88.89 | 0.040 |
Here
and is the number of peaks (or dips) counted.
The original distance (unmagnified) between the RGB elements can be obtained by counting the dips in the left or right regions of any of the graphs. See the right side region of the water drop 1 graph, there are six peaks in 20 pixel numbers of the image, i.e. total of five RGB elements in 20 pixel numbers. Thus
Interesting fact for the readers: RGB elements are nothing but the "pixels" inside S-I which you use to define the quality of a screen. When you refer to PPI (pixel per inch) of a phone, you are indicating the number of RGB elements in an inch of the screen display. We used ipad 8th generation as the S-I. Apple website gives PPI (pixel per inch) for the iPad to be 264 (https://support.apple.com/kb/SP822). The value of d obtained gives the PPI value to be ∼279 PPI. Not a bad answer for an amateur setup!
Data table for the Summary answer sheet:
| Water drop | (cm) | |
|---|---|---|
| 1 | 0.155 | 3.25 |
| 2 | 0.182 | 2.40 |
| 3 | 0.283 | 1.72 |
| 4 | 0.328 | 1.58 |
| 5 | 0.131 | 4.44 |
Final values within five percent of the official answers will be credited fully.
(c) Solution: We use the standard results for the reflection formula from a spherical surface.
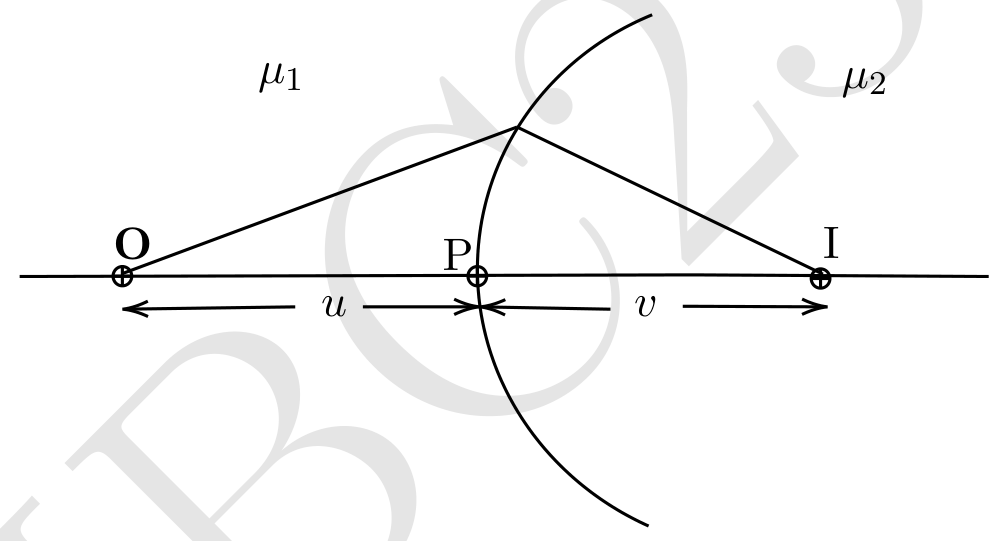
Here the symbols have their usual meanings. The sign will be adjusted accordingly.
There is refraction occurring at the three surfaces.
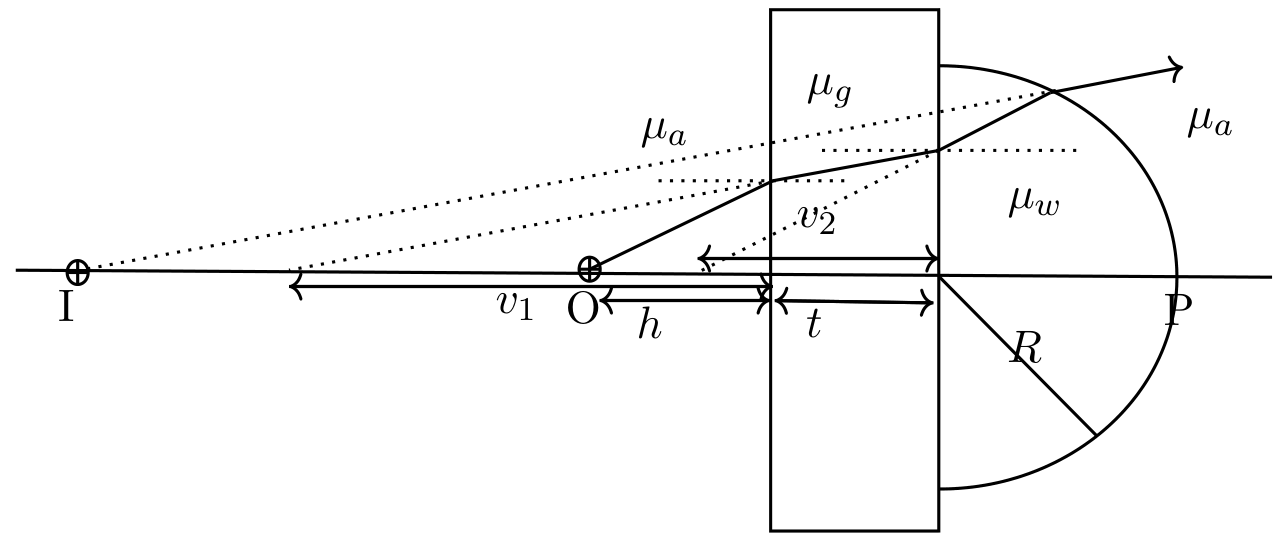
The first refraction is at the air-glass interface. Using in the Eq.(5.3)
The second refraction is at the glass-water interface. Now . This gives
The third refraction is at the water-air interface. Now gives
Magnification will only be from the third interface.
Using , and in the Eqs. (5.9 and 5.10) yields
A graph of vs will be linear. The graph is plotted on the next page. For the obtained data set
Slope = 2.67mm which gives .
Accepted answer range: (2.34±5%)mm.
Оригинал в Архива: INPhO2023-Question.pdf · официални решения: INPhO2023-Solution-20230215.pdf