IOAA 2016, Анализ на данни — Задача 3. Type IA Supernovae
Data Analysis Examination · 50 т.
Условие
Supernovae of type Ia are considered very important for the measurements of large extragalactic distances. The brightening and subsequent dimming of these explosions follow a characteristic light curve, which helps in identifying these as supernovae of type Ia.
Light curves of all type Ia supernovae can be fit to the same model light curve, when they are scaled appropriately. In order to achieve this, we first have to express the light curves in the reference frame of the host galaxy by taking care of the cosmological stretching/dilation of all observed time intervals, , by a factor of . The time interval in the rest frame of the host galaxy is denoted by .
The rest frame light curve of a supernova changes by two magnitudes compared to the peak in a time interval after the peak. If we further scale the time intervals by a factor of (i.e. ) such that the scaled value of is the same for all supernovae, the light curves turn out to have the same shape. It also turns out that is related linearly to the absolute magnitude, , at the peak luminosity for the supernova. That is, we can write
where and are constants. Knowing the scaling factor, one can determine absolute magnitudes of supernovae at unknown distances from the above linear equation.
The table below contains data for three supernovae, including their distance moduli, (for the first two), their recession speed, , and their apparent magnitudes, , at different times. The time shows number of days from the date at which the respective supernova reached peak brightness. The observed magnitudes have already been corrected for interstellar as well as atmospheric extinction.
| Name | SN2006TD | SN2006IS | SN2005LZ |
|---|---|---|---|
| μ (mag) | 34.27 | 35.64 | |
| cz (km s) | 4515 | 9426 | 12060 |
| Δt (days) | m (mag) | m (mag) | m (mag) |
| -15.00 | 19.41 | 18.35 | 20.18 |
| -10.00 | 17.48 | 17.26 | 18.79 |
| -5.00 | 16.12 | 16.42 | 17.85 |
| 0.00 | 15.74 | 16.17 | 17.58 |
| 5.00 | 16.06 | 16.41 | 17.72 |
| 10.00 | 16.72 | 16.82 | 18.24 |
| 15.00 | 17.53 | 17.37 | 18.98 |
| 20.00 | 18.08 | 17.91 | 19.62 |
| 25.00 | 18.43 | 18.39 | 20.16 |
| 30.00 | 18.64 | 18.73 | 20.48 |
(D3.1) Compute values for all three supernovae, and fill them in the given blank boxes in the data tables on the BACK side of the Summary Answersheet. On a graph paper, plot the points and draw the three light curves in the rest frame (mark your graph as “D3.1”). [15 т.]
(D3.2) Take the scaling factor, , for the supernova SN2006IS to be 1.00. Calculate the scaling factors, and , for the other two supernovae SN2006TD and SN2005LZ, respectively, by calculating for them. [5 т.]
(D3.3) Compute the scaled time differences, , for all three supernovae. Write the values for in the same data tables on the Summary Answersheet. On another graph paper, plot the points and draw the 3 light curves to verify that they now have an identical profile (mark your graph as “D3.3”). [14 т.]
(D3.4) Calculate the absolute magnitudes at peak brightness, , for SN2006TD and , for SN2006IS. Use these values to calculate and . [6 т.]
(D3.5) Calculate the absolute magnitude at peak brightness, , and distance modulus, , for SN2005LZ. [4 т.]
(D3.6) Use the distance modulus to estimate the value of Hubble's constant, . Further, estimate the characteristic age of the universe, . [6 т.]
Отговори
- (D3.2) s1 = 1.354; s3 = 1.181
- (D3.4) Mpeak,1 = −18.53 mag; Mpeak,2 = −19.47 mag; b = 0.3762 mag⁻¹; a = 8.325
- (D3.5) Mpeak,3 = −18.99 mag; μ3 = 36.57 mag
- (D3.6) H0 = 58.5 km s⁻¹ Mpc⁻¹; TH = 16.7 Gyr
Решение
(D3.1)
Redshifts for the three supernovae are , and . [1.5]
Filling in the three tables (, third column) [3.5]
SN2006TD
| Δt (d) | m (mag) | Δt (d) | Δt (d) |
|---|---|---|---|
| −15.00 | 19.41 | −14.78 | −20.00 |
| −10.00 | 17.48 | −9.85 | −13.34 |
| −5.00 | 16.12 | −4.93 | −6.67 |
| 0.00 | 15.74 | 0.00 | 0.00 |
| 5.00 | 16.06 | 4.93 | 6.67 |
| 10.00 | 16.72 | 9.85 | 13.34 |
| 15.00 | 17.53 | 14.78 | 20.00 |
| 20.00 | 18.08 | 19.70 | 26.67 |
| 25.00 | 18.43 | 24.63 | 33.34 |
| 30.00 | 18.64 | 29.56 | 40.01 |
SN2006IS
| Δt (d) | m (mag) | Δt (d) | Δt (d) |
|---|---|---|---|
| −15.00 | 18.35 | −14.54 | −14.54 |
| −10.00 | 17.26 | −9.70 | −9.70 |
| −5.00 | 16.42 | −4.85 | −4.85 |
| 0.00 | 16.17 | 0.00 | 0.00 |
| 5.00 | 16.41 | 4.85 | 4.85 |
| 10.00 | 16.82 | 9.70 | 9.70 |
| 15.00 | 17.37 | 14.54 | 14.54 |
| 20.00 | 17.91 | 19.39 | 19.39 |
| 25.00 | 18.39 | 24.24 | 24.24 |
| 30.00 | 18.73 | 29.09 | 29.09 |
SN2005LZ
| Δt (d) | m (mag) | Δt (d) | Δt (d) |
|---|---|---|---|
| −15.00 | 20.18 | −14.42 | −17.03 |
| −10.00 | 18.79 | −9.61 | −11.35 |
| −5.00 | 17.85 | −4.81 | −5.68 |
| 0.00 | 17.58 | 0.00 | 0.00 |
| 5.00 | 17.72 | 4.81 | 5.68 |
| 10.00 | 18.24 | 9.61 | 11.35 |
| 15.00 | 18.98 | 14.42 | 17.03 |
| 20.00 | 19.62 | 19.23 | 22.70 |
| 25.00 | 20.16 | 24.03 | 28.38 |
| 30.00 | 20.48 | 28.84 | 34.06 |
Full marks of 3.5 for all correct values.
Penalty for incorrect values (3×7 independent values):
| Incorrect | 1-3 | 4-6 | 7-9 | 10-12 | 13-15 | 16-18 | 19-21 |
|---|---|---|---|---|---|---|---|
| Deduction | 0.5 | 1.0 | 1.5 | 2.0 | 2.5 | 3.0 | 3.5 |
The light curves in galaxy frame would appear as follows [10.0]
Graph Number: D3.1
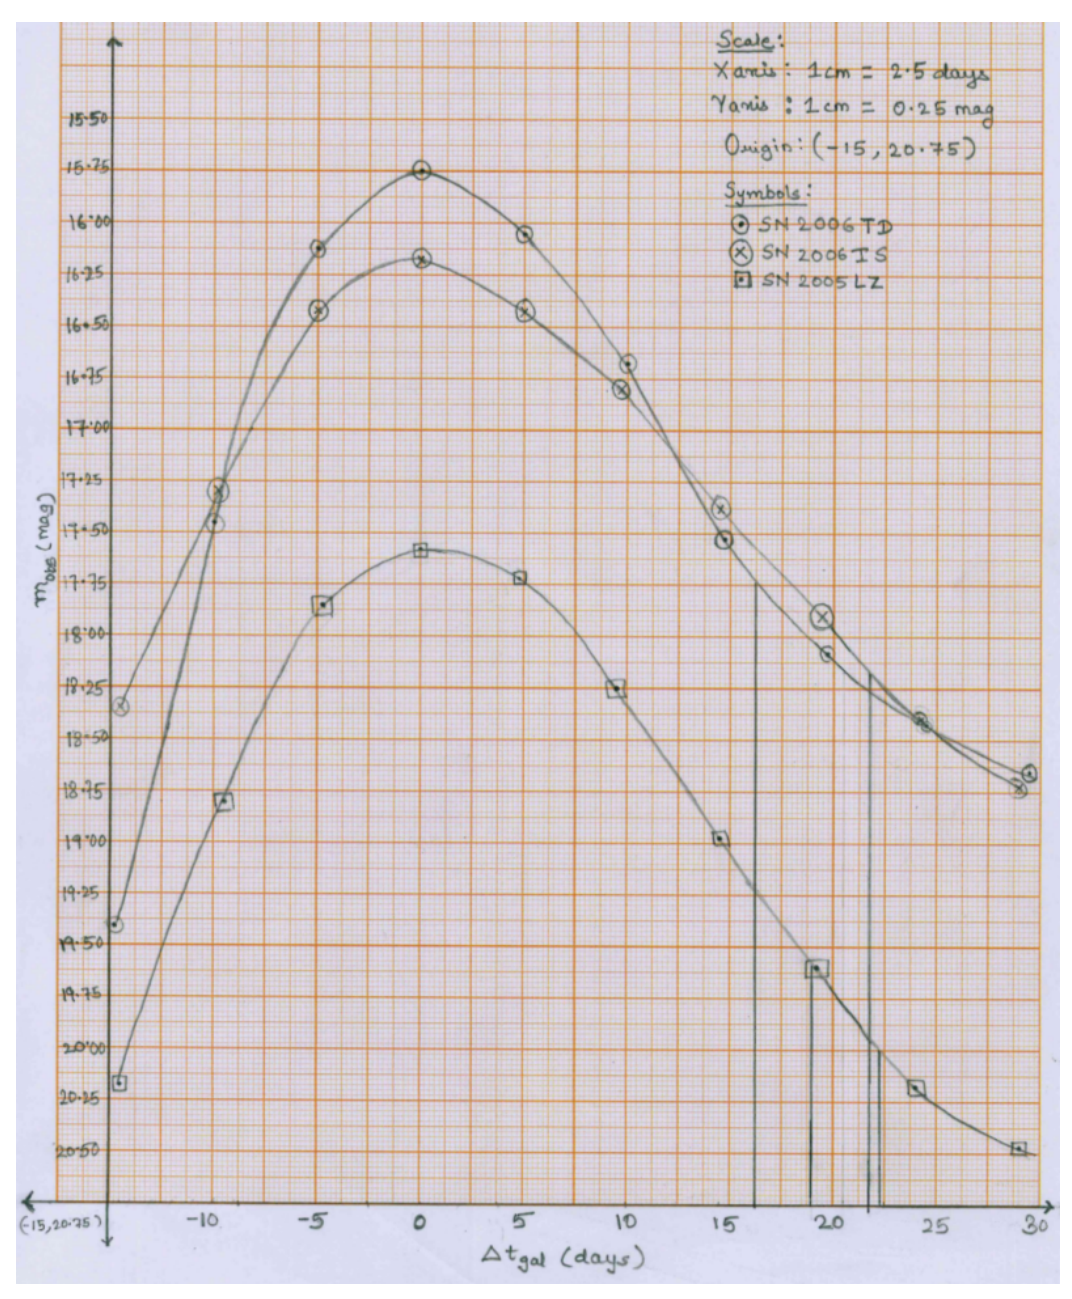
- Plot uses more than 50% of graph paper: 0.5
- Both axes labels ( and ) present: 0.5
- Both dimensions of axes (days and mag) present: 0.5
- Ticks and values on axes (or scale written explicitly): 0.5
- Points correctly plotted: All points correctly plotted: 5.0
Penalty for incorrect or missing points:
| Incorrect | 1 | 2-4 | 5-7 | 8-10 | 11-13 | 14-16 | 17-19 | 20-22 | 23-25 | 26-30 |
|---|---|---|---|---|---|---|---|---|---|---|
| Deduction | 0 | 0.5 | 1.0 | 1.5 | 2.0 | 2.5 | 3.0 | 3.5 | 4.0 | 5.0 |
- Smooth curve through points: 1.0 per curve
(D3.2)
From the graph D3.1, SN2006IS took 22.0 d to fade by 2 magnitudes.
That is, d.
Similarly, d.
And d.
Acceptable range: days [3.0]
Thus, stretching factors for these two supernovae are
[2.0]
(D3.3)
Filling the scaled values in the fourth column of the table ( in table above) [3.5]
Full marks of 3.5 for all correct values.
Penalty for incorrect values (3×7 independent values):
| Incorrect | 1-3 | 4-6 | 7-9 | 10-12 | 13-15 | 16-18 | 19-21 |
|---|---|---|---|---|---|---|---|
| Deduction | 0.5 | 1.0 | 1.5 | 2.0 | 2.5 | 3.0 | 3.5 |
The scaled light curves would appear as follows,
Graph Number: D3.3
[10.5]
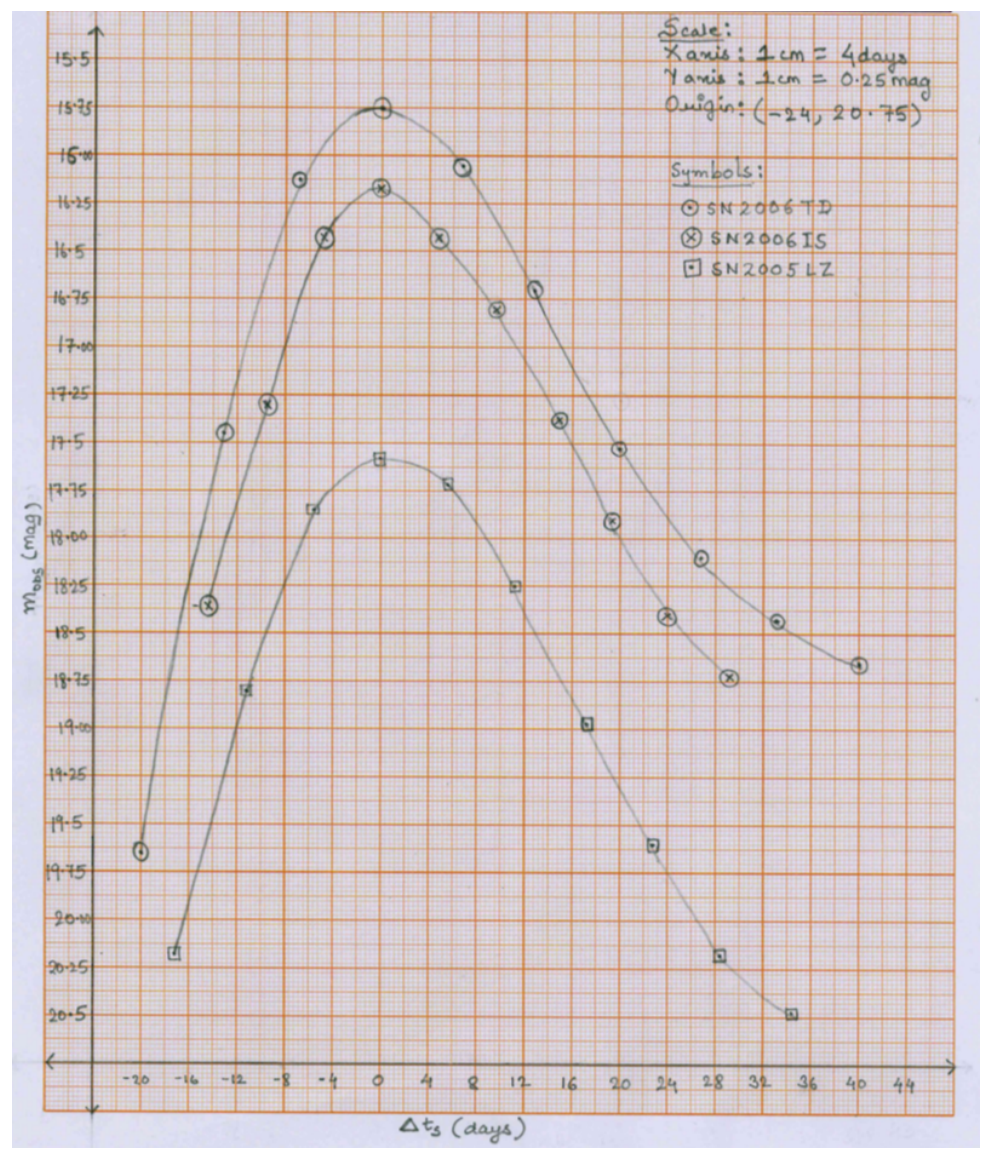
- Plot uses more than 50% of graph paper: 0.5
- Both axes labels ( and ) present: 0.5
- Both dimensions of axes (days and mag) present: 0.5
- Ticks and values on axes (or scale written explicitly): 0.5
- Points correctly plotted: All points correctly plotted: 5.0
Penalty for incorrect or missing points:
| Incorrect | 1 | 2-4 | 5-7 | 8-10 | 11-13 | 14-16 | 17-19 | 20-22 | 23-25 | 26-30 |
|---|---|---|---|---|---|---|---|---|---|---|
| Deduction | 0 | 0.5 | 1.0 | 1.5 | 2.0 | 2.5 | 3.0 | 3.5 | 4.0 | 5.0 |
- Smooth curve through points: 1.0 per curve
- The curves should show identical profiles. [0.5]
(D3.4)
To get and ,
[2.0]
[2.0]
[2.0]
No penalty for missing in .
(D3.5)
[2.0]
Distance modulus to SN2005LZ is
[2.0]
(D3.6)
Distance to SN2005LZ is
[4.0]
[2.0]
Extra factor of 2/3 allowed in the value of .
Оригинал в Архива: Data-analysis-qp.pdf · официални решения: data_analysis_sol.pdf