IOAA 2017, Анализ на данни — Задача 2. The search for dark matter
Data Analysis Examination · 75 т.
Указания
- The data analysis examination lasts for 4 hours and is worth a total of 150 marks.
- Dedicated IOAA Summary Answer Sheets are provided for writing your answers. Enter the final answers into the appropriate boxes in the corresponding Summary Answer Sheet. On each Answer Sheet, please fill in
- Student Code (Country Code and 1 digit)
- Graph Papers are required for your solutions. On each Graph Paper, please fill in
- Student Code (Country Code and 1 digit)
- Question no.
- Graph no. and total number of graph papers used.
- There are Answer Sheets for carrying out detailed work/rough work. On each Answer Sheet, please fill in
- Student Code (Country Code and 1 digit)
- Question no.
- Page no. and total number of pages.
- Start each problem on a separate Answer Sheet. Please write only on the printed side of the sheet. Do not use the reverse side. If you have written something on any sheet which you do not want to be evaluated, cross it out.
- Use as many mathematical expressions as you think that may help the evaluator to better understand your solutions. The evaluator may not understand your language. If it is necessary to explain something in words, please use short phrases (if possible in English).
- You are not allowed to leave your working desk without permission. If you need any assistance (malfunctioning calculator, need to visit a restroom, need more Answer Sheets, etc.), please draw the attention of the invigilator using the sign card.
- The beginning and end of the examination will be indicated by a long sound signal. Additionally, there will be a buzzer sound, fifteen minutes before the end of the examination (before the final sound signal).
- At the end of the examination you must stop writing immediately. Sort and put your Summary Answer Sheets, Graph Papers, and Answer Sheets for each part (D1 and D2) in separate stack. You are not allowed to take any sheet of paper out of the examination area.
- Wait at your table until your envelope is collected. Once all envelopes are collected, your student guide will escort you out of the examination area.
- A list of constants is given on the next page.
Table of constants
| Mass () | kg | Earth |
| Radius () | m | |
| Acceleration of gravity () | 9.8 m s | |
| Obliquity of Ecliptic | 23°27’ | |
| Length of Tropical Year | 365.2422 mean solar days | |
| Length of Sidereal Year | 365.2564 mean solar days | |
| Albedo | 0.39 | |
| Mass(M☾) | kg | Moon |
| Radius (R☾) | m | |
| Mean distance from Earth | m | |
| Orbital inclination with the Ecliptic | 5.14° | |
| Albedo | 0.14 | |
| Apparent magnitude (mean full moon) | -12.74 | |
| Mass () | kg | Sun |
| Radius () | m | |
| Luminosity () | W | |
| Absolute Magnitude () | 4.80 mag | |
| Angular diameter | 0.5 degrees | |
| 1 au | m | Physical constants |
| 1 pc | 206,265 au | |
| Distance from Sun to Barnard’s Star | 1.83 pc | |
| Gravitational constant () | ||
| Planck constant () | ||
| Boltzmann constant () | ||
| Stefan-Boltzmann constant () | ||
| Hubble constant () | 72 km s Mpc | |
| Speed of light in vacuum () | 299,792,458 m s | |
| Proton mass | 938.27 MeV c | |
| Deuterium mass | 1875.60 MeV c | |
| Neutron mass | 939.56 MeV c | |
| Helium-3 mass | 2808.30 MeV c | |
| Helium-4 mass | 3727.40 MeV c |
Условие
A low surface brightness galaxy (LSB) is a diffuse galaxy with a surface brightness that, when viewed from the Earth, is at least one magnitude lower than the ambient night sky.
Some of its matter is in the form of “baryonic” matter such as neutral hydrogen gas and stars. However, most of its matter is in the form of invisible mass – so called “dark matter”. In this question, we will investigate the mass of dark matter in a galaxy, the effect of dark matter on the rotation curves of the galaxy, and the distribution of dark matter in the galaxy.
The table below provides the data of a LSB galaxy named UGC4325. The galaxy is assumed to be edge-on. At every distance from the centre of the galaxy, we measure
- , the observed wavelength of the H emission line. The Hubble expansion of the Universe has already been excluded from the data.
- , the contribution of the gas component to the rotation due to , derived from HI surface densities.
- , the contribution of the stellar component to the rotation due to , derived from -band photometry.
The rotational velocities of the test particle due to the gas component, , and the star component, , are defined as the velocities in the plane of the galaxy that would result from the corresponding components without any external influences. These velocities are calculated from the observed baryonic mass density distributions.
| (kpc) | (nm) | (km/s) | (km/s) |
|---|---|---|---|
| 0.70 | 656.371 | 2.87 | 20.97 |
| 1.40 | 656.431 | 6.75 | 32.22 |
| 2.09 | 656.464 | 14.14 | 40.91 |
| 2.79 | 656.475 | 20.18 | 46.75 |
| 3.49 | 656.478 | 24.08 | 50.10 |
| 4.89 | 656.484 | 28.08 | 47.94 |
| 6.25 | 656.481 | 29.25 | 45.47 |
| 7.10 | 656.481 | 27.03 | 47.78 |
| 9.03 | 656.482 | 25.90 | 45.32 |
| 12.05 | 656.482 | 21.03 | 42.30 |
The mass of dark matter within a volume of radius can be defined in terms of the rotational velocity due to dark matter , the radius and gravitational constant ,
To a good approximation, the observed rotational velocity can be modelled as
The observed rotational velocity depends on the mass of the galaxy within a volume of radius measured from the galaxy’s centre.
The mass density of dark matter within a volume of radius can be modelled by a galaxy density profile,
where and are the central density and the core radius of the galaxy, respectively. According to the density profile, the mass of dark matter within a volume of a radius can be described by
Part 1 The mass of dark matter and rotation curves of the galaxy
(D2.1) In laboratories on Earth, H has an emitted wavelength of 656.281 nm. Compute the observed rotational velocities of the galaxy and the rotational velocities due to the dark matter at distance in units of km s.
For the different values of given in the table, compute the dynamical mass and the mass of dark matter in solar masses. [21 т.]
(D2.2) Create rotation curves of the galaxy on graph paper by plotting the points of , , , versus the radius and draw smooth curves through the points (mark your graph as “D2.2”).
Order the contribution of the different components to the observed velocity in descending order. [16 т.]
Part 2 Dark matter distribution
(D2.3) Take a data point at small and large to estimate and . Note that for large values of , and at small , . [7 т.]
(D2.4) By comparing Equation (4) to a linear function, the central density could also be found by a linear fit. Plot an appropriate graph so that a linear fit can be used to find another value of . Evaluate in units of M kpc. (Mark your graph as “D2.4”). If you cannot find the value of from the previous part, use 3.2 kpc as an estimate for this part. [19 т.]
(D2.5) Compute logarithmic values of the dark matter density, , and plot the distribution of dark matter in the galaxy as a function of radius on graph paper. (Mark your graph as “D2.5”). [12 т.]
Отговори
Part 2 Dark matter distribution, (D2.3) ρ₀ ≈ 1.42 × 10⁸ M☉/kpc³; rC = 0.964 kpc (Method 2); rC = 1.01 kpc (Method 1)
Official solution; the less accurate estimate gives rC ≈ 0.901 kpc.
Part 2 Dark matter distribution, (D2.4) ρ₀ ≈ 1.43 × 10⁸ M☉/kpc³ (Solution 1, with rC = 3.2 kpc)
Handwritten result on the official graph D2.4: Solution 1.
Решение
(D2) The search for dark matter [75 marks]
A low surface brightness galaxy (LSB) is a diffuse galaxy with a surface brightness that, when viewed from the Earth, is at least one magnitude lower than the ambient night sky.
Some of its matter is in the form of “baryonic” matter such as neutral hydrogen gas and stars. However, most of its matter is in the form of invisible mass which is so called “dark matter”. In this question, we will investigate the mass of dark matter in a galaxy, the effect of dark matter on the rotation curves of the galaxy, and the distribution of dark matter in the galaxy.
The table below provides the data of a LSB galaxy named UGC4325. The galaxy is assumed to be edge-on. At every distance from the centre of the galaxy, we measure
- , the observed wavelength of the H emission line. The Hubble expansion of the Universe has already been excluded from the data.
- , the contribution of the gas component to the rotation due to , derived from HI surface densities.
- , the contribution of the stellar component to the rotation due to , derived from -band photometry.
The rotational velocities of the test particle due to the gas component, , and the star component, , are defined as the velocities in the plane of the galaxy that would result from the corresponding components without any external influences. These velocities are calculated from the observed baryonic mass density distributions.
| (kpc) | (nm) | (km/s) | (km/s) |
|---|---|---|---|
| 0.70 | 656.371 | 2.87 | 20.97 |
| 1.40 | 656.431 | 6.75 | 32.22 |
| 2.09 | 656.464 | 14.14 | 40.91 |
| 2.79 | 656.475 | 20.18 | 46.75 |
| 3.49 | 656.478 | 24.08 | 50.10 |
| 4.89 | 656.484 | 28.08 | 47.94 |
| 6.25 | 656.481 | 29.25 | 45.47 |
| 7.10 | 656.481 | 27.03 | 47.78 |
| 9.03 | 656.482 | 25.90 | 45.32 |
| 12.05 | 656.482 | 21.03 | 42.30 |
The mass of dark matter within a volume of radius can be defined in terms of the rotational velocity due to dark matter , the radius and gravitational constant ,
For the best estimate, the observed rotational velocity can be modeled as
The observed rotational velocity depends on the mass of the galaxy within a volume of radius measured from the galaxy’s centre.
The mass density of dark matter within a volume of radius can be modeled by a galaxy density profile,
where and are the central density and the core radius of the galaxy, respectively. According to the density profile, the mass of dark matter within a volume of a radius can be described by
Part 1 The mass of dark matter and rotation curves of the galaxy
(D2.1) In laboratories on Earth, H has an emitted wavelength of 656.281 nm. Compute the observed rotational velocities of the galaxy and the rotational velocities due to the dark matter at distance in units of km/s.
For the different values of given in the table, compute the dynamical mass and the mass of dark matter in solar masses. [21]
Solution:
Redshift: [0.5]
Observed rotation velocity: [0.5]
Values correctly computed: 20.0 (0.5 for each values)
| (kpc) | (km/s) | (km/s) | () | () | |
|---|---|---|---|---|---|
| 0.70 | 1.37x10 | 41.11 | 35.25 | 2.75x10 | 2.02x10 |
| 1.40 | 2.29 x10 | 68.52 | 60.10 | 1.53x10 | 1.18x10 |
| 2.09 | 2.79 x10 | 83.60 | 71.52 | 3.40x10 | 2.49x10 |
| 2.79 | 2.96 x10 | 88.62 | 72.53 | 5.09x10 | 3.41x10 |
| 3.49 | 3.00 x10 | 89.99 | 70.77 | 6.57x10 | 4.06x10 |
| 4.89 | 3.09 x10 | 92.73 | 74.25 | 9.78x10 | 6.27x10 |
| 6.25 | 3.05 x10 | 91.36 | 73.65 | 1.21x10 | 7.88x10 |
| 7.10 | 3.05 x10 | 91.36 | 73.03 | 1.38 x10 | 8.80x10 |
| 9.03 | 3.06 x10 | 91.82 | 75.54 | 1.77x10 | 1.20x10 |
| 12.05 | 3.06 x10 | 91.82 | 78.74 | 2.36x10 | 1.74x10 |
(D2.2) Create rotation curves of the galaxy on graph paper by plotting the points of , , , versus the radius and draw smooth curves through the points (mark your graph as “D2.2”).
Order the contribution of the different components to the observed velocity in descending order. [16]
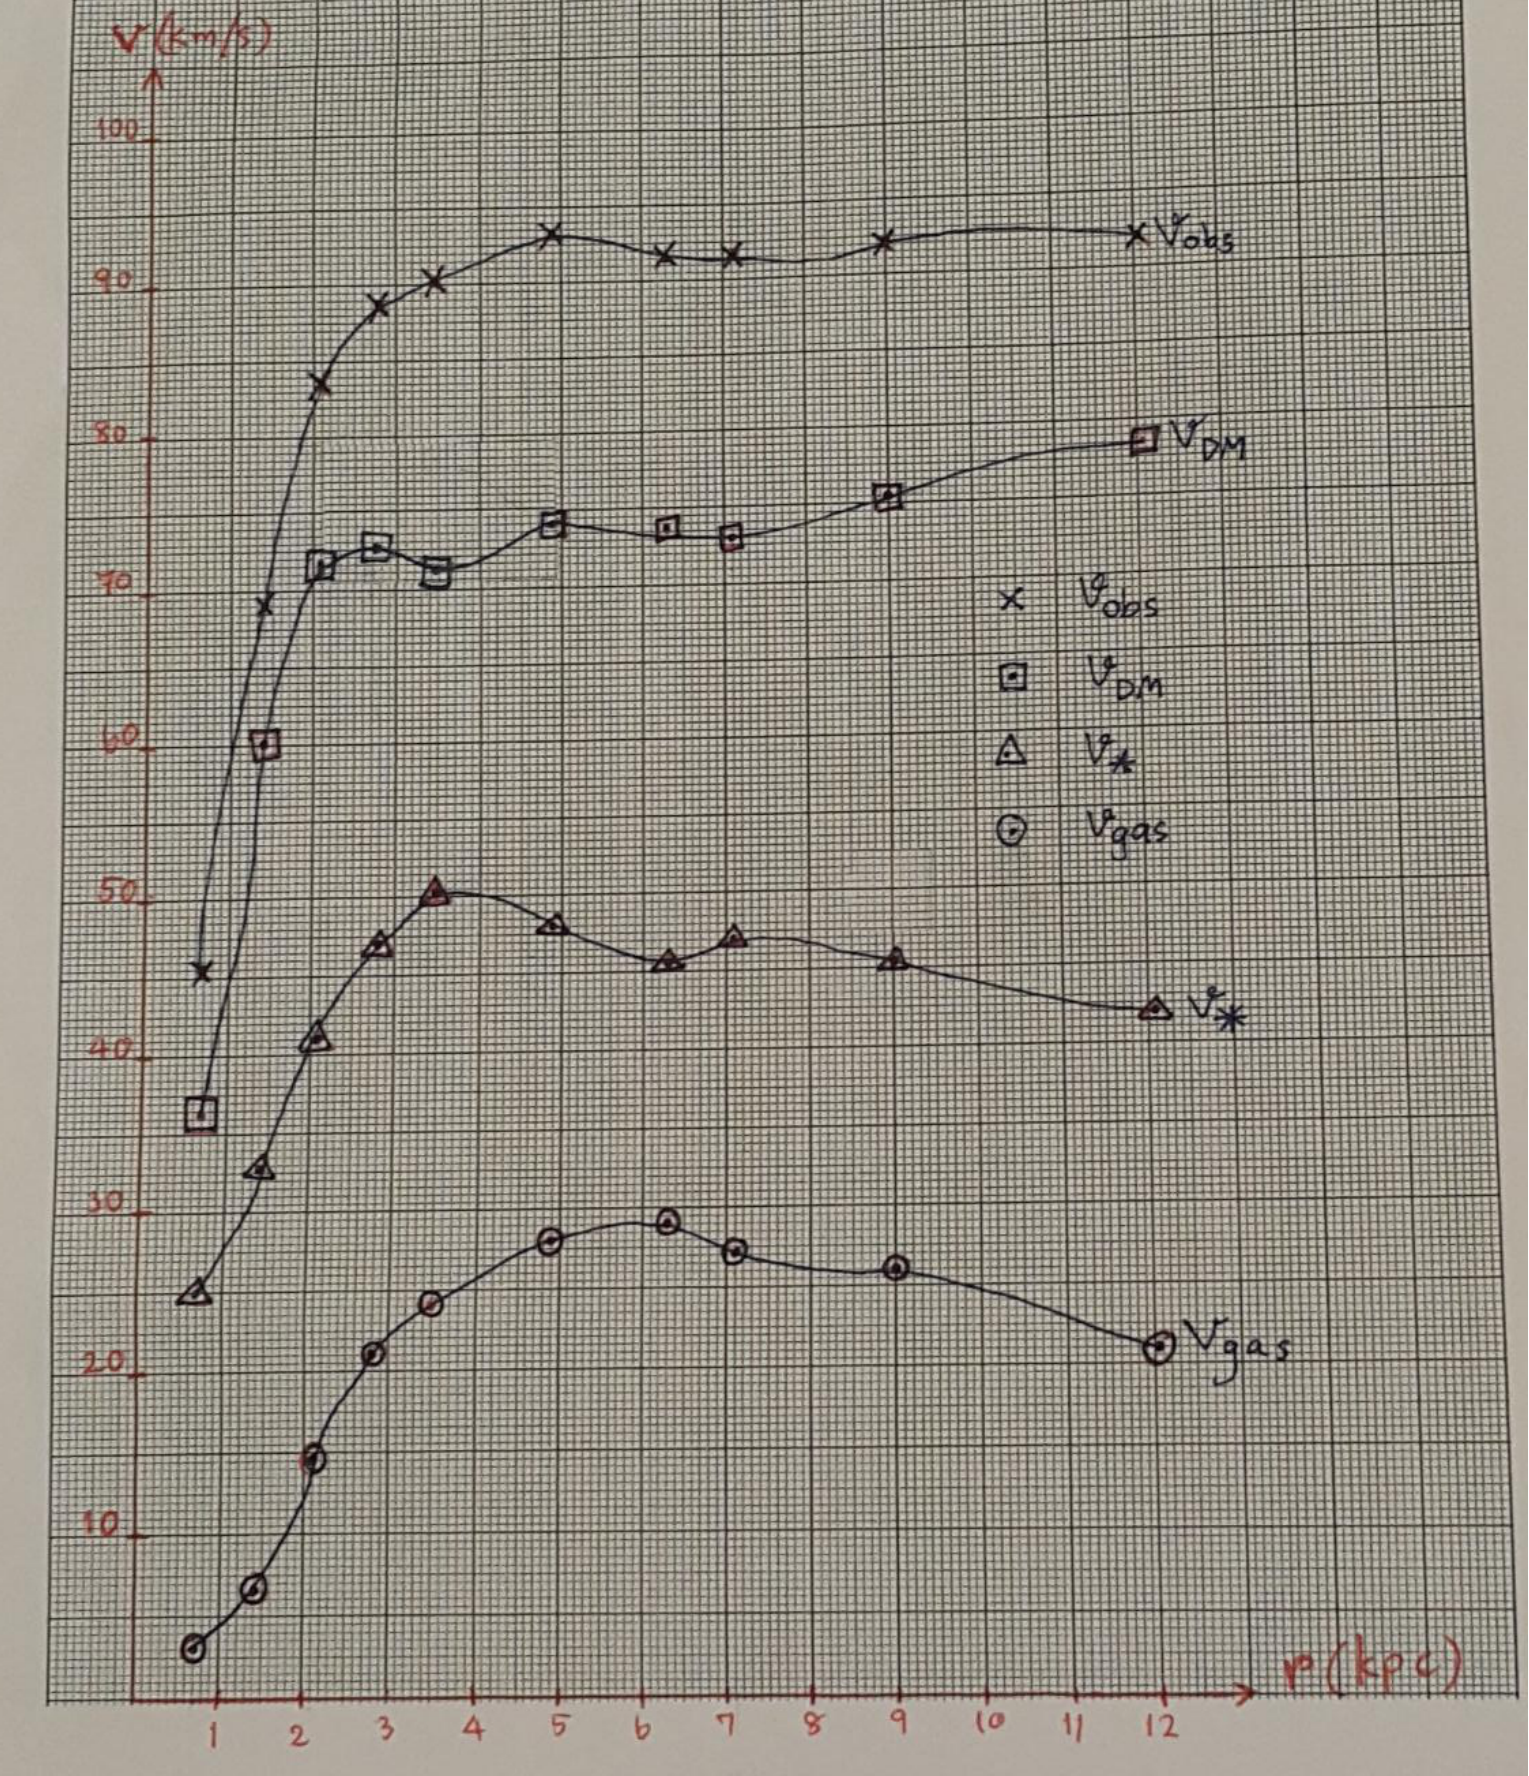
- Plot uses more than 50% of graph paper: 1.0
- Both axes labels ( and ) and their units presented: 2.0
- Ticks and values on axes (or scale written explicitly): 1.0
- All plots labels (, , , ) presented: 2.0, each label gets 0.5 mark
- Points correctly plotted: 4 (0.1 for each point) Values of , wrong due to wrong values of gets a maximum of 4.0 marks
- Smooth curve through points: 4.0 (1.0 per curve)
- Order of contribution: 2.0, correct order only
(D2.3) Take a data points at small and large to estimate and . Note that for large values of , and at small , . [7]
Solution
Evaluating for :
, where [1.0]
, for small [1.0]
[1.5]
Selected correct data to put into the formula gets 0.5, correct answer gets 0.5 and correct unit gets 0.5.
Evaluating for (Method 1):
, [1.0]
Take the last two data points at large , then we get (for
[1.5]
[1.0]
Evaluating for (Method 2):
, [1.0]
Take the last data point, we get a cubic equation which students can solve to give
kpc [1.0]
Select the correct 0.964 for the final answer because for the last data point [1.5]
Less accurate :
Omit the last term,
[1.0]
[1.0]
Part 2 Dark matter distribution
(D2.4) By comparing Equation (4) to a linear function, the central density could also be found by a linear fit. Plot an appropriate graph so that a linear fit can be used to find another value of . Evaluate in units of (mark your graph as “D2.4”). If you cannot find the value of from the previous part, use 3.2 kpc as an estimate for this part. [19]
Solution 1:
| (kpc) | (kg) |
|---|---|
| 0.010855 | 2.02x10 |
| 0.0803 | 1.18x10 |
| 0.2386 | 2.49x10 |
| 0.495 | 3.41x10 |
| 0.838 | 4.06x10 |
| 1.718 | 6.27x10 |
| 2.738 | 7.88x10 |
| 3.428 | 8.80x10 |
| 5.093 | 1.20x10 |
| 7.854 | 1.74x10 |
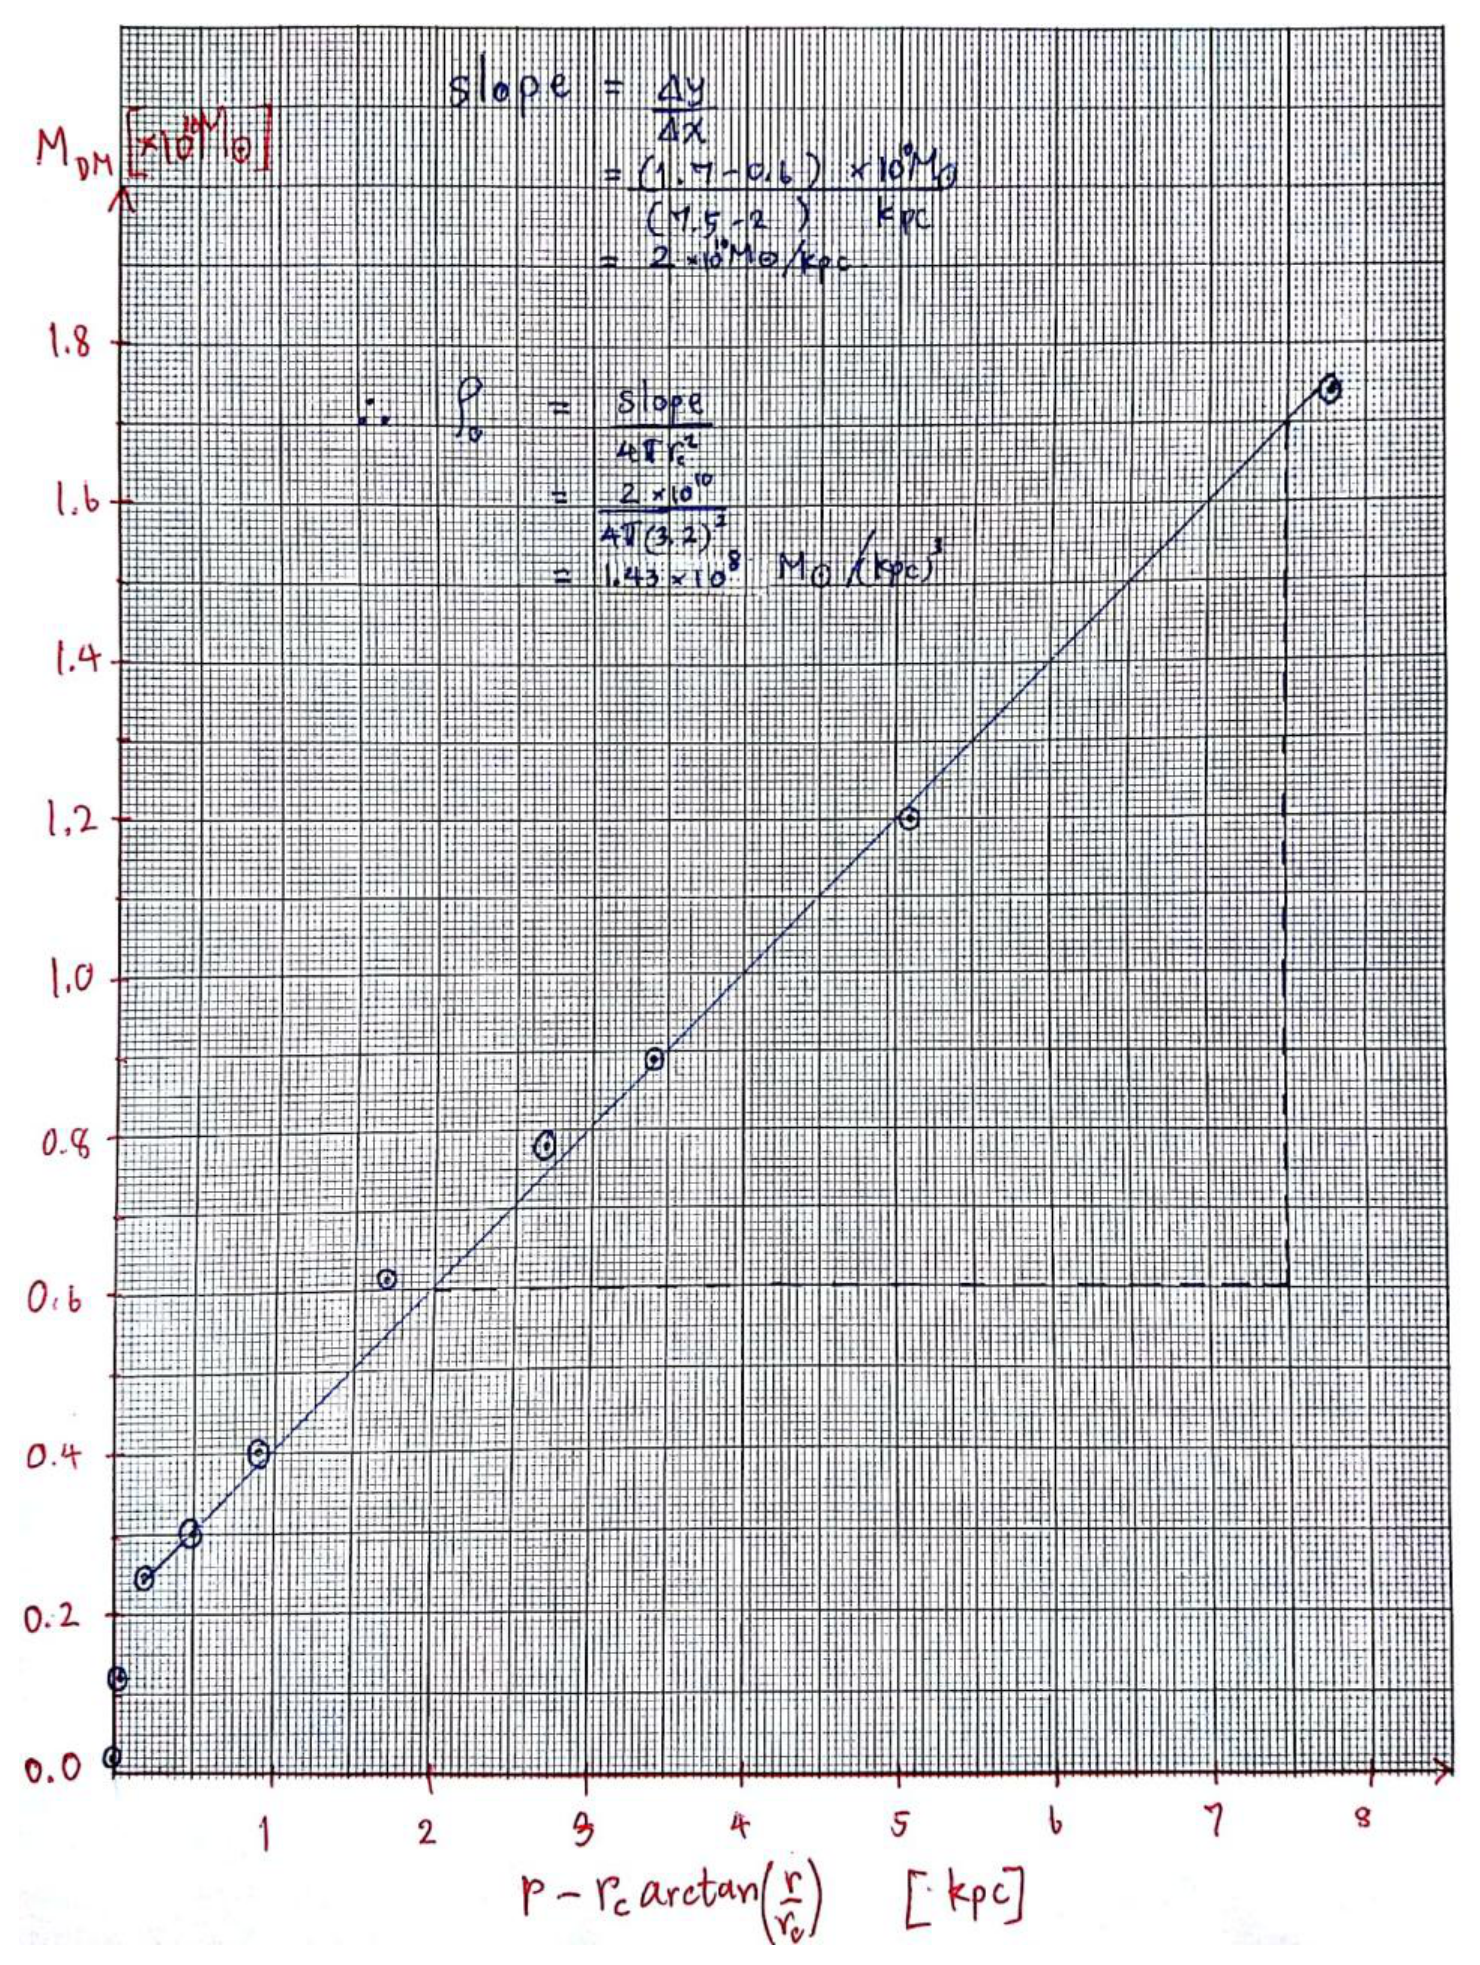
- Choose correct axes: 1.0, each correct axis get 0.5 mark
- Values correctly computed: 8.0 (0.4 for each value, 20 data points)
- Plot uses more than 50% of graph paper: 1.0
- Both axes labels presented: 1.0
- Ticks and values on axes (or scale written explicitly): 1.0
- Points correctly plotted: 4.0 (0.2 for each point, 20 data points) Values of x axis wrong due to previous wrong values get a maximum of 2.0 marks
- Credit for good visual linear fit: 1.0
- Correct value of slope: 1.0
- Correct value of : 1.0
Solution 2:
| () | |
|---|---|
| 0.984 | 2.89x10 |
| 0.943 | 8.40 x10 |
| 0.886 | 1.19x10 |
| 0.822 | 1.22x10 |
| 0.760 | 1.16x10 |
| 0.649 | 1.28x10 |
| 0.562 | 1.26x10 |
| 0.517 | 1.24x10 |
| 0.436 | 1.33x10 |
| 0.348 | 1.44x10 |
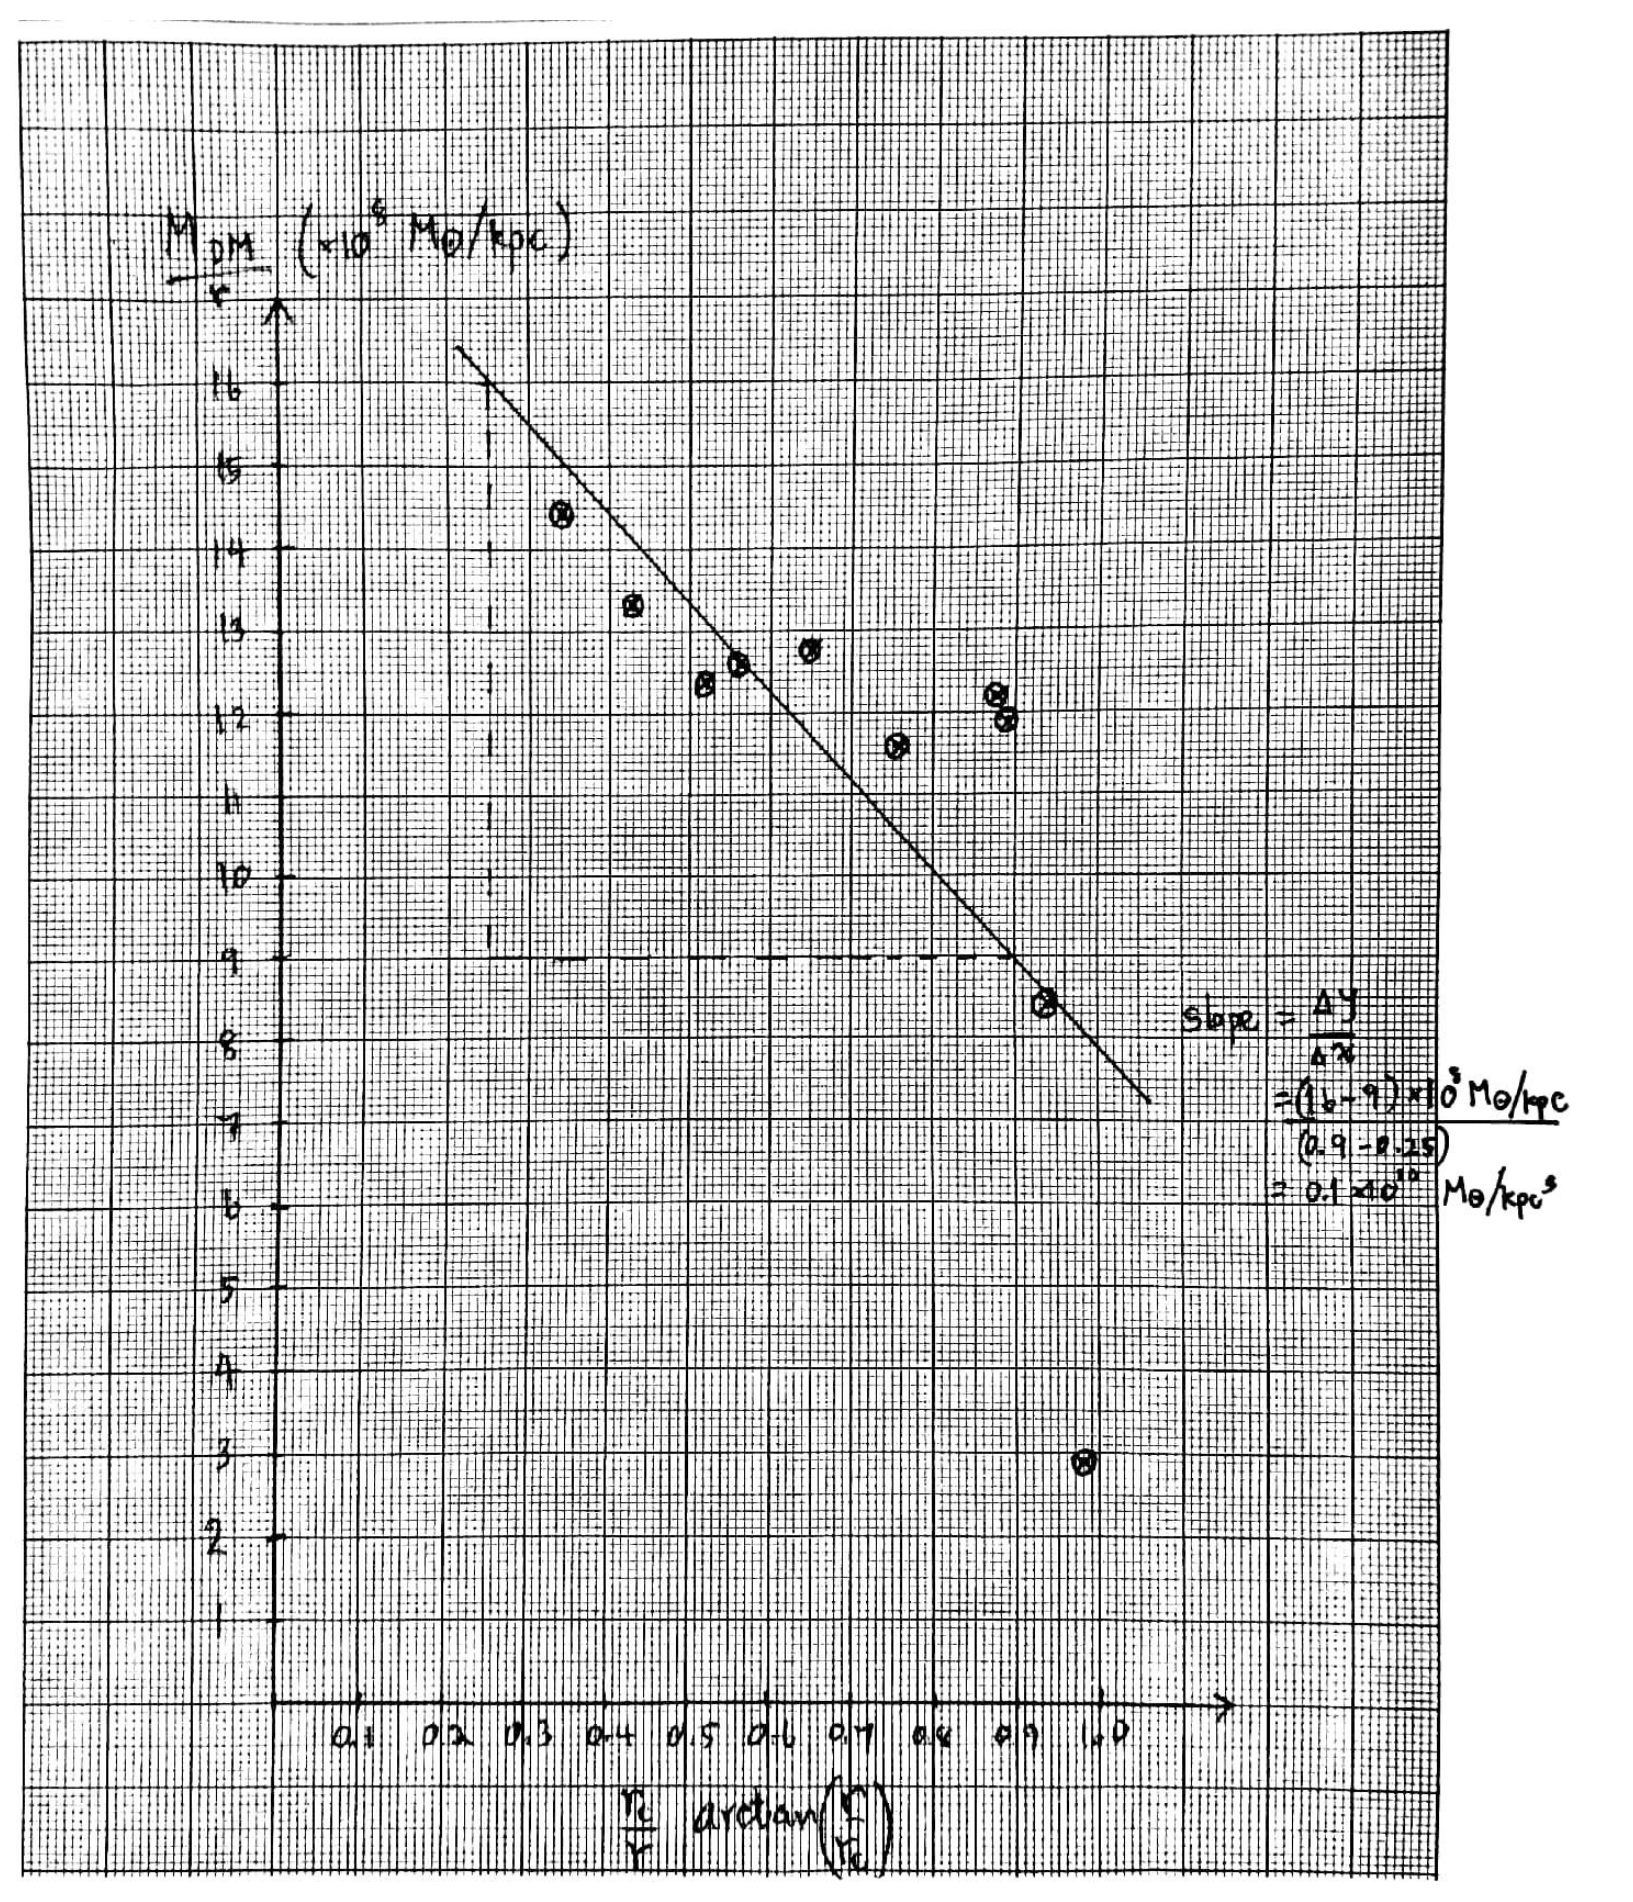
- Choose correct axes: 1.0, each correct axis get 0.5 mark
- Values correctly computed: 8.0 (0.4 for each value, 20 data points)
- Plot uses more than 50% of graph paper: 1.0
- Both axes labels presented: 1.0
- Ticks and values on axes (or scale written explicitly): 1.0
- Points correctly plotted: 4.0 (0.2 for each point, 20 data points) Values of x axis wrong due to previous wrong values gets a maximum of 2.0 marks
- Credit for good visual linear fit: 1.0
- Correct value of slope: 1.0
- Correct value of : 1.0
(D2.5) Compute logarithmic values of the dark matter density, ln [(r)], and plot the distribution of the dark matter in the galaxy as a function of radius on graph paper (mark your graph as “D2.5”). [12]
Solution 1: from D2.3
| (kpc) | ln [(r)] () |
|---|---|
| 0.70 | 16.11 |
| 1.40 | 15.36 |
| 2.09 | 14.73 |
| 2.79 | 14.23 |
| 3.49 | 13.81 |
| 4.89 | 13.17 |
| 6.25 | 12.69 |
| 7.10 | 12.44 |
| 9.03 | 11.97 |
| 12.05 | 11.40 |
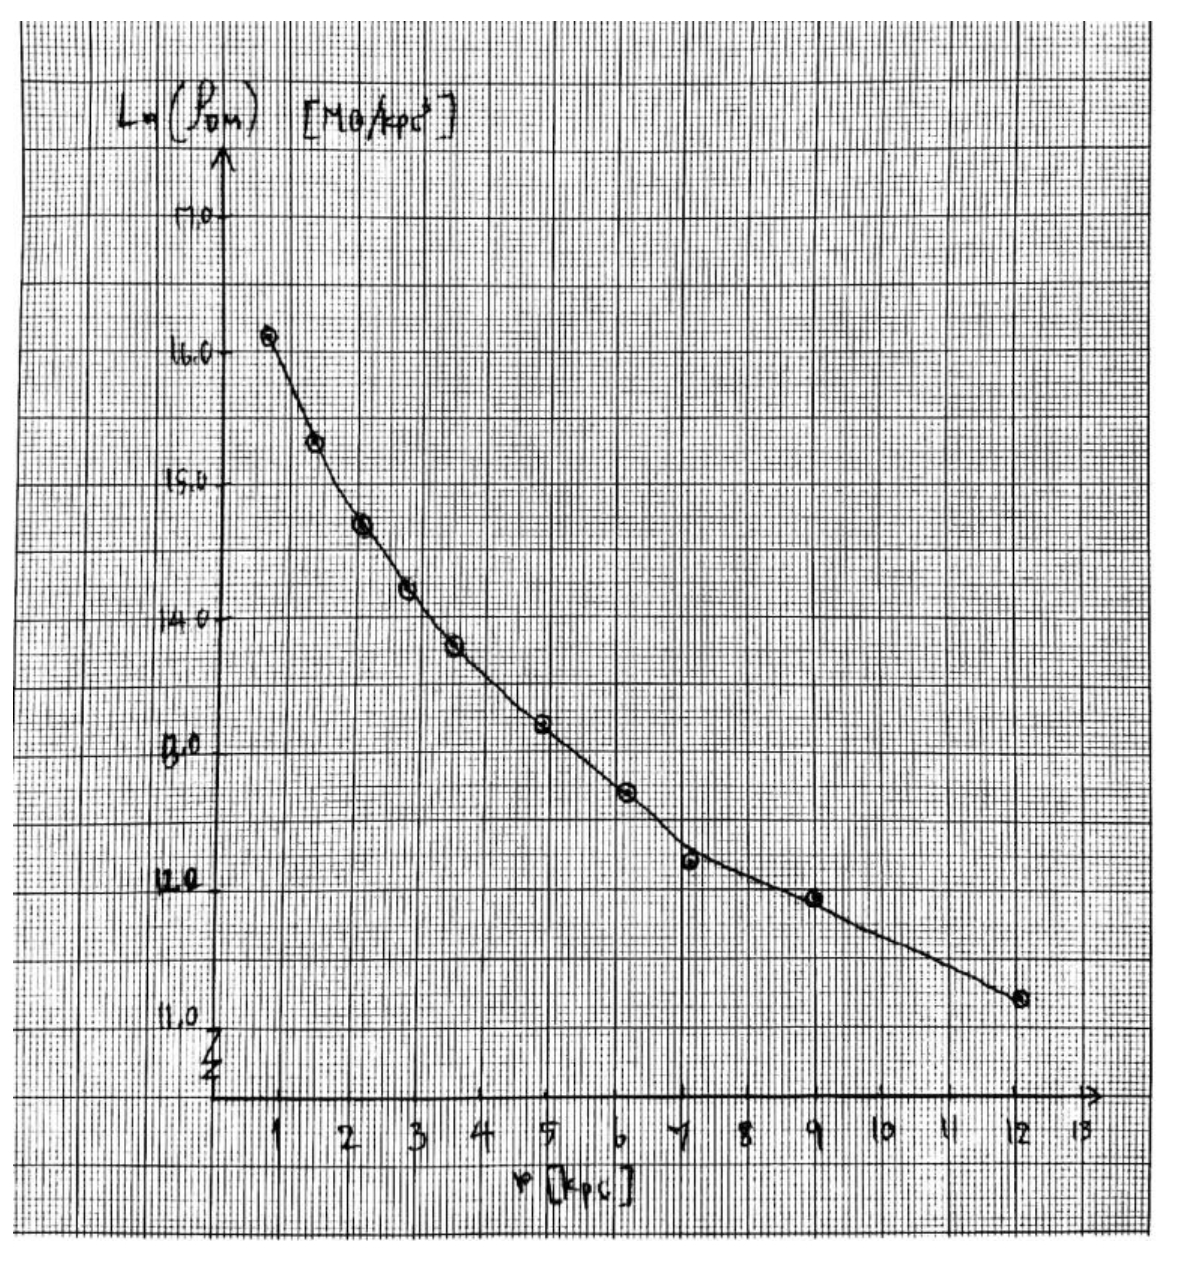
- Values correctly computed: 4.0 (0.4 for each values, 10 data points) Values of ln [(r)] wrong due to the wrong value of gets a maximum of 2.0 marks
- Plot uses more than 50% of graph paper: 1.0
- Both axes labels presented: 1.0
- Ticks and values on axes (or scale written explicitly): 1.0
- Points correctly plotted: 4.0 (0.4 for each point, 10 data points) Values of ln [(r)] wrong due to previous wrong values gets a maximum of 2.0 marks
- Smooth curve through points: 1.0
Solution 2:
| (kpc) | ln [(r)] () |
|---|---|
| 0.70 | 12.79 |
| 1.40 | 11.95 |
| 2.09 | 11.47 |
| 2.79 | 11.21 |
| 3.49 | 11.07 |
| 4.89 | 11.16 |
| 6.25 | 11.26 |
| 7.10 | 11.16 |
| 9.03 | 11.27 |
| 12.05 | 11.41 |
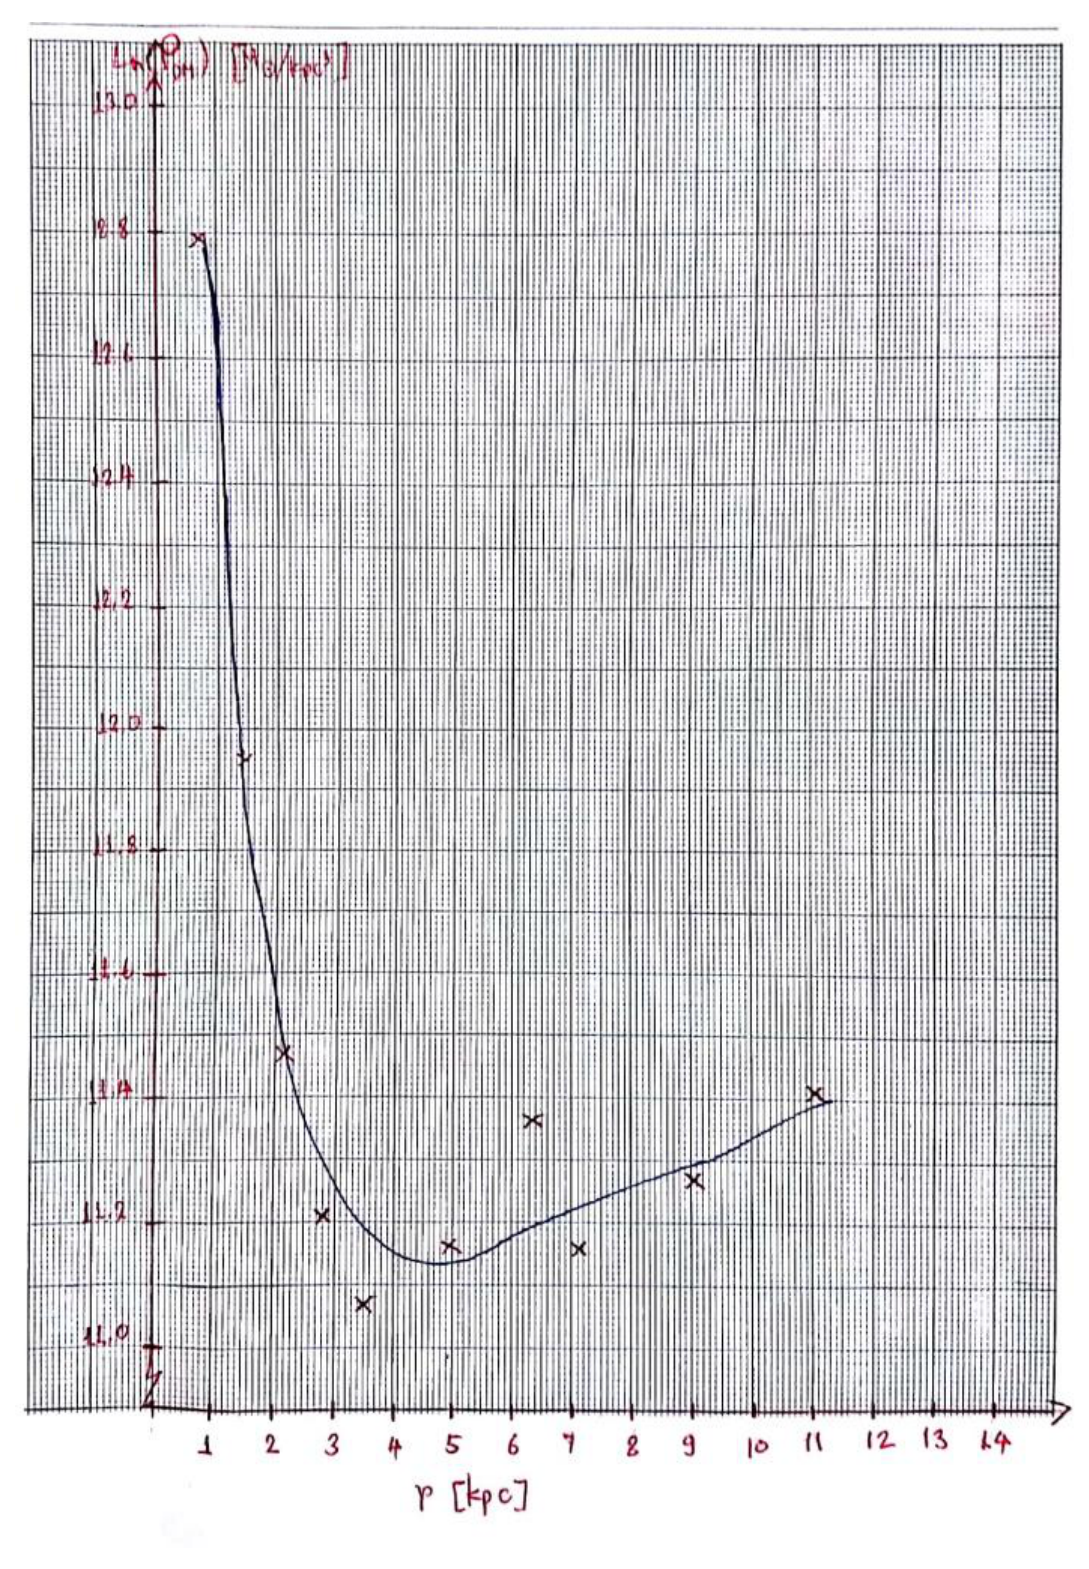
- Values correctly computed: 4.0 (0.4 for each values, 10 data points) Values of ln [(r)] wrong due to the wrong value of gets a maximum of 2.0 marks
- Plot uses more than 50% of graph paper: 1.0
- Both axes labels presented: 1.0
- Ticks and values on axes (or scale written explicitly): 1.0
- Points correctly plotted: 4.0 (0.4 for each point, 10 data points) Values of ln [(r)] wrong due to previous wrong values gets a maximum of 2.0 marks
- Smooth curve through points: 1.0
Оригинал в Архива: DataAnalysis.pdf · официални решения: DataAnalysis_Solution.pdf