IOAA 2021, Отборен тур — Задача 1. Group Radio Astronomy
Team Competition — Q1 — Group Radio Astronomy (115 points) · 115 т.
Внимание: Бележка към темата
The original CSV is linked with the statement. It contains 1024 spectra and 172 velocity columns (173 columns including longitude), although the printed question says 173 velocity values. The worked spreadsheet referenced in the official solution is absent from the 2021 archive inventory; the complete supplied PDF solution and its 17-row table are reproduced. Figure S3 says 20pointings despite the 17-row table; the Norma marking scheme refers toFigure S4; these source discrepancies are retained. The constants sheet prints 23d rather than 23h for one sidereal day and omits the solar symbol in several labels; original notation is retained.
General instructions: Group Radio Astronomy (115 points)
November 17, 2021.The team competition lasts for 3 hours (in a 30 hour window) and is worth a total of 115 points.
- Each country will receive the Team Competition as soon as the Theoretical exam is finished
- Any offline spreadsheet or similar tool may be used in this competition.
- The answers should be sent by 21:00 (UTC) on the 18th of November 2021.
- There would be only one Word file per team and should be labeled as XXX-Y-Team.docx. Here XXX represents a three letter country code (supervisors may refer to the standard list of International Olympic Committee codes) and Y will be replaced with either M (main) or G (guest). e.g COL-M-Team.docx
- All tables, plots etc. should be copy-pasted in the Word file.
- Some parts of this question expect you to write short answers in words. You may type these answers in your language. However, do not use complex words. For grading purposes, your answer will be translated into Spanish / English using a computer program.
- If you have drawn any diagrams by hand and want to include them in the solution, ask the team supervisors to take a photo of your diagram and give you the jpg file.
- You should export the word file to PDF so that the supervisors can upload your answers.
Условие
Please read the general instructions in the separate envelope before you start this problem.
Measuring the Perseus arm using 21 cm HI line data
Context
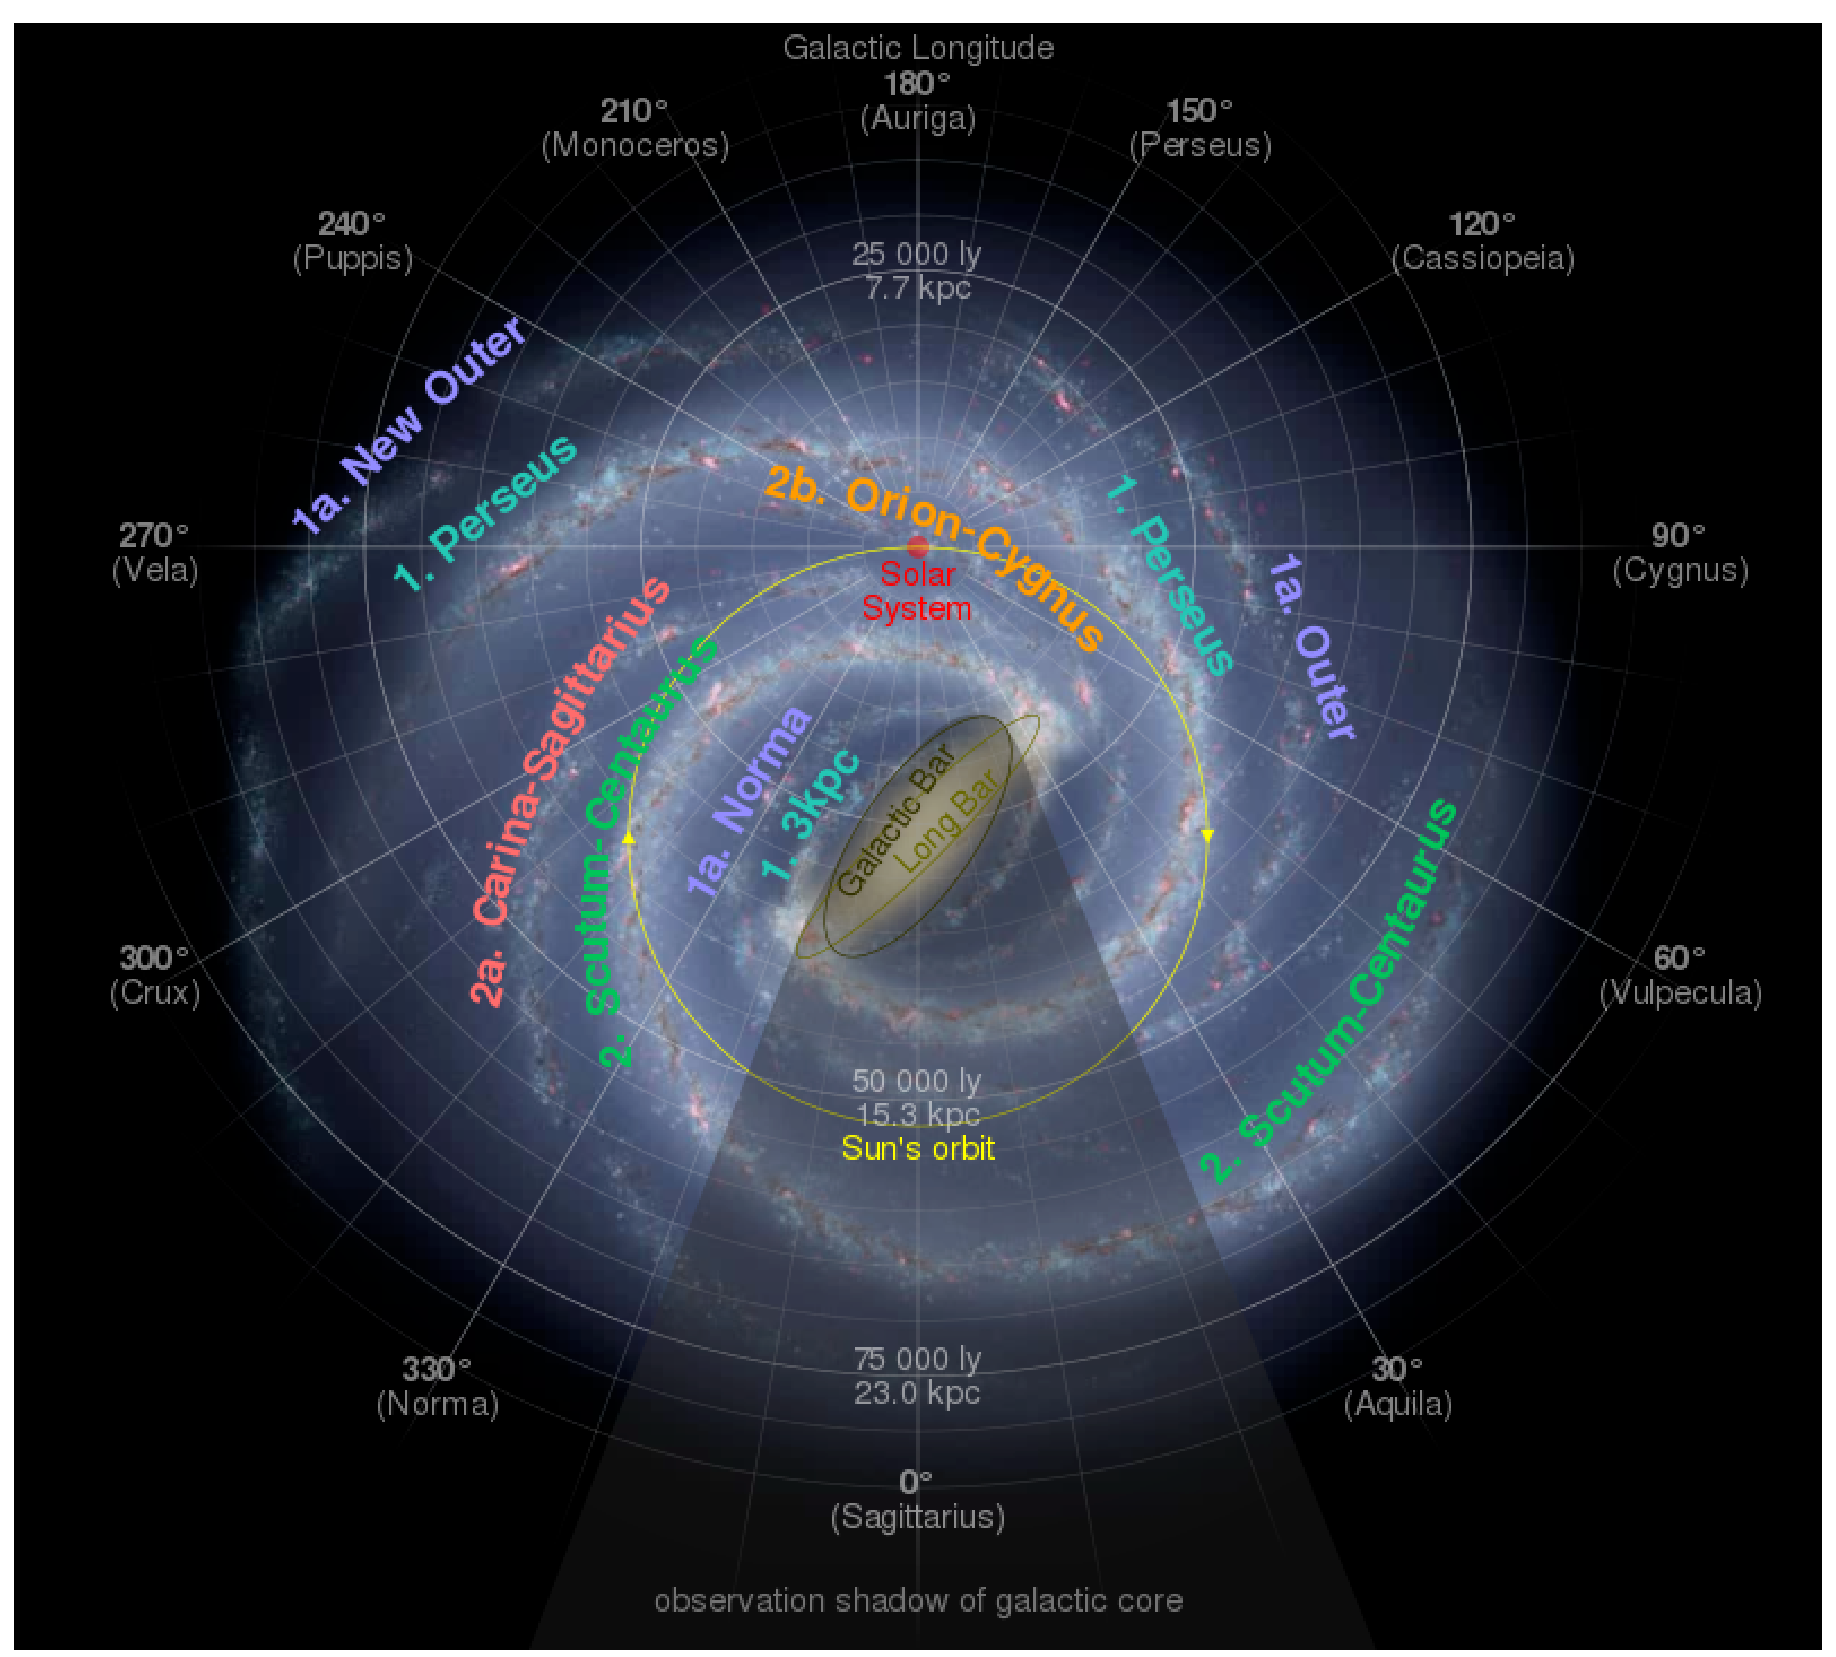
Our goal here is to kinematically estimate the distance of (part of) the Perseus Arm of the Milky Way (Figure 1), from the center of the Milky Way, based on the line-of-sight velocity of neutral hydrogen gas via its 21 cm emission line.
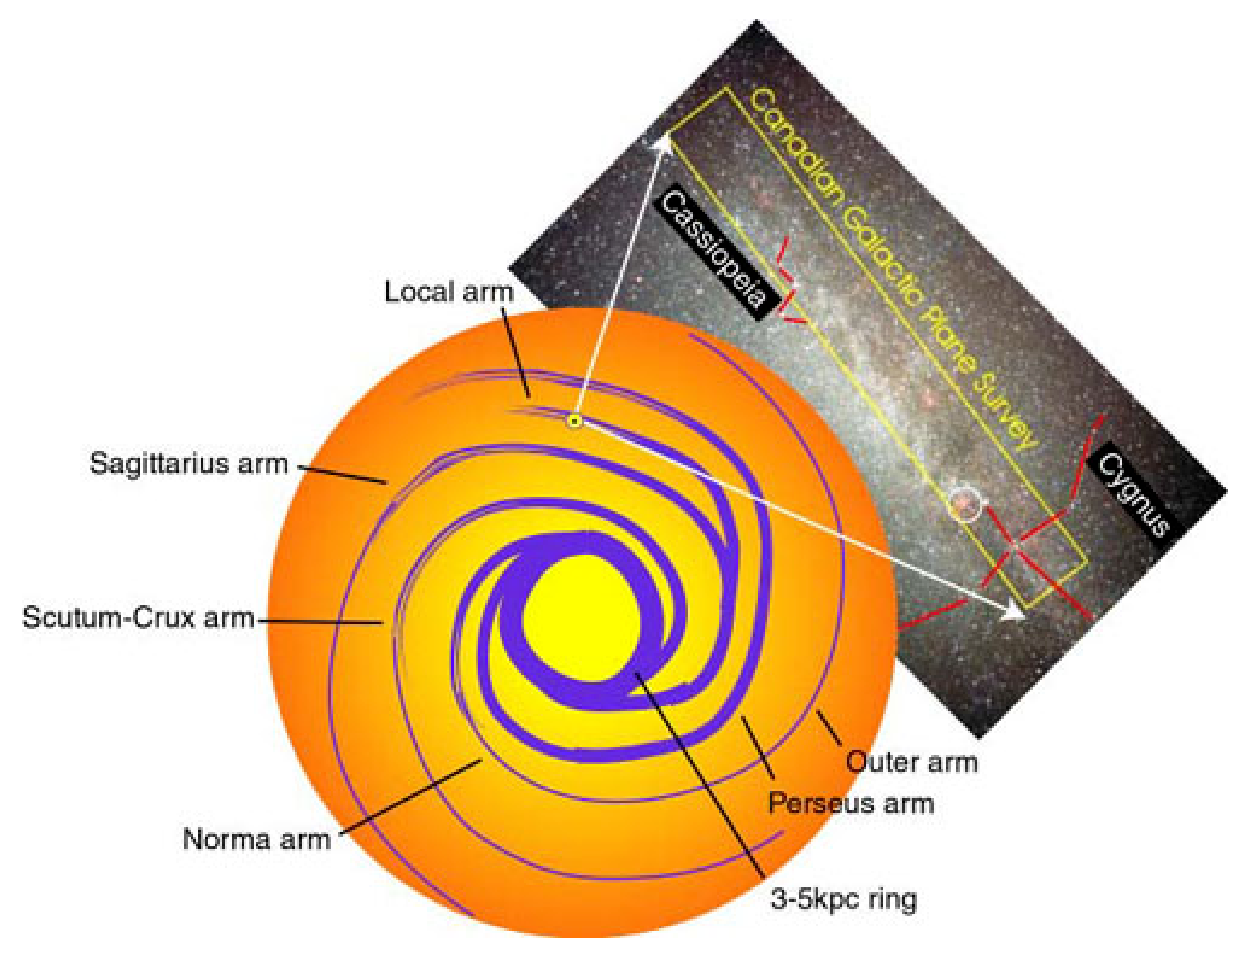
For this problem we will use a subset of the Canadian Galactic Plane Survey (CGPS, Figure 2), in which individual radio telescope pointings can each yield the 21 cm line spectrum emitted by all the galactic neutral hydrogen along the line of sight of the radio telescope.
By translating the Doppler wavelength shift of the 21 cm emission to a line-of-sight velocity, it is then possible to identify individual emission components that correspond to distinct galactic arms. This identification allows for a reconstruction of the shape of each arm with respect to the Galactic Center.
In the spectrum corresponding to a radio telescope pointing, the Perseus arm can be readily identified because it is often the brightest feature along each line of sight.
The frame of reference of the radio telescope observations can be taken to be the Sun, located at a distance from the Galactic Center (GC). The telescope has a pointing along a Line of Sight (LOS) defined by a galactic longitude and a fixed galactic latitude . Along this LOS, the telescope picks up the emission of a parcel of neutral H gas from the Perseus arm that is located at a distance from the Sun. This same parcel of gas is located at a distance from the Galactic Center. Let us assume that both the Sun and the gas parcel are in exact circular orbits around the GC. Additionally, it can be assumed that both the Sun and the gas parcel are in the region where the rotation curve of the Milky Way is flat. The measured (Doppler) velocity is denoted as , which equals to the velocity of the gas parcel along the line of sight.
Data set
For this problem we attach a .csv file (21cmsurvey_full.csv, Excel and other spreadsheet software-readable) which contain 21 cm HI line brightness temperature data vs. line-of-sight velocity for a range of galactic longitudes (for galactic latitude ).
Row 1: Line-of-sight velocities (173 values, units: ).
Column 1 (after row 1): Galactic Longitude (1024 values, units: ).
Rows 2-1025: 21 cm HI Brightness Temperature (units: ). Each row yields the spectrum for the pointing defined by (row name - column 1). There are thus 1024 spectra. Each spectrum has 173 measurements, one for each .
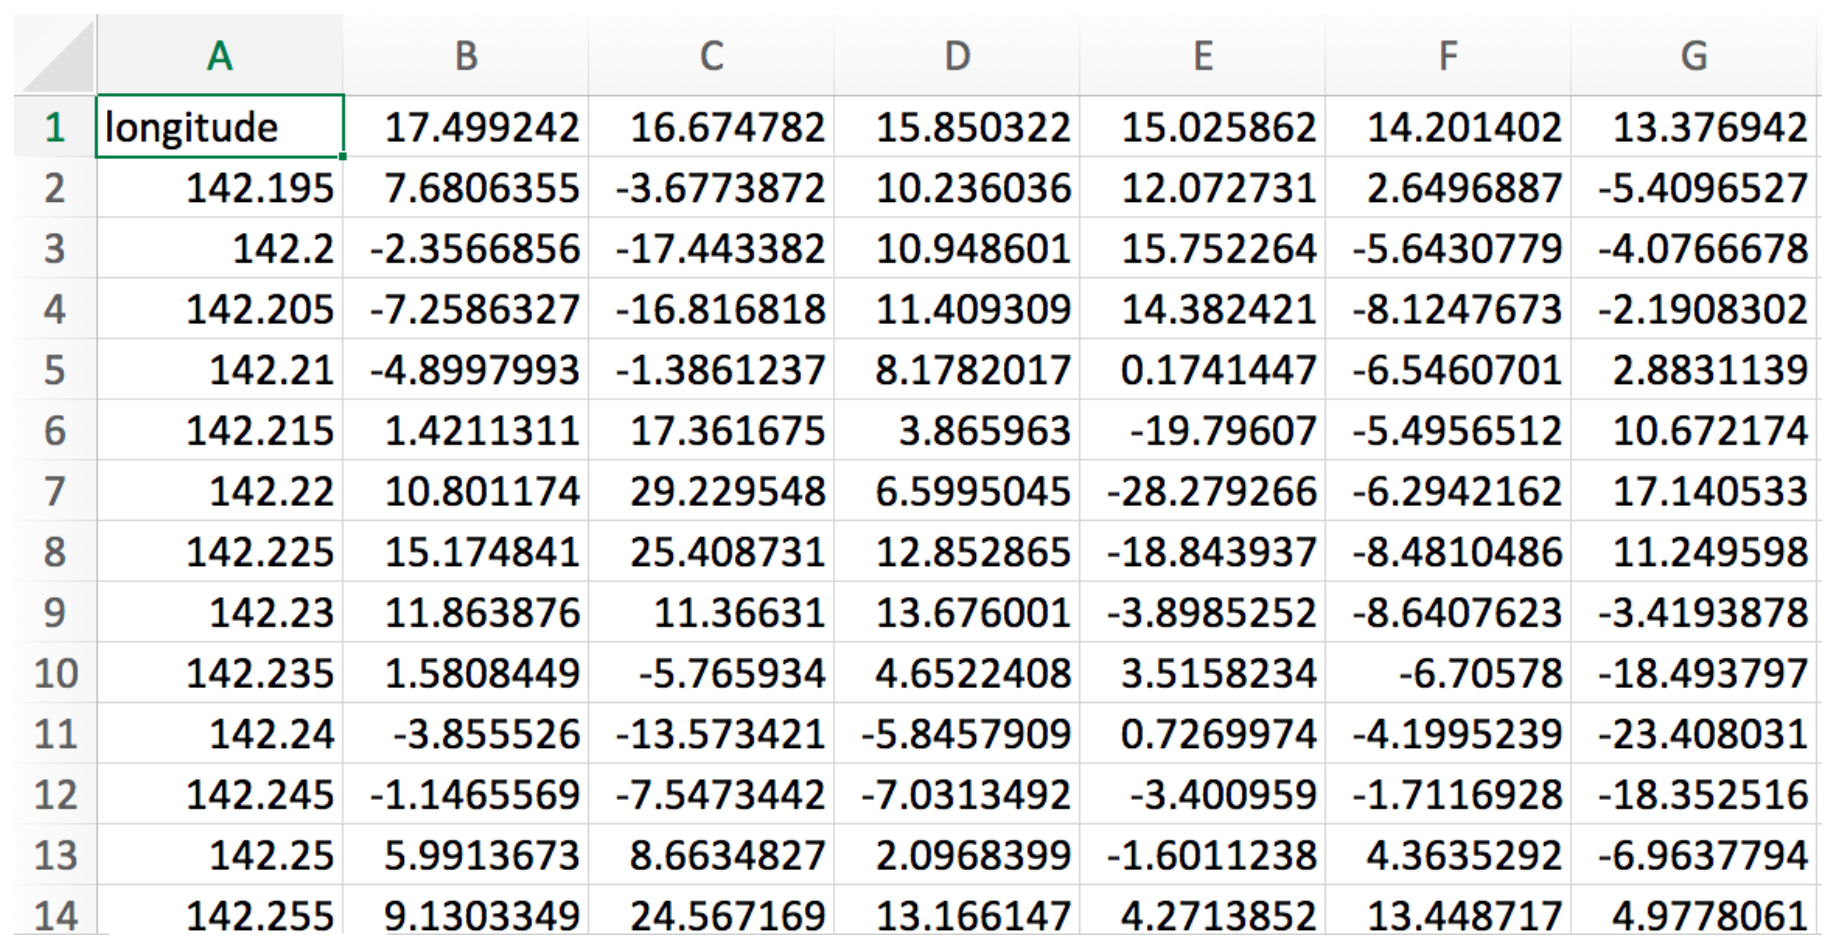
Download the original 21cmsurvey_full.csv.
Part 1 (50 т.)
1.1 Make a spectral plot of vs. for an adequate number of different values (at least 20 plots) of galactic longitudes covering the full range of observations. Identify the peak line of sight velocity of the Perseus gas parcel at each of the plotted longitudes. Make sure to evenly sample the data set.
Note: Use the plot of the first or the last longitude as a guide to identify correct peaks in the plots at the intermediate longitudes. [45 т.]
1.2 Why does the emission near (which we associate with our local arm) have a lower brightness temperature than the emission from the Perseus arm? [5 т.]
Part 2 (20 т.)
2.1 Derive an expression to calculate from , , and . You can assume:
- That both the Solar System and and the Perseus arm gas parcel along the line of sight have a purely tangential velocity, with a negligible radial component.
- A flat galactic rotation curve, i.e.
where v is the velocity of the gas parcel. [20 т.]
Part 3 (20 т.)
3.1 Using the values you found earlier, make a plot of galactic longitude vs. (radius with respect to the Galactic Center, in kpc) for the Perseus arm. Find the average distance of the Perseus arm for the given longitude range. Also report the standard deviation in your result. Use the values:
[20 т.]
Part 4 (25 т.)
4.1 The data also shows 21cm emission from the Norma arm of the Milky Way, which is its outer arm. This emission is most clearly seen around the galactic longitude of . Repeat the exercise for the Norma arm to find its distance from GC. Use at least 5 data points to determine the distance of the Norma arm from the Galactic Centre (at these galactic longitudes). [25 т.]
Отговори
Part 2, 2.1
Part 3, 3.1 11.4 kpc
Official solution: R = 11.4 ± 0.3 kpc (mean and standard deviation); the marking scheme accepts values within 0.2 kpc of this.
Part 4, 4.1 14.3 kpc
Official solution: R = 14.3 ± 0.3 kpc (mean and standard deviation of 7 data points); the marking scheme accepts values within 1 kpc of this.
Решение
1. (a)
(Without the fitted orange lines) - also see spreadsheet in the folder
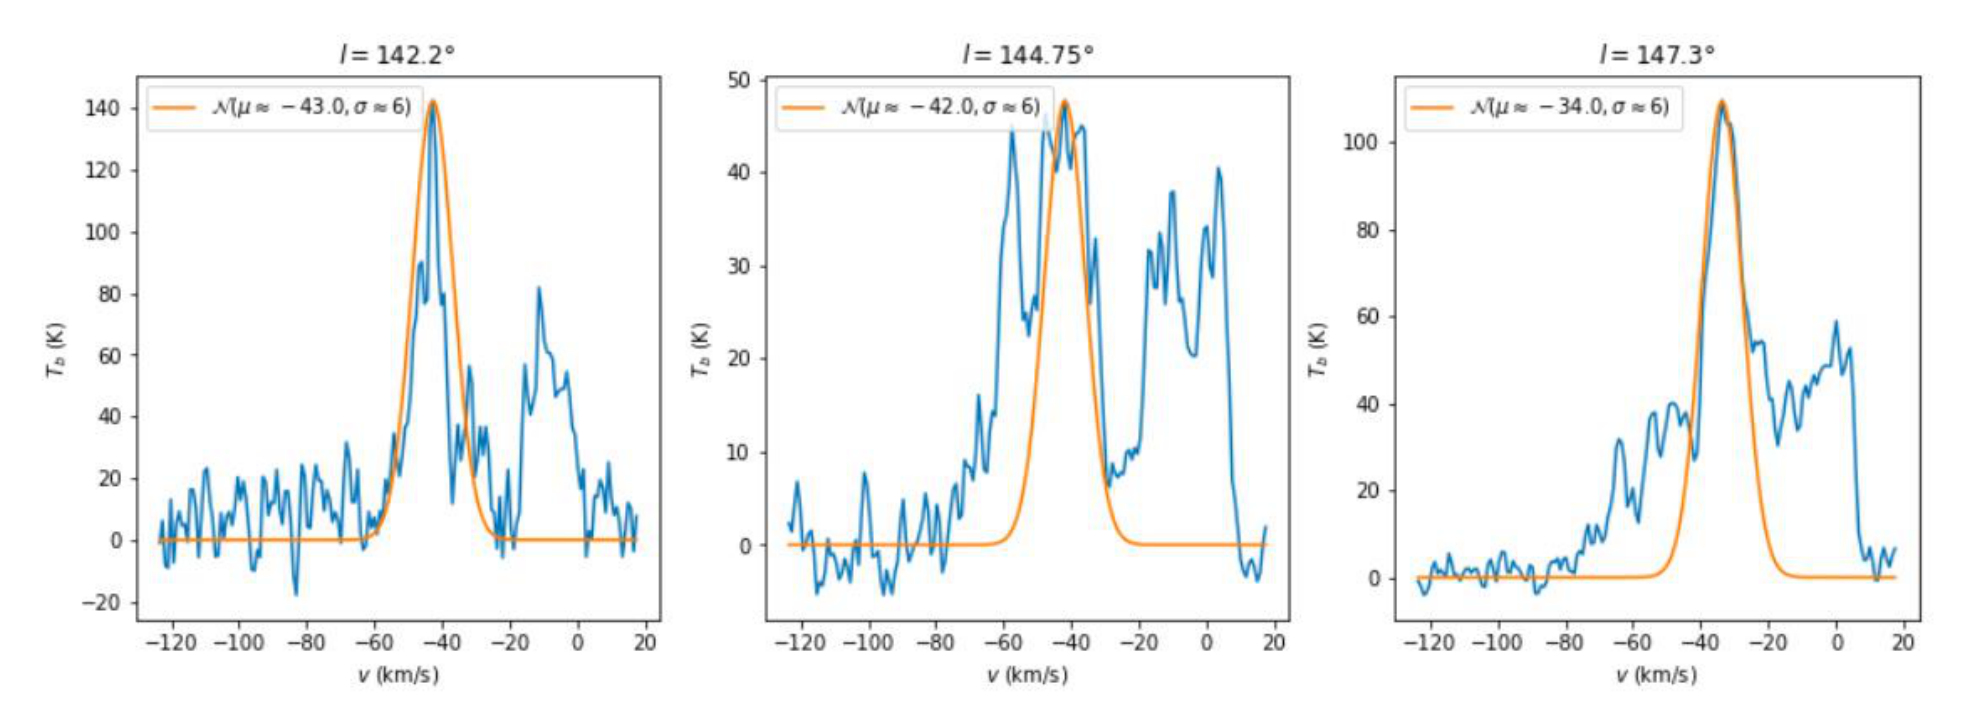
Marking Scheme:
- Check how many plots at different longitudes they include in their solution. Each plot should include the correct scale and axis labeling (see Fig. S1): 1 point per plot. Maximum 20 points.
- If they maintain equal longitude spacing between consecutive plots: 5 points
- Correct identification of the 21 cm peak in each spectrum, within ±2 km/s for each of the plots: 1 point per plot. Maximum 20 points. Note: Use Table S1 to check values (not R, they are checked later). Keep in mind that they will not necessarily use the same longitude values, so they may be slightly different (within ±2 km/s of the nearest l value).
| l | R | |
|---|---|---|
| 142.195 | -42.69 | 11.586 |
| 142.51 | -41.04 | 11.423 |
| 142.83 | -41.86 | 11.560 |
| 143.15 | -37.33 | 11.059 |
| 143.47 | -40.21 | 11.433 |
| 143.79 | -42.69 | 11.785 |
| 144.11 | -41.04 | 11.613 |
| 144.43 | -41.86 | 11.762 |
| 144.75 | -42.27 | 11.861 |
| 145.07 | -39.39 | 11.523 |
| 145.39 | -39.39 | 11.564 |
| 145.71 | -38.15 | 11.445 |
| 146.03 | -37.33 | 11.378 |
| 146.35 | -36.09 | 11.259 |
| 146.67 | -34.85 | 11.141 |
| 146.99 | -32.79 | 10.922 |
| 147.31 | -32.38 | 10.906 |
Table S1. Possible values of , R for 17 equally spaced longitude values.
1. (b)
Assuming that the Sun is not located at the inner rim of our Local Arm, along any given line of sight we would not be able to pick up all the H emission, as some H belonging to our arm would be behind each line of sight and therefore would not show up in our observations.
Marking Scheme:
- The core of the solution is that they realize that each measurement does not include all the gas in our arm, but it does include all the gas in the Perseus and the Norma arm. Therefore, it is not straightforward to compare the amount of gas in our arm vs. the other arms from these measurements. 5 points for a correct answer, 0 points for all other answers.
2.
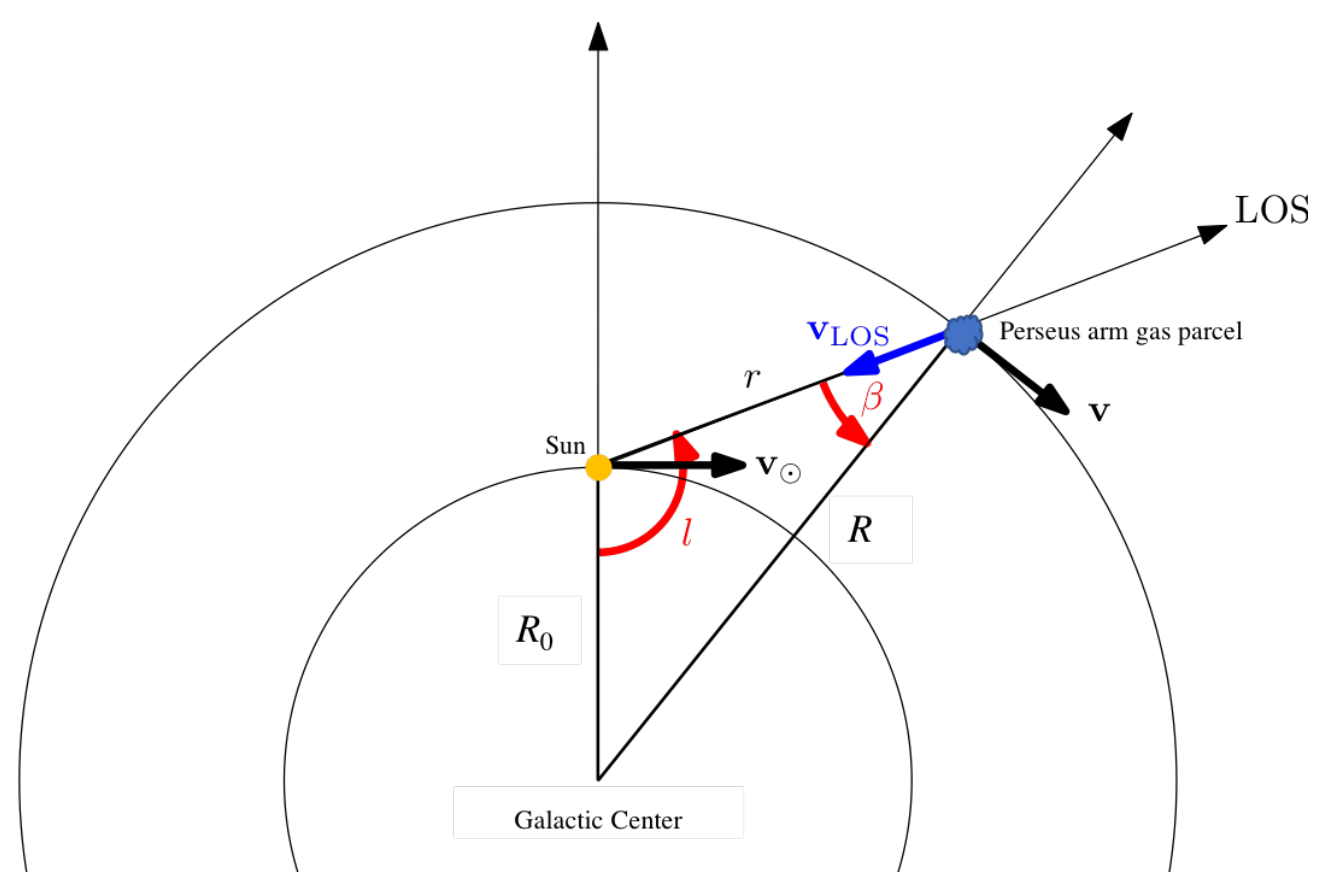
Marking scheme:
- If they include a clear figure similar to Fig. S2 accompanying their deduction: 5 points.
- Check that the deduction follows the same mathematical/geometrical principles as the following:
Inspection of the velocity vector components along the LOS in Fig. S2 yields,
Correctly deducing this equation: 10 points.
By the law of sines,
Substituting (1) above,
Correctly deducing this equation: 5 points.
3.
Perseus arm radius: R = 11.4 ± 0.3 kpc. Mean value and stdev as reported by libreoffice calc.
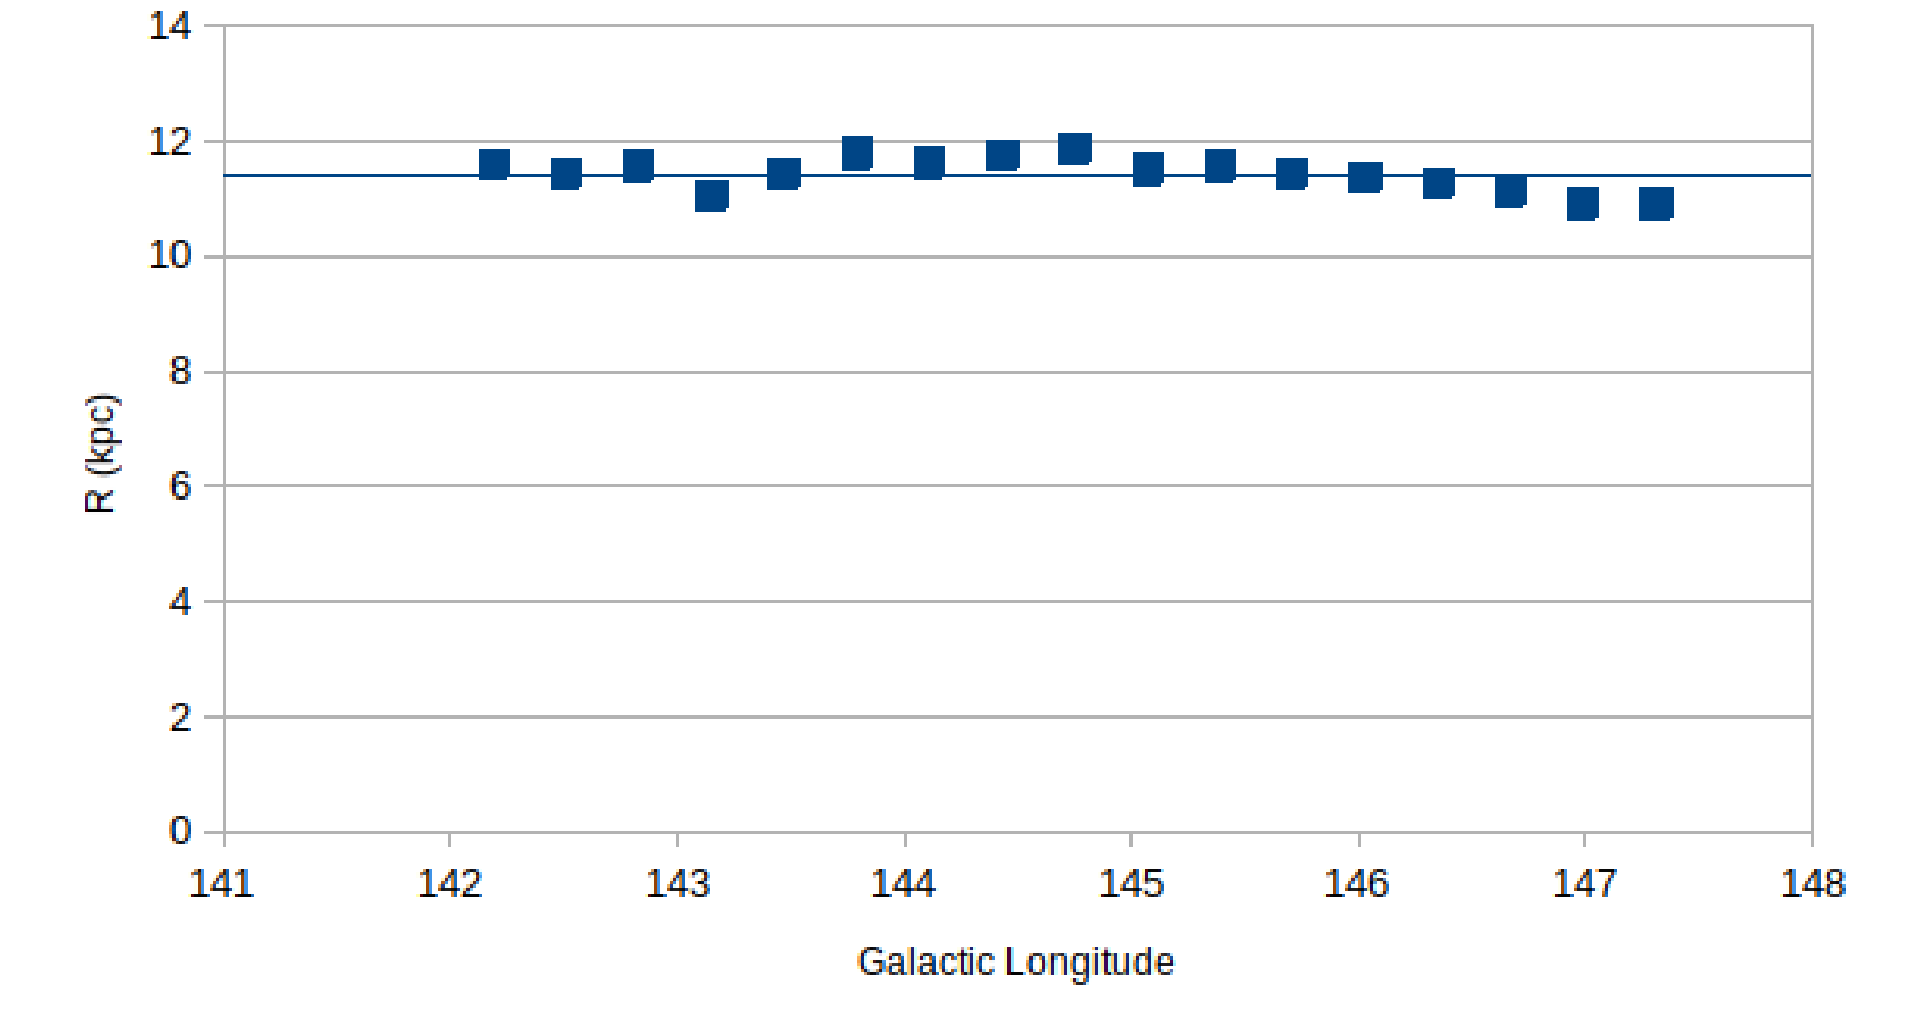
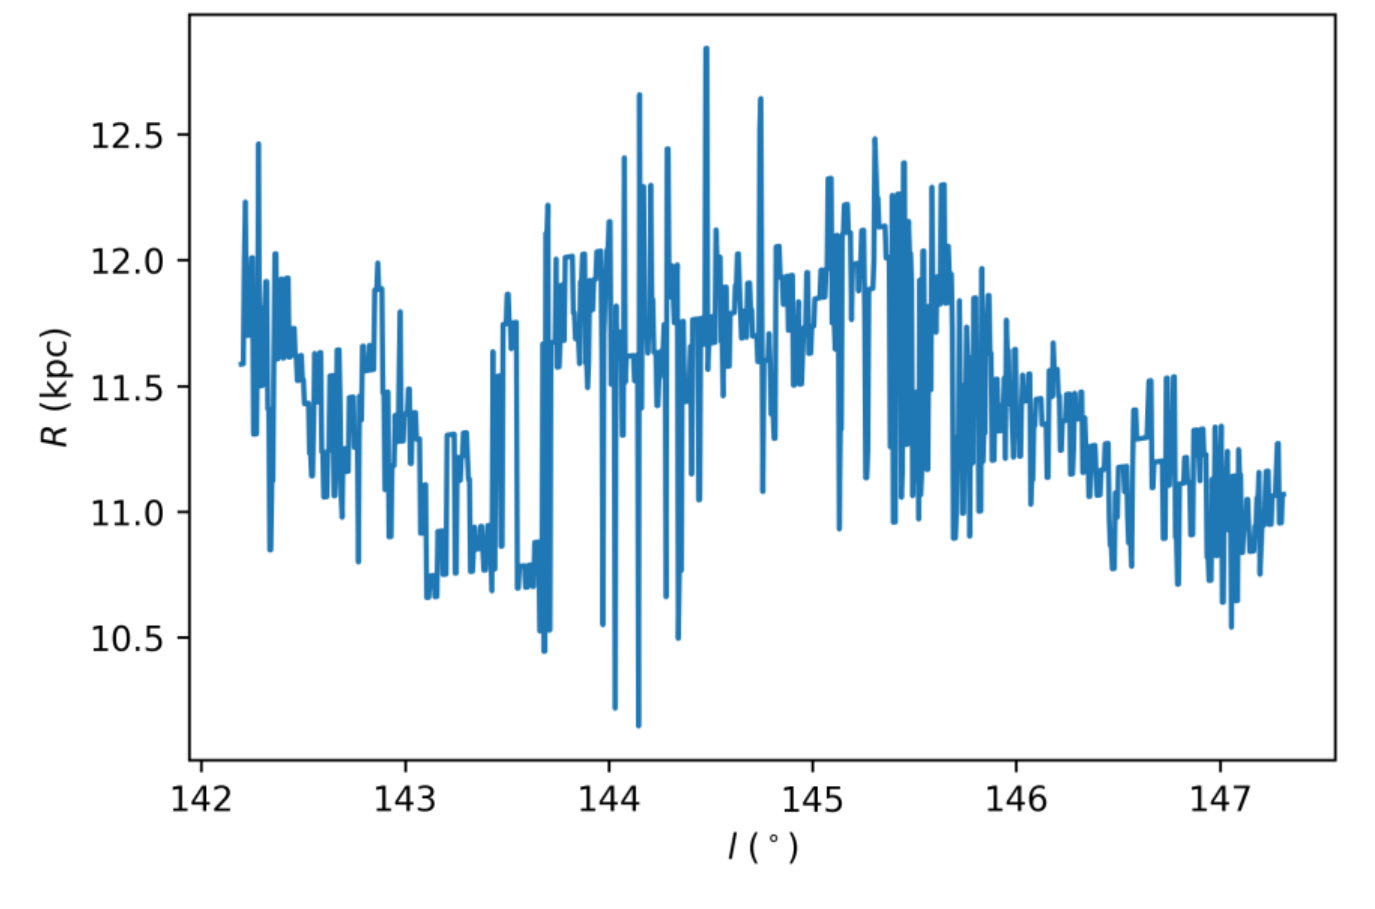
Marking scheme:
- Finding R values within 0.2 kpc of data points in Figs. S3 or S4 for more than 5 longitudes: 10 points.
- Note: Use Fig. S4 to compare data points in case their longitude values selection does not match the longitudes in Table S1.
- Check that they include a plot similar to Fig. S3 (properly labeled axes) from their data in part 1 of this problem. They should include at least 5 data points to make their conclusions meaningful and get full marks: 5 points.
- Get the final result with standard deviation (11.4 ± 0.3 kpc): 5 points Note: Their value should not differ by more than 0.2 kpc from this solution.
4.
Norma arm radius: R = 14.3 ± 0.3 kpc. Mean value and stdev as reported by libreoffice calc from 7 data points near the middle of the longitude range.
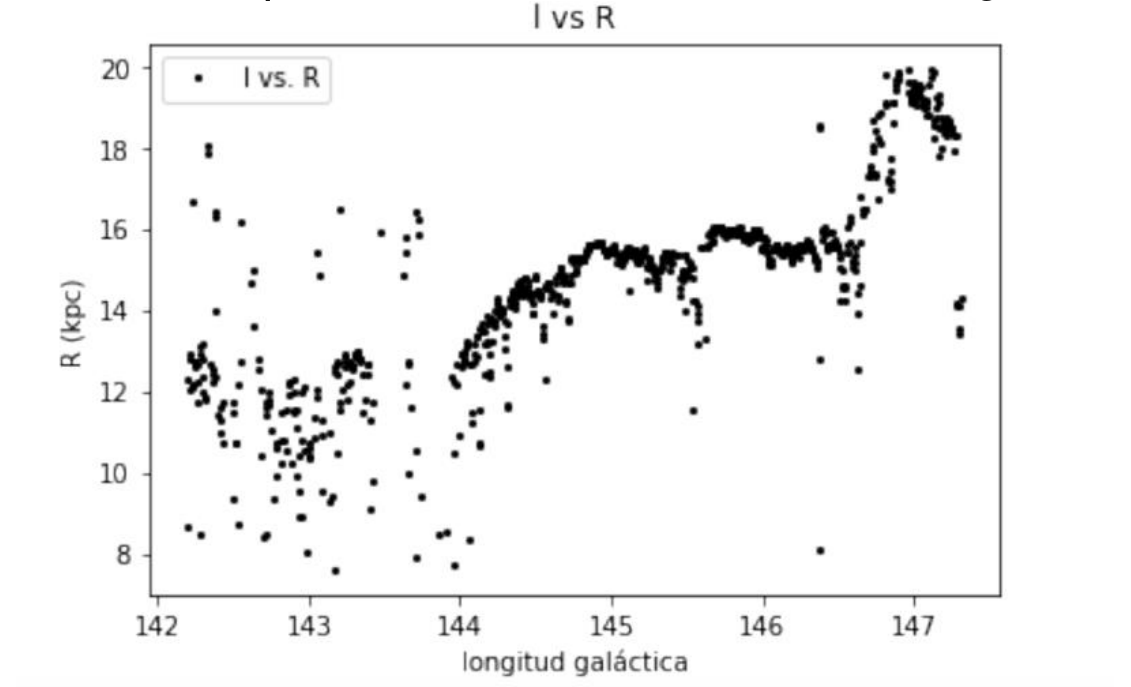
Marking scheme:
- Finding peak for more than 5 longitudes near l = 145º: 8 points.
- Finding R values within 0.2 kpc of data points in Fig. S5 for more than 5 longitudes: 7 points.
- Check that they include a plot similar to Fig. S5 (properly labeled axes) from their data in part 1 of this problem. They should include at least 5 data points to make their conclusions meaningful and get full marks: 5 points. Note: Use Fig. S4 to compare R values.
- Get the final result with standard deviation (14.3 ± 0.3 kpc): 5 points Note: Their value should not differ by more than 1 kpc from this solution.
Standard Table of Constants — Fundamental Constants
| Quantity | Symbol | Value |
|---|---|---|
| Speed of light in vacuum | ||
| Planck constant | ||
| Boltzmann constant | ||
| Stefan-Boltzmann constant | ||
| Elementary charge | ||
| Universal gravitational constant | ||
| Universal gas constant | ||
| Avogadro constant | ||
| Wien's displacement law | ||
| Mass of electron | ||
| Mass of proton | ||
| Mass of neutron | ||
| Atomic mass unit (a.m.u.) |
Astronomical Data
| Quantity | Symbol | Value |
|---|---|---|
| 1 parsec | ||
| 1 astronomical unit | ||
| 1 jansky | ||
| Hubble constant | ||
| Solar luminosity | ||
| Apparent angular diameter of Sun | ||
| Effective temperature of Sun | ||
| Obliquity of the ecliptic (Earth) | ||
| Inclination of the lunar orbit w.r.t. ecliptic | ||
| Apparent visual magnitude of full moon | ||
| North Ecliptic Pole (J2000.0) | ||
| North Galactic Pole (J2000.0) | ||
| 1 sidereal day | ||
| 1 tropical year | ||
| 1 sidereal year |
Solar Magnitudes
| Quantity | Value |
|---|---|
| Apparent visual | |
| Absolute visual | |
| Apparent bolometric | |
| Absolute bolometric |
Solar System
| Object | Mean radius (km) | Mass (kg) | Semi-major axis (au) | Eccentricity |
|---|---|---|---|---|
| Sun | --- | --- | ||
| Mercury | ||||
| Venus | ||||
| Earth | ||||
| Moon | ||||
| Mars | ||||
| Jupiter | ||||
| Saturn | ||||
| Uranus | ||||
| Neptune |
Gauss’s Formulae
Cosine theorem:
Sine theorem:
Equation for the linear least squares fit:
where
and .
and are average values of and .
Оригинал в Архива: Team Competition.pdf · официални решения: Team_Solution.pdf · допълнителни данни: instructions.pdf · допълнителни данни: task.pdf · допълнителни данни: Team-G.pdf