IOAA 2022, Анализ на данни — Задача 2. Galactic Surveys
International Olympiad on Astronomy and Astrophysics 2022 Georgia — Data Analysis · 18 август 2022 г. · 105 т.
Условие
In Cosmology, observations of the spatial distribution of galaxies are crucial to understanding the evolution and expansion of the Universe. Numerous telescopes conduct surveys to produce catalogues of galaxies, which are then subjected to statistical analysis. Usually, galaxies form in groups, which together are part of a cluster, surrounded by a very large, spherical dark-matter halo. Most of the matter is concentrated in the centre, thus there is a high probability of having a large-mass galaxy at the centre of the halo.
In this problem, we will assume that all halos have one central galaxy and several groups of satellite galaxies, and use statistical analysis to draw inferences about the spatial distribution of galaxies.
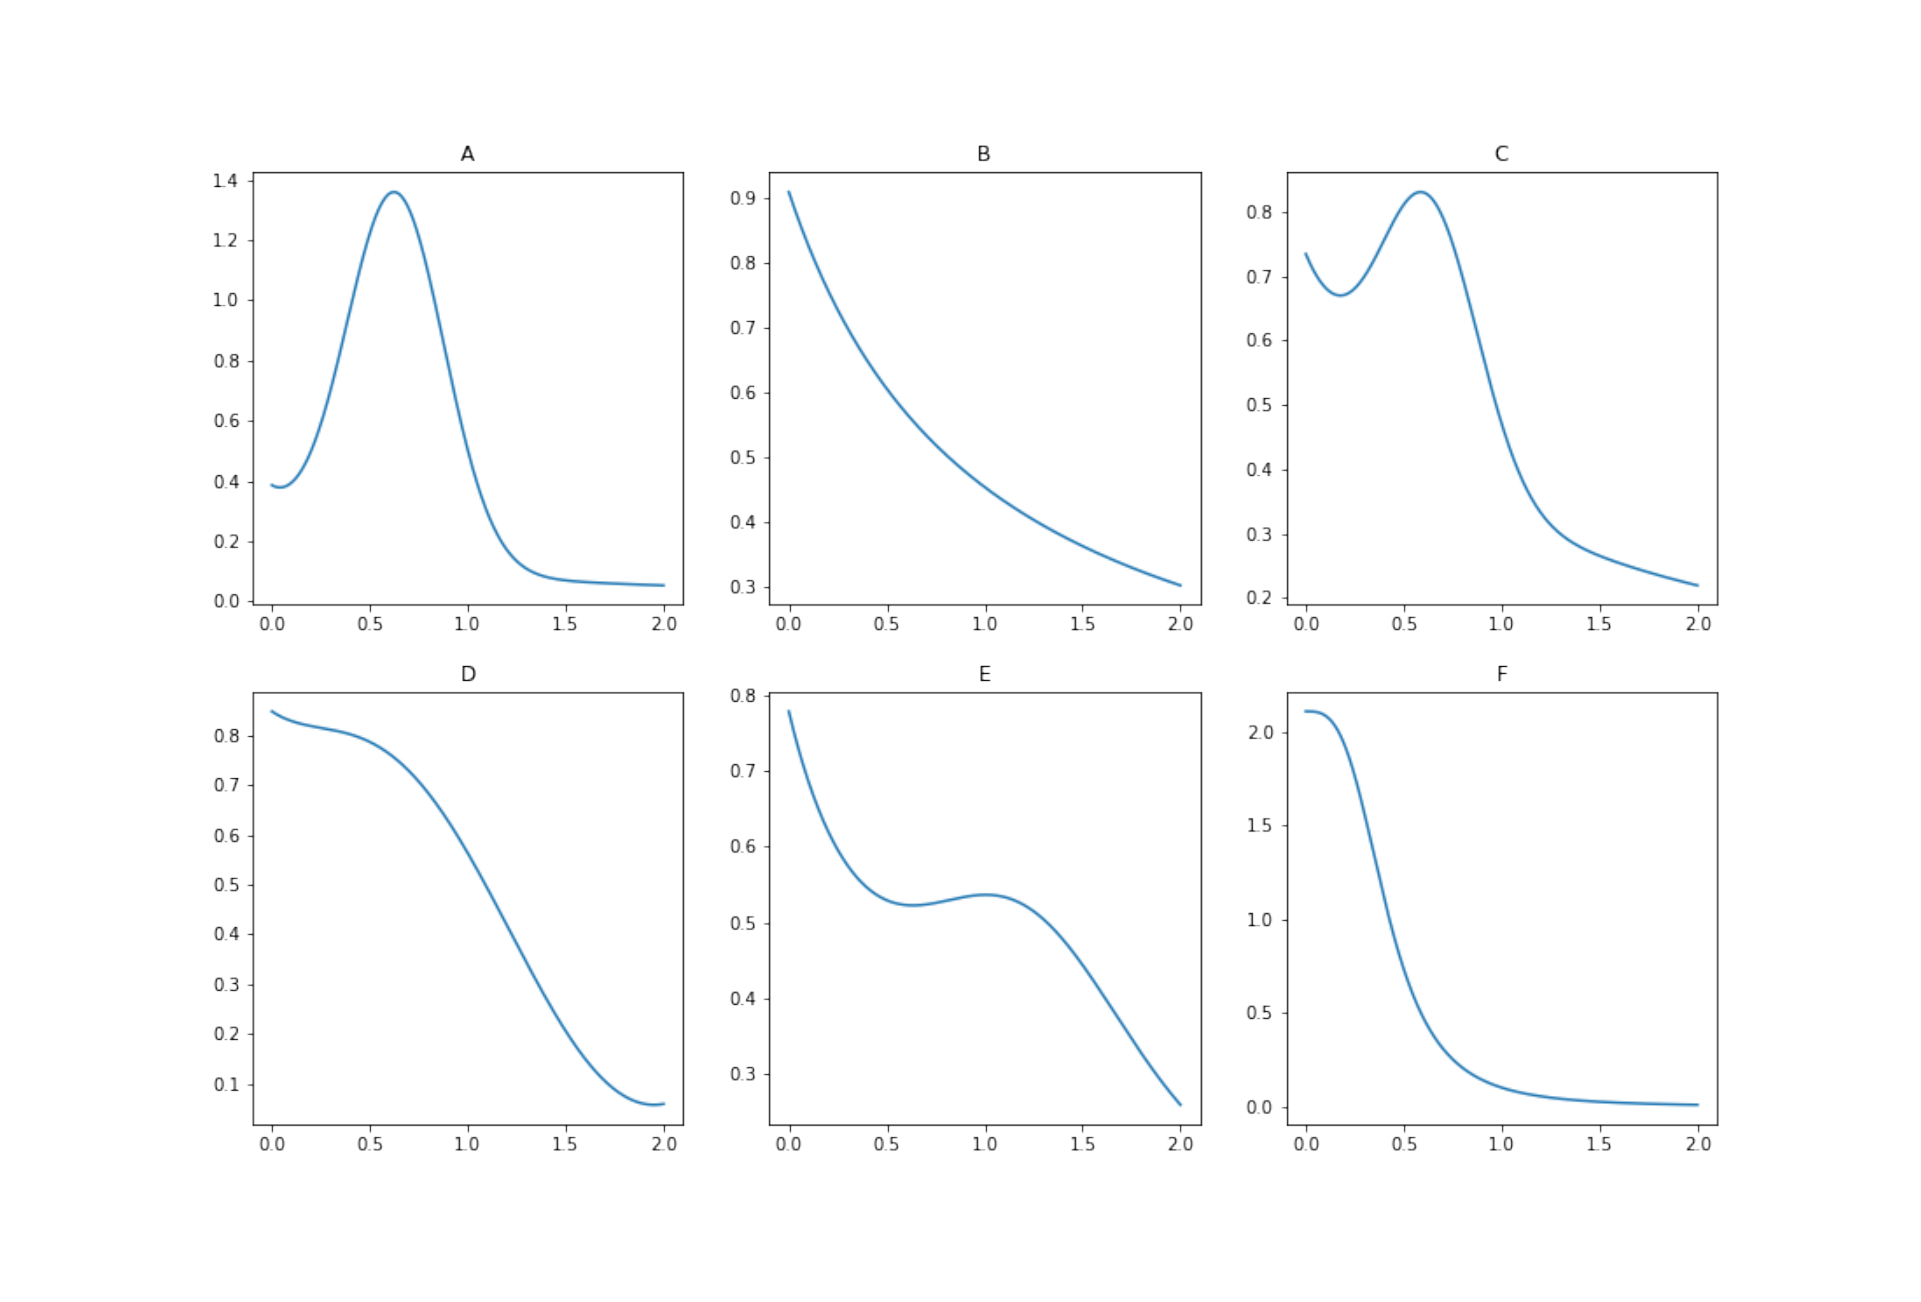
In Figure 1, you can see six different possible probability densities (A-F) for distances between galaxies. On the X axis is the separation distance between galaxies (), and on the Y axis is the probability density (). The probability of the distance between a pair of galaxies being in the range to is given by
Note that may take values greater than 1 in some cases.
| i | (Mpc) | (Mpc) | (Mpc) | |
|---|---|---|---|---|
| C | 8.300 | 6.200 | 1.100 | Central |
| 1 | 8.401 | 6.309 | 1.394 | 291 |
| 2 | 9.883 | 7.189 | 1.506 | 170 |
| 3 | 8.883 | 6.413 | 2.226 | 253 |
| 4 | 8.444 | 6.569 | 2.439 | 8 |
| 5 | 7.782 | 6.048 | -0.358 | 72 |
| 6 | 8.780 | 6.305 | 2.463 | 120 |
| 7 | 7.990 | 5.881 | 0.532 | 302 |
| 8 | 8.540 | 6.388 | 0.369 | 52 |
| 9 | 7.975 | 6.030 | 1.216 | 28 |
| 10 | 7.072 | 5.431 | 0.488 | 40 |
| 11 | 8.037 | 5.965 | 0.615 | 72 |
| 12 | 8.681 | 6.483 | 0.734 | 379 |
| 13 | 7.115 | 5.259 | 1.403 | 82 |
| 14 | 9.587 | 7.130 | 0.322 | 62 |
| 15 | 8.193 | 6.104 | 0.915 | 305 |
| 16 | 7.613 | 5.847 | 1.666 | 293 |
Table 1: Coordinates of galaxy groups
Part 1 (60pt)
Table 1 gives the observational data of a single dark matter halo in the form of Cartesian coordinates of 16 satellite groups and the coordinates of the central galaxy which is given in the first row. group consists of galaxies. The origin of this coordinate system is the Earth. For simplicity, we assume that a group of galaxies means a collection of galaxies with almost the same coordinates.
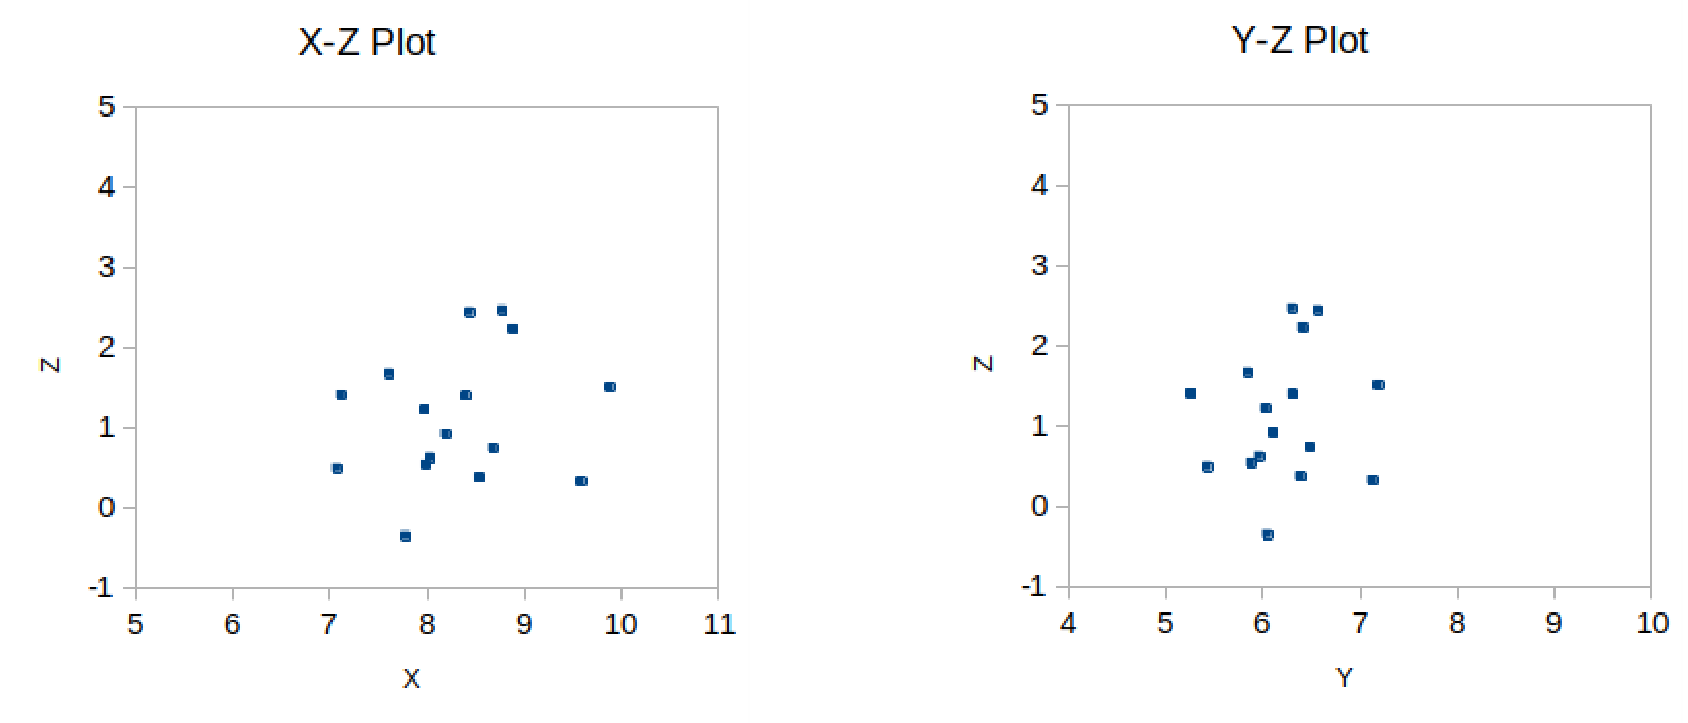
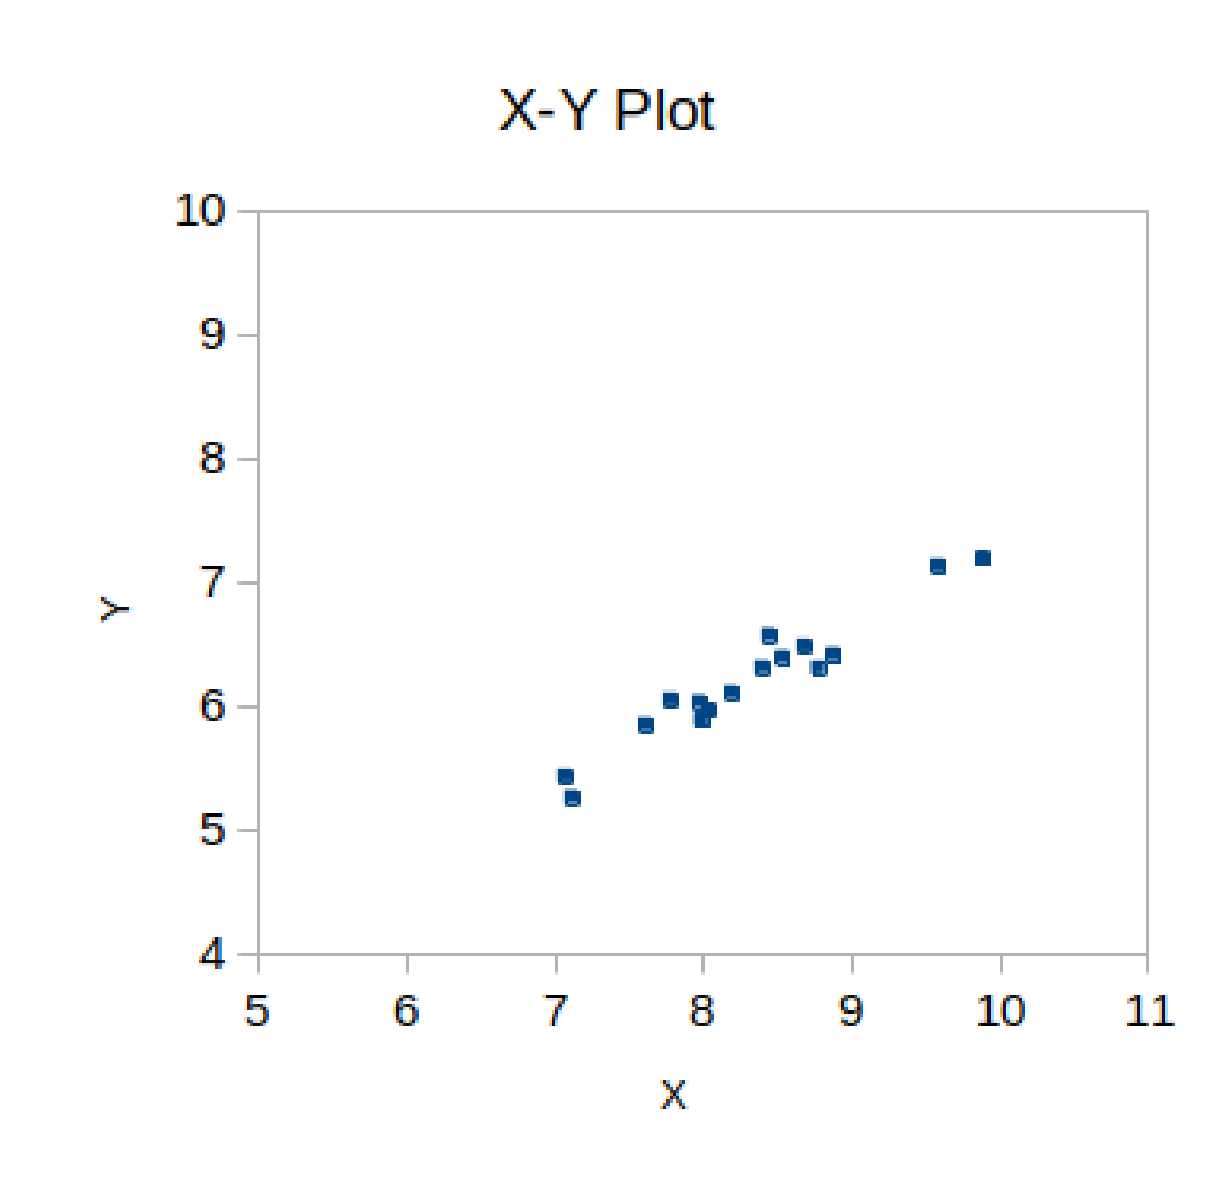
Part 1 (a) The distribution of the satellite groups in plane and plane has been plotted for you. Plot the distribution in the plane on millimeter paper. [6 т.]
Part 1 (b) Given that this cluster of galaxies is shaped like a disk and our line of sight is in the plane of the disk, find the unit vector in the direction of the normal to the disk. [4 т.]
Part 1 (c) Let us define a new coordinate system centred on the central galaxy, defining our line of sight from the Earth to the central galaxy as the axis and the normal to the disk as the axis. Find the unit vectors for this coordinate system. [2 т.]
Part 1 (d) Convert the given Cartesian coordinates to the new coordinates. Calculate: , , . [24 т.]
Part 1 (e) Write the equations necessary to convert the new Cartesian coordinates into spherical coordinates centred on the central galaxy. coordinate has been already calculated for you below. Calculate and . [11 т.]
| i | |
|---|---|
| 1 | 1.652 |
| 2 | 1.490 |
| 3 | 1.432 |
| 4 | 1.721 |
| 5 | 1.692 |
| 6 | 1.430 |
| 7 | 1.474 |
| 8 | 1.580 |
| 9 | 1.723 |
| 10 | 1.646 |
| 11 | 1.519 |
| 12 | 1.569 |
| 13 | 1.542 |
| 14 | 1.557 |
| 15 | 1.516 |
| 16 | 1.705 |
Note: in spherical coordinates, one uses the coordinates , and , where is the radial distance, is the azimuthal angle measured anti-clockwise from axis (from 0 to ) and is the polar angle (from 0 to ), i.e. angle relative to axis.
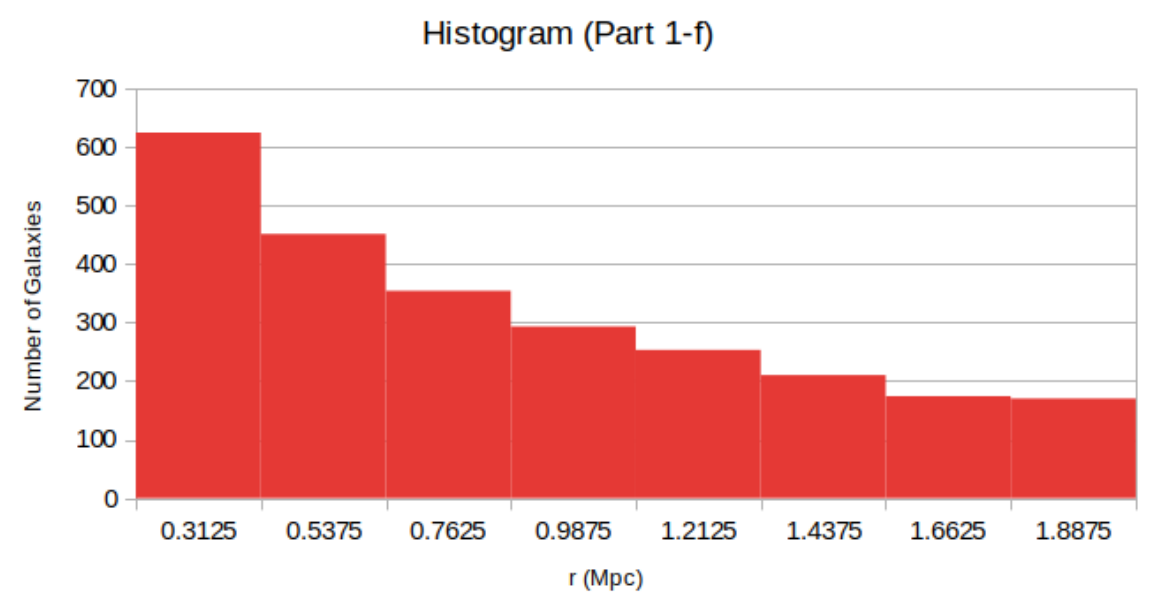
Part 1 (f) Plot a histogram (on millimeter paper) showing the number of satellite galaxies at different radial distances from the central galaxy. Use 8 equally sized bins for radial distances, with to as the total range of the histogram. [9 т.]
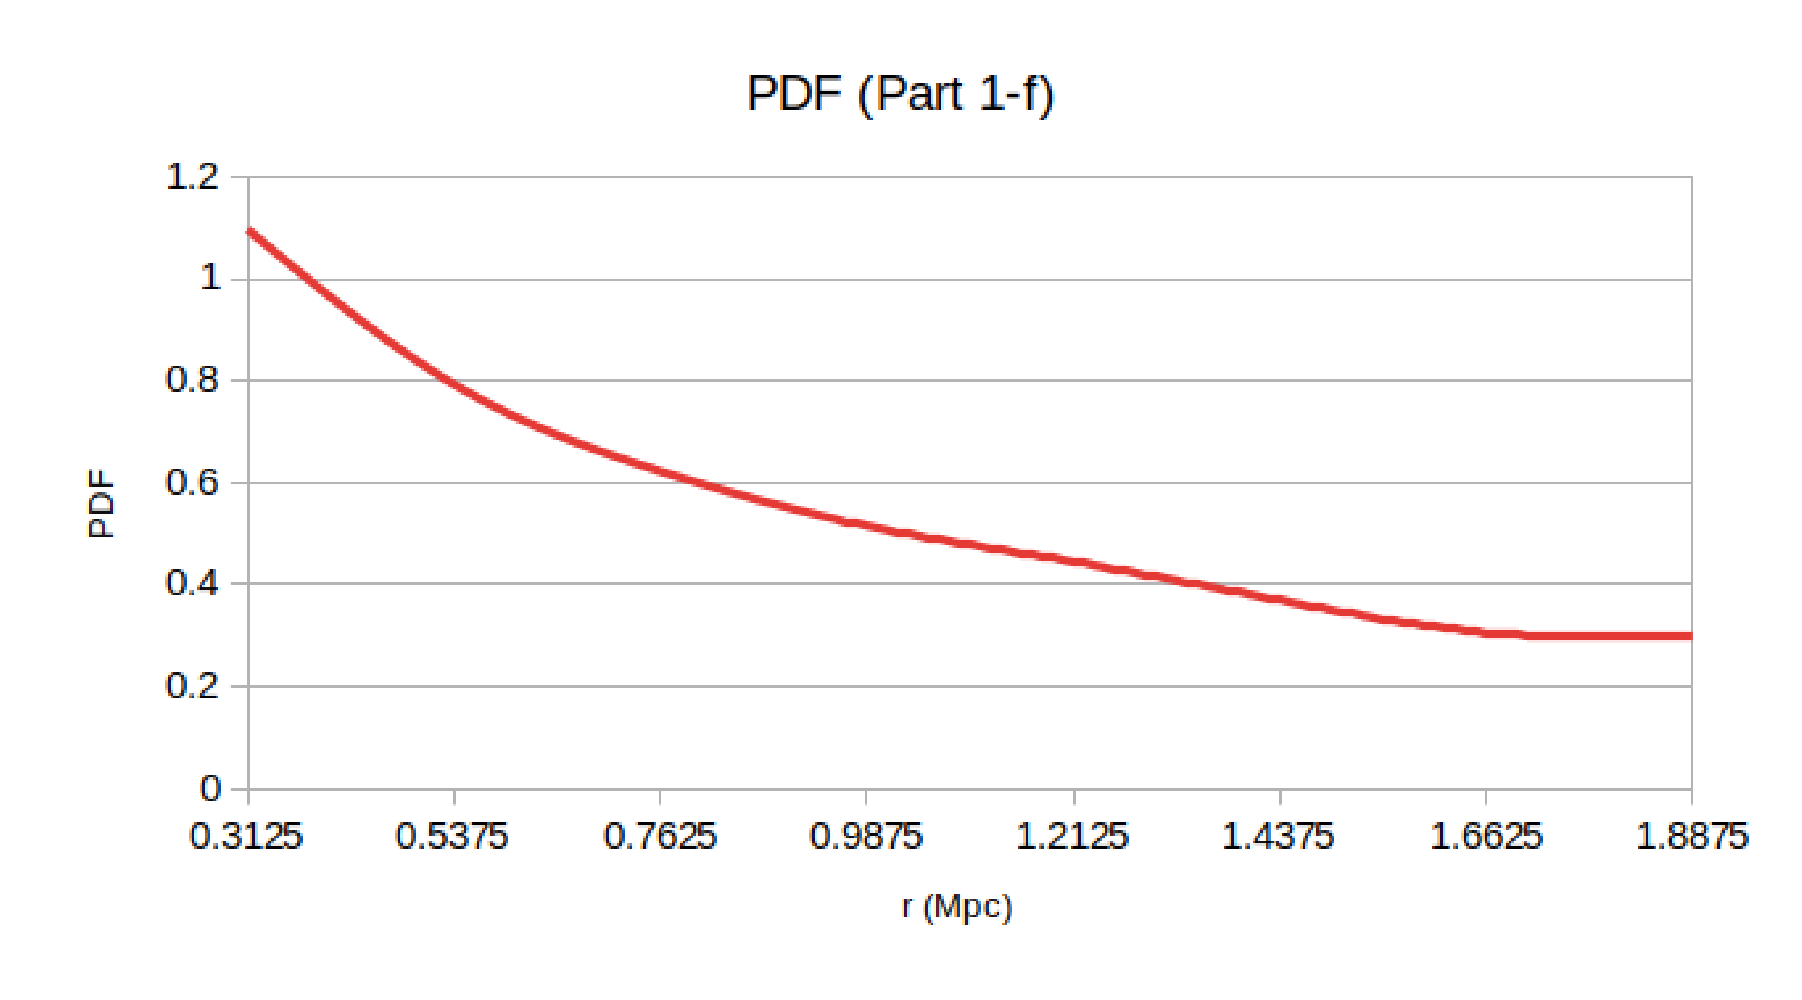
Part 1 (g) The histogram must be also converted into a probability density. On the right hand side of the vertical axis of the histogram you plotted, add markings for the re-scaled vertical axis appropriated for the probability density. You will use this probability density data in Part 3. [4 т.]
Part 2 (17pt)
The coordinates in the Table above are determined using distances obtained by the redshift method. It is well-known that while measuring distance to any galaxy with the redshift method, errors might occur because of the orbital motion of the galaxies. Now, we will try to correct for these errors.
Assume that the central galaxy has an effective mass of , all satellite galaxies move in circular orbits around the central galaxy and interactions between any two satellite galaxies can be ignored.
Part 2 (a) Use the data in Table 1 of the question sheet to obtain a histogram of number of galaxies against the azimuthal angle (take the width of the bins as ). The angle distribution is expected to be uniform, but it is not. Calculate the standard deviation for this data. [5 т.]
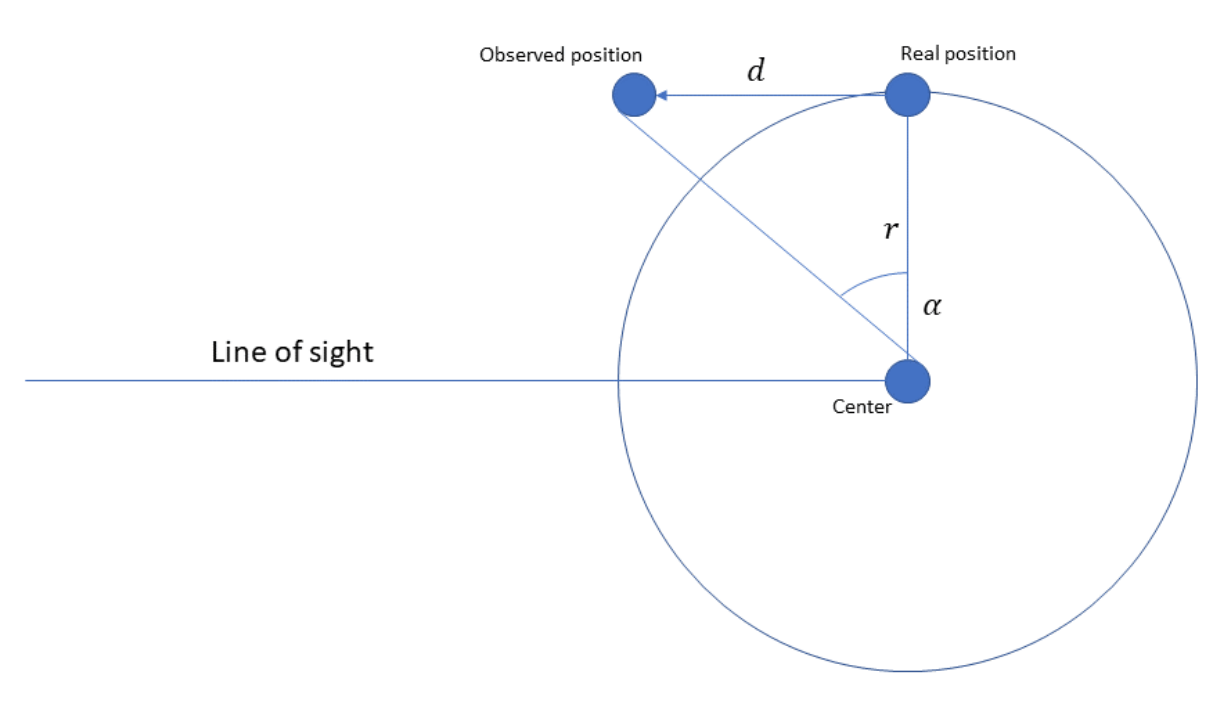
Part 2 (b) The two bins centred along the axis show unusually low number of galaxies as the orbital velocities of satellite galaxies in these bins are almost parallel to our line of sight and hence there is maximum error in their distance estimated by the redshift method. Derive an expression for the correction in each azimuthal angle.
Note: You may assume that the distance from the central galaxy () doesn’t change significantly because of this correction. [4 т.]
Part 2 (c) Calculate corrected value of the azimuthal angles for each data row and recalculate the histogram and standard deviation of its values. [8 т.]
Part 3 (28pt)
So far, we have only calculated the central galaxy – satellite galaxy histogram for a single halo. It is time to move on to calculating other relations.
The same observations and data analysis has been carried out for different halos and their central galaxies. Suppose we have 500 halos, thus, 500 central galaxies (). Take that the average number of satellite galaxies in each halo is 1000 ().
Part 3 a) Calculate the following quantities:
(1) , total number of pairs of central galaxies
(2) , total number of central galaxy - satellite pairs such that the galaxies in the pair belong to the same halo.
(3) , total number of central galaxy - satellite pairs such that the galaxies in the pair belong to two separate halos.
(4) , total number of satellite - satellite galaxy pairs such that the galaxies in the pair belong to the same halo.
(5) , total number of satellite - satellite galaxy pairs such that the galaxies in the pair belong to two separate halos. [5 т.]
The table below gives the probability density values for different distances between central galaxies in different dark matter halos (CC). You should note this data is not real and doesn’t represent the results of the real observations. Dark matter halos do not intersect. But for simplicity we will use this data.
| (Mpc) | |
|---|---|
| 0.3125 | 0.406 |
| 0.5375 | 0.808 |
| 0.7625 | 1.341 |
| 0.9875 | 1.134 |
| 1.2125 | 0.479 |
| 1.4375 | 0.143 |
| 1.6625 | 0.073 |
| 1.8875 | 0.060 |
We can calculate all probability densities using the given Center-Center (CC) data and the same halo Center-Satellite () data that we have calculated in Part 1. We use following relations:
Where , and are normalization constants and should be found for each probability density.
Part 3 b) Calculate normalised , and . [15 т.]
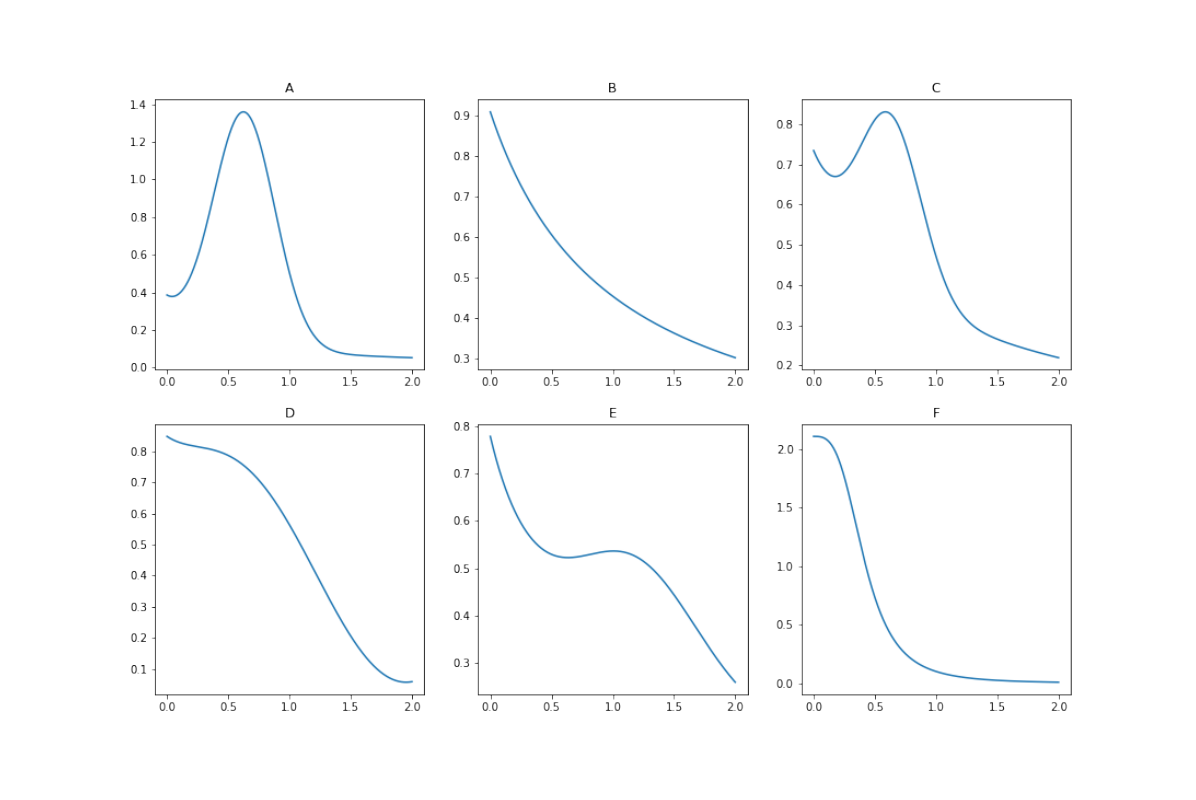
Part 3 c) Calculate the final probability density of all galaxy pairs, that combines all the distributions above with appropriate weights. Which one of 6 graphs on Figure 1 best represents this probability density? [8 т.]
Combined original · Data Analysis - Galactic Surveys · Part 1 (35p)
Additional original source: Data Analysis Problems & Solutions.pdf. The complete differing version below retains its own requests, coordinate convention, marking scheme and figures. The dated question and matching solution version above stays unchanged. No chronology is printed on this combined source.
Source note. The separate Table 1 answer-sheet form cited in (c) and (d) was not among the obtainable original files. The source-specific coordinate signs, pair counts, degree units and differing numerical keys below are retained as printed.
In Cosmology, observations of galaxy groups is very important for the study and verification of complex theory models, Universe expansion, and its behaviour analysis. There are numerous telescopes used only for galactic surveys and making special statistical analysis. The product of all this are the catalogues of galaxies, which are the result of this observations and complex computational analysis.
Usually, galaxies form in groups inside very large dark matter Halos (that have a spherical shape). The most matter is concentrated in the center, thus having a central large-mass galaxy there is with high probability. In these problem, we will assume that all Halos have one central galaxy and several satellite galaxies.
As one can guess, all of these requires a large amount of computational power: To distinguish galaxies, process corrected coordinates with redshifts and other methods, etc. The complex statistical analysis involves calculating correlation functions for galaxy groups, which is making a histogram for distances between all possible two galaxy pairs. The main goal of this problem is to do theoretical statistical analysis of the observational data and figure out what kind of galaxy groups have been observed. Having a theoretical model that can deduce the characteristics of a galaxy groups with few observations is very useful for scientists and saves lots of computational time and possible errors following those kind of data analysis.
In Figure 1, you can see the probability densities of different galaxy groups. On X axis is the distance, and on Y axis is probability density. There are six galaxy cluster types (A-F) with corresponding densities. The goal of this problem will be to determine what kind of Dark matter Halo groups we are observing.
Part 1 (35p)
You are given Table 1. that represents the data from observations. From other data and observations it was concluded that all these galaxies belong to the same dark matter halo. You can see the coordinates of satellite galaxies. The coordinate for the central galaxy is 8.300; 6.200; 1.100. Additional column represents the number of galaxies spotted very near to that points. For simplicity, you can assume that the coordinates are the same for them. These coordinates are given in Cartesian coordinate system center of which coincides to the observer on Earth.
| i | x (MPC) | y (MPC) | z (MPC) | N (Number of galaxies) |
|---|---|---|---|---|
| 1 | 8.401 | 6.309 | 1.394 | 291 |
| 2 | 9.883 | 7.189 | 1.506 | 170 |
| 3 | 8.883 | 6.413 | 2.226 | 253 |
| 4 | 8.444 | 6.569 | 2.439 | 8 |
| 5 | 7.782 | 6.048 | -0.358 | 72 |
| 6 | 8.780 | 6.305 | 2.463 | 120 |
| 7 | 7.990 | 5.881 | 0.532 | 302 |
| 8 | 8.540 | 6.388 | 0.369 | 52 |
| 9 | 7.975 | 6.030 | 1.216 | 28 |
| 10 | 7.072 | 5.431 | 0.488 | 40 |
| 11 | 8.037 | 5.965 | 0.615 | 72 |
| 12 | 8.681 | 6.483 | 0.734 | 379 |
| 13 | 7.115 | 5.259 | 1.403 | 82 |
| 14 | 9.587 | 7.130 | 0.322 | 62 |
| 15 | 8.193 | 6.104 | 0.915 | 305 |
| 16 | 7.613 | 5.847 | 1.666 | 293 |
Before we start converting Cartesian coordinates to spherical we need to find appropriate local coordinate system with origin in the center of the halo.
(a) Plot all the pairs of Cartesian coordinates on the separate graphs. Given the fact that this halo is shaped like a disk find the direction of its normal. [4 т.]
(b) Write down the unit vectors of local coordinate system. Choose appropriate orientation and take axis such that coincides the line of sight. [3 т.]
(c) Convert the given Cartesian coordinates to the local coordinates. Fill in the values of Table 1 (a separate sheet is given in the answer sheets): , , . [8 т.]
(d) Convert the local Cartesian coordinates into spherical (take the central galaxy as the center of the coordinate system, is calculated relative to axis and - relative to axis). Fill in the other values of Table 1 (a separate sheet is given in the answer sheets): , , . [8 т.]
(e) Plot the histogram (parameter dependence on total number of data points that fall in a given limits) with 8 bins of Satellite galaxy distances from the central Galaxy. Take 0.2-2 MPC as the histogram range. The histogram has to be also converted into probability density function. Note: The probability density function is the probability at a given point. You can avoid plotting two separate graphs by just noting other limits of Y axis in case of probability function. [6 т.]
(f) Theoretically the histogram is given by the following equation
Linearize the given dependence and find values and from the graph. [6 т.]
Combined original · Part 2 (20p)
It is well-known that while measuring distance to an object with redshift method (large relative velocity due to the expansion of the universe) errors might occur because of the motion of the galaxies. The aim of this chapter is to correct these errors.
Assume that the central galaxy has a mass of , all satellite galaxies move in circular orbits and interactions between them is negligible.
(a) Use the data filled with you in Table 1 to plot the histogram of polar angle (take the width of histogram bins as 60 degrees). The angle distribution should be uniform, but it is not. Calculate the square deviation from the uniform value. [6 т.]
(b) The galaxies originally in 60-120 and 240-300 bins would need most correction since they are the ones which move along the line of sight. Assume that the angular coordinates coincide with the center of the corresponding bin (90 and 270 in our case) and write the expression as a function of distance from the center which describes change of polar angles caused by circular motion of the galaxies. Hint: You can assume that the distance from the centre doesn’t change significantly because of this correction. [6 т.]
(c) Using the result of previous task correct the angles used in the last histogram. Plot the new histogram (probability dependence on distance) with the corrected data. Calculate the square deviation from the uniform value. [8 т.]
Combined original · Part 3 (20p)
We have only calculated the central galaxy - satellite (from the same galaxy) histogram. It is time to move on to calculating other relations.
The same observations and data analysis has been carried out for different Halos and their central galaxies. The data for Figure 2. histogram only includes the distribution probability density function of the distances between central galaxies in different dark matter Halos. Suppose we have 500 Halos, thus 500 central galaxies (). Take that the average number of satellite in one Halo is 1000 ().
(a) Calculate the following quantities:
- , total number of central galaxy pairs
- , total number of central galaxy - satellite pairs in the same Halo
- , total number of central galaxy - satellite pairs in different Halos
- , total number of satellite - satellite galaxy pairs in the same Halo
- , total number of satellite - satellite galaxy pairs in different Halos [3 т.]
Below is given the table for probability density values for different distances between central galaxies in different dark matter Halos.
| r (MPC) | |
|---|---|
| 0.3125 | 0.406 |
| 0.5375 | 0.808 |
| 0.7625 | 1.341 |
| 0.9875 | 1.134 |
| 1.2125 | 0.479 |
| 1.4375 | 0.143 |
| 1.6625 | 0.073 |
| 1.8875 | 0.060 |
We can calculate all probability densities using the given Center-Center data and Center-Satellite data which you calculated in part 1. The relations are following:
Where , and are normalization constant and should be found for each density.
(b) Calculate and plot , , and . [10 т.]
(c) Plot the final probability density of all galaxy pairs. Which one of 6 graphs on Figure 1 is most similar to you plot? [7 т.]
Отговори
Part 1 (b)
Part 2 (a) 264
Official: σ1 ≈ 264.
Part 2 (b)
Part 2 (c) 13
Official: σ1 ≈ 13 after correction.
Part 3 c) E
Решение
Part 1
Part (a)
Indicated axis, written few numbers on the axis and written proper units 0.5pt. Indicated axis, written few numbers on the axis and written proper units 0.5pt. Used percent of the graphing paper 2pt, for percent 1.5pt, for percent 1pt, for percent 0.5pt. If drawn points 3pt, If then 2pt, for 6-10 1pt and for 0pt
Part (b)
The normal to the disk also lies in plane. The line of sight (which we can take as axis) is also perpendicular to the normal. Thus, it can be calculated by normalizing . So
(here the coefficient of is unimportant). axis lays in XY plane and is perpendicular to . So
[Alternative way: Calculate the equation of line of galaxies using linear regression 2pt, construct perpendicular line 1pt, normalise 1pt]
Part (c)
Part (d)
Each coordinate in system can be found by following equations
8/3 points for each formula, here, is coordinate of a satellite galaxy and is coordinate of the central galaxy.
These values are calculated in the following table (1.0 for each row):
| 1 | 0.101 | 0.109 | 0.294 | 0.1766 | 0.2769 | -0.02688 |
| 2 | 1.583 | 0.989 | 0.406 | 1.893 | 0.2073 | 0.1550 |
| 3 | 0.583 | 0.213 | 1.126 | 0.7101 | 1.057 | 0.1783 |
| 4 | 0.144 | 0.369 | 1.339 | 0.4757 | 1.296 | -0.2094 |
| 5 | -0.518 | -0.152 | -1.458 | -0.6571 | -1.396 | -0.1882 |
| 6 | 0.480 | 0.105 | 1.363 | 0.5888 | 1.308 | 0.2031 |
| 7 | -0.310 | -0.319 | -0.568 | -0.4968 | 0.5184 | 0.07005 |
| 8 | 0.240 | 0.188 | -0.731 | 0.2259 | 0.7591 | -0.006988 |
| 9 | -0.325 | -0.170 | 0.116 | -0.3478 | 0.1536 | -0.05830 |
| 10 | -1.228 | -0.769 | -0.612 | -1.500 | -0.4561 | -0.1188 |
| 11 | -0.263 | -0.235 | -0.485 | -0.4006 | -0.4452 | 0.03088 |
| 12 | 0.381 | 0.283 | -0.366 | 0.4333 | -0.4141 | 0.001284 |
| 13 | -1.185 | -0.941 | 0.303 | -1.4721 | 0.4610 | 0.04472 |
| 14 | 1.287 | 0.930 | -0.778 | 1.4966 | -0.9413 | 0.02514 |
| 15 | -0.107 | -0.096 | -0.185 | -0.162 | -0.169 | 0.0129 |
| 16 | -0.687 | -0.353 | 0.566 | -0.6976 | 0.6433 | -0.1283 |
Part (e)
Spherical coordinates can by calculated by following relations:
Calculated values are given in the following table (0.5 for each row):
| (deg) | ||||
|---|---|---|---|---|
| 1 | 0.3294 | 1.004 | 57.51° | 1.652 |
| 2 | 1.910 | 0.1091 | 6.25° | 1.490 |
| 3 | 1.286 | 0.9792 | 56.10° | 1.432 |
| 4 | 1.396 | 1.219 | 69.84° | 1.721 |
| 5 | 1.555 | 4.273 | 244.80° | 1.692 |
| 6 | 1.449 | 1.148 | 65.77° | 1.430 |
| 7 | 0.7214 | 3.948 | 226.22° | 1.474 |
| 8 | 0.7920 | 5.002 | 286.57° | 1.580 |
| 9 | 0.3847 | 2.726 | 156.18° | 1.723 |
| 10 | 1.573 | 3.437 | 196.91° | 1.646 |
| 11 | 0.5997 | 3.980 | 228.02° | 1.519 |
| 12 | 0.5993 | 5.520 | 316.30° | 1.569 |
| 13 | 1.543 | 2.838 | 162.61° | 1.542 |
| 14 | 1.768 | 5.722 | 327.83° | 1.557 |
| 15 | 0.2343 | 3.948 | 226.20° | 1.516 |
| 16 | 0.9576 | 2.397 | 137.32° | 1.705 |
Part (f)
To divide the range in 8 equal bins, we must take . 1.0
By calculating bin ranges and counting the number of satellite galaxies in each bin, we get: (0.5 for each row)
| Bin Center | Bin range | ||
|---|---|---|---|
| 1 | 0.3125 Mpc | 0.200 Mpc–0.425 Mpc | 624 |
| 2 | 0.5375 Mpc | 0.425 Mpc–0.650 Mpc | 451 |
| 3 | 0.7625 Mpc | 0.650 Mpc–0.875 Mpc | 354 |
| 4 | 0.9875 Mpc | 0.875 Mpc–1.10 Mpc | 293 |
| 5 | 1.2125 Mpc | 1.10 Mpc–1.325 Mpc | 253 |
| 6 | 1.4375 Mpc | 1.325 Mpc–1.55 Mpc | 210 |
| 7 | 1.6625 Mpc | 1.55 Mpc–1.775 Mpc | 174 |
| 8 | 1.8875 Mpc | 1.775 Mpc–2.00 Mpc | 170 |
For plotted histogram 0.5 for each data point.
Part (g)
The sum of the area under the histogram is,
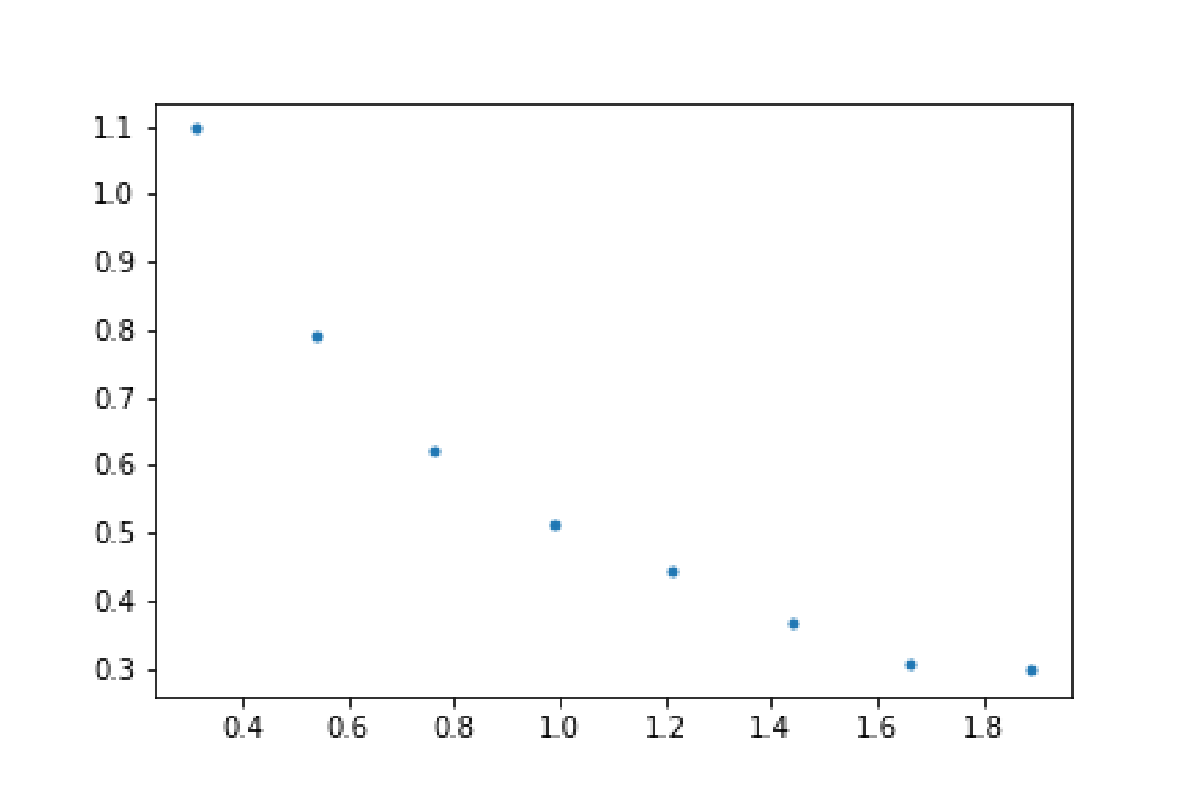
After dividing each by we get (0.25 for each row):
| Bin Center | Probability Density | ||
|---|---|---|---|
| 1 | 0.3125 Mpc | 624 | 1.097 |
| 2 | 0.5375 Mpc | 451 | 0.793 |
| 3 | 0.7625 Mpc | 354 | 0.622 |
| 4 | 0.9875 Mpc | 293 | 0.515 |
| 5 | 1.2125 Mpc | 253 | 0.445 |
| 6 | 1.4375 Mpc | 210 | 0.369 |
| 7 | 1.6625 Mpc | 174 | 0.306 |
| 8 | 1.8875 Mpc | 170 | 0.299 |
Plotting this data gives us (no separate points)
Part 2
Part (a)
Making bins for (0.5 for each row),
| Center of the bin | Number of galaxies | |
|---|---|---|
| 1 | 30 | 714 |
| 2 | 90 | 128 |
| 3 | 150 | 403 |
| 4 | 210 | 719 |
| 5 | 270 | 124 |
| 6 | 330 | 441 |
The expected value for each bin, in case of uniform distribution is . Thus, the standard deviation will be
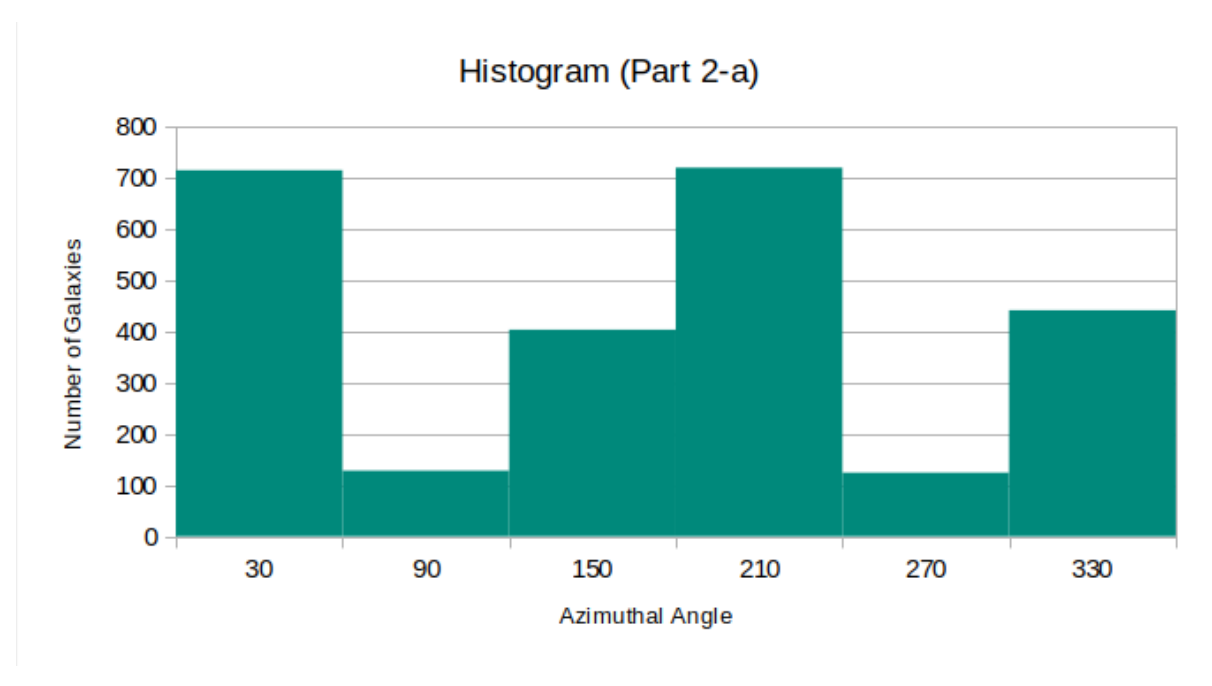
The histogram looks like (no separate points)
Part (b)
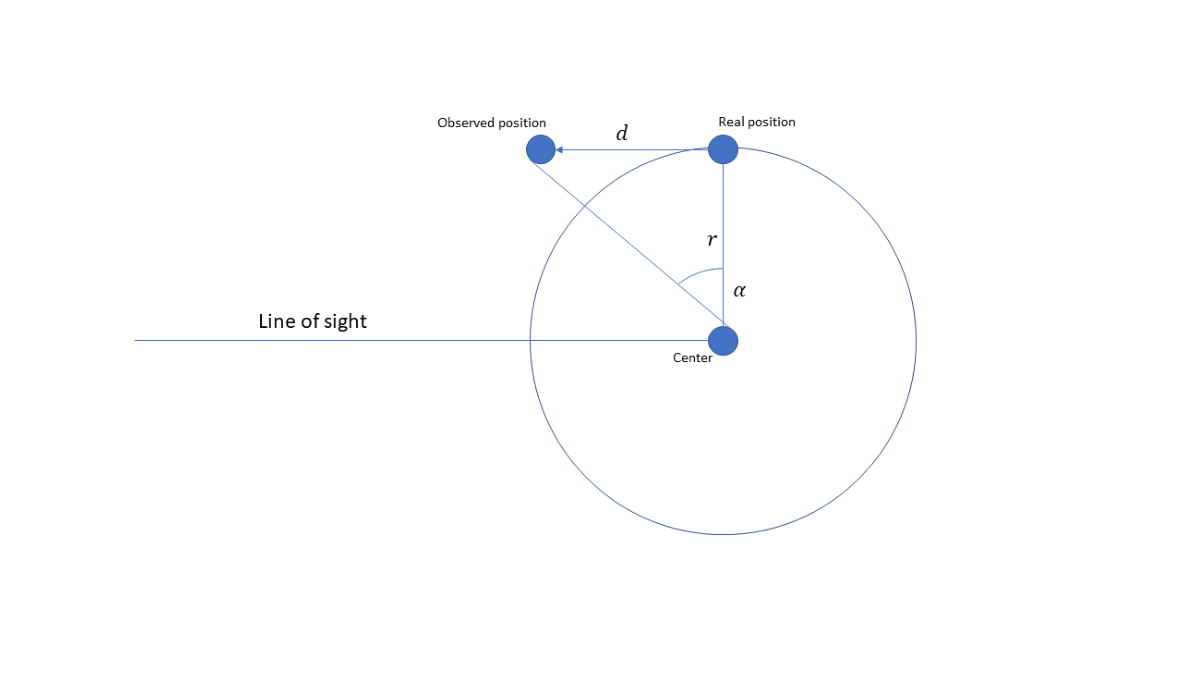
A galaxy with the orbital radius around central mass is shown in the drawing
[Alternative Solution:
]
Part (c)
We calculate for each value of and add it to the respective (choice of addition / subtraction is dependent on sign convention. Students should realise that some of the galaxies should get added to bins 2 and 5).
The table looks like this (0.25 for each row)
| Number of galaxies | ||||
|---|---|---|---|---|
| 1 | 57.51° | 27.36° | 83.87° | 291 |
| 2 | 6.25° | 2.03° | 8.28° | 170 |
| 3 | 56.10° | 3.68° | 59.78° | 253 |
| 4 | 69.84° | 3.25° | 73.09° | 8 |
| 5 | 244.80° | 2.77° | 247.57° | 72 |
| 6 | 65.77° | 3.08° | 68.84° | 120 |
| 7 | 226.22° | 8.69° | 234.92° | 302 |
| 8 | 286.57° | 7.57° | 294.14° | 52 |
| 9 | 156.18° | 21.44° | 177.62° | 28 |
| 10 | 196.91° | 2.72° | 199.63° | 40 |
| 11 | 228.02° | 11.41° | 239.43° | 72 |
| 12 | 316.30° | 11.42° | 327.72° | 379 |
| 13 | 162.61° | 2.80° | 165.41° | 82 |
| 14 | 327.83° | 2.28° | 330.11° | 62 |
| 15 | 226.20° | 39.56° | 265.77° | 305 |
| 16 | 137.32° | 5.71° | 143.03° | 293 |
New corrected distribution looks like this (0.5 for each correct n):
| Center of the bin | Number of galaxies | |
|---|---|---|
| 1 | 30 | 423 |
| 2 | 90 | 419 |
| 3 | 150 | 403 |
| 4 | 210 | 414 |
| 5 | 270 | 429 |
| 6 | 330 | 441 |
Thus, the standard deviation will be
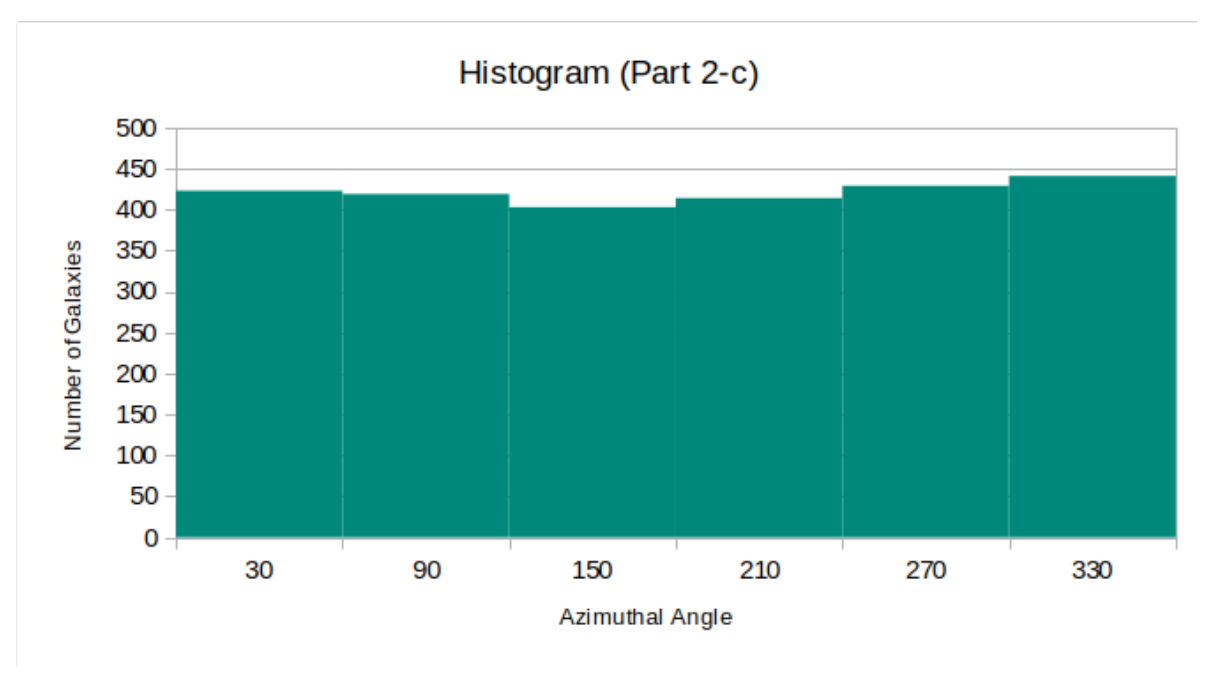
The histogram looks like (no separate points)
Part 3
Part (a)
With simple combinatorics one can get:
Part (b)
We can calculate all probability densities using center-center and center-satellite densities. Non-normalized values (with ) (1 pt) are calculated in the following table (0.5 for each correct value):
| 1 | 0.3125 | 1.097 | 0.406 | 0.376 | 0.446 | 7.931 |
| 2 | 0.5375 | 0.793 | 0.808 | 0.338 | 0.454 | 5.934 |
| 3 | 0.7625 | 0.622 | 1.341 | 0.295 | 0.452 | 3.951 |
| 4 | 0.9875 | 0.515 | 1.134 | 0.262 | 0.382 | 3.913 |
| 5 | 1.2125 | 0.445 | 0.479 | 0.240 | 0.292 | 4.899 |
| 6 | 1.4375 | 0.369 | 0.143 | 0.196 | 0.209 | 4.619 |
| 7 | 1.6625 | 0.306 | 0.073 | 0.155 | 0.161 | 3.774 |
| 8 | 1.8875 | 0.299 | 0.060 | 0.168 | 0.173 | 4.111 |
For normalization, we get . (2 pt for each)
Multiplying relevant densities by this values gives (0.5 for each correct value):
| 1 | 0.3125 | 0.823 | 0.771 | 0.901 |
| 2 | 0.5375 | 0.739 | 0.785 | 0.674 |
| 3 | 0.7625 | 0.646 | 0.781 | 0.449 |
| 4 | 0.9875 | 0.573 | 0.662 | 0.444 |
| 5 | 1.2125 | 0.525 | 0.504 | 0.556 |
| 6 | 1.4375 | 0.429 | 0.362 | 0.525 |
| 7 | 1.6625 | 0.340 | 0.279 | 0.429 |
| 8 | 1.8875 | 0.369 | 0.300 | 0.467 |
Part (c)
Total probability density is weighted sum of all densities:
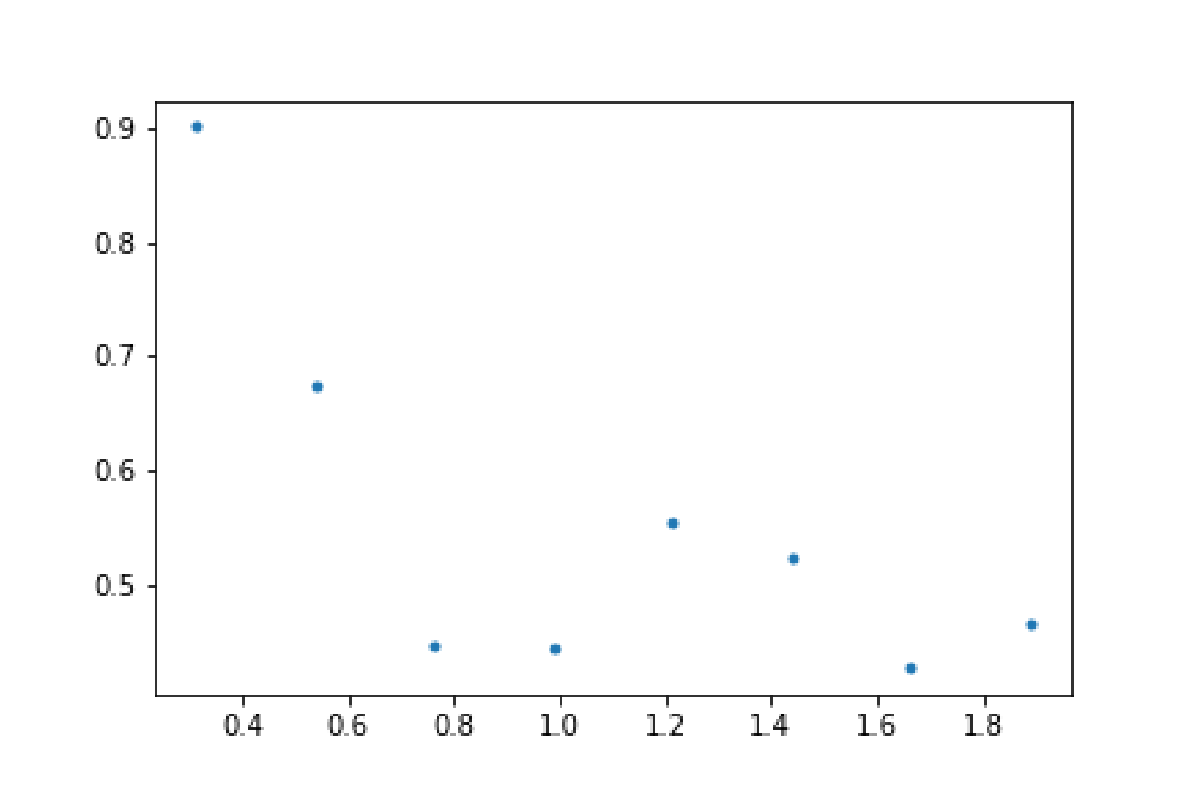
Final PDF is given in the following table (0.5 for each value):
| 1 | 0.3125 | 0.900 |
| 2 | 0.5375 | 0.674 |
| 3 | 0.7625 | 0.450 |
| 4 | 0.9875 | 0.445 |
| 5 | 1.2125 | 0.556 |
| 6 | 1.4375 | 0.524 |
| 7 | 1.6625 | 0.428 |
| 8 | 1.8875 | 0.466 |
Note: The constant of normalisation in this case turns out to be 1.00. Hence no need to separately normalise this PDF. 1.0
Most similar to this density is plot E on Figure 1 of question paper. 1.0
Combined original · Solutions - Part 1
Part (a) If we plot given coordinates in XY, XZ and YZ planes we’ll see the following pictures. See Figures 2, 3 and 4 (0.5p for each graph). By observing Figure 2 we can deduce that the group is edge-on and its normal lies in plane. axis is along line of sight so it can be calculated by normalizing . So
(0.5p) axis lays in plane and is perpendicular to so it can be calculated by normalizing
(2p)
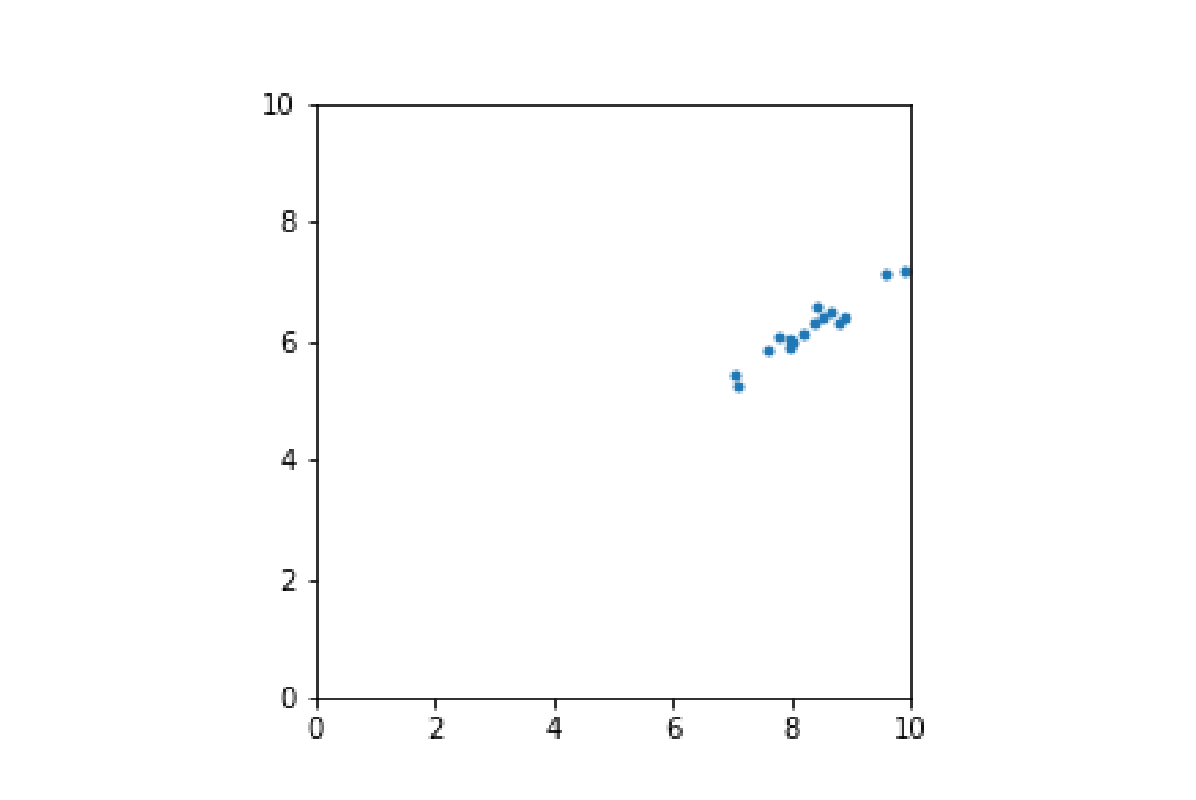
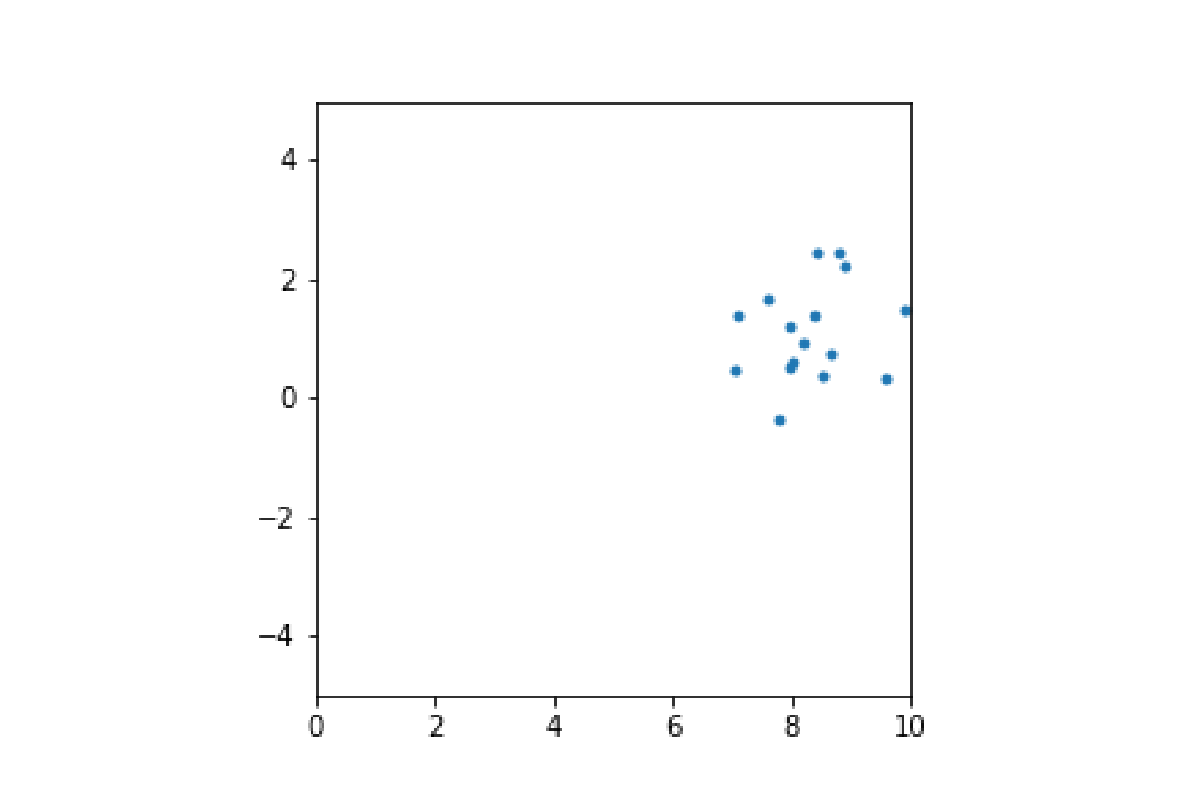
Part (b) One can choose as line of sight (found in part(a)) (1p):
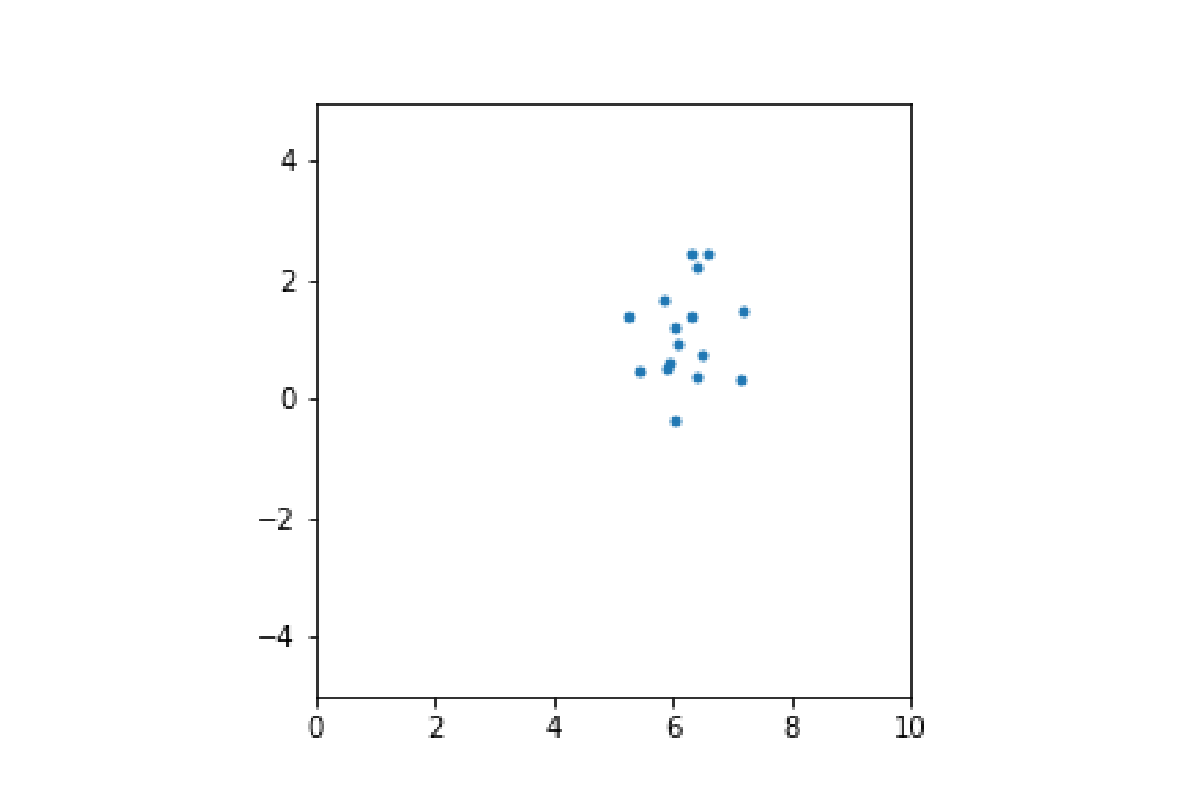
can be chosen as halo disk normal (found in part(a))(1p):
And finally for (1p):
Part (c) Each coordinate in system can be found by following equations
Where , and are unit vectors of local system, is coordinate of a galaxy and is coordinate of the center.
This values are calculated in the following table (0.5p for each correct , , tuple):
| i | ||||||
|---|---|---|---|---|---|---|
| 1 | 0.101124 | 0.109271 | 0.294476 | 0.176684 | -0.277372 | -0.027025 |
| 2 | 1.582909 | 0.989392 | 0.405895 | 1.892722 | -0.207212 | 0.154641 |
| 3 | 0.582735 | 0.213285 | 1.126426 | 0.710112 | -1.057359 | 0.177866 |
| 4 | 0.144328 | 0.369381 | 1.338567 | 0.476137 | -1.295537 | -0.209558 |
| 5 | -0.517770 | -0.151687 | -1.458202 | -0.656729 | 1.396668 | -0.188336 |
| 6 | 0.480059 | 0.105110 | 1.362674 | 0.588881 | -1.307808 | 0.203084 |
| 7 | -0.309855 | -0.319116 | -0.568033 | -0.496739 | 0.518483 | 0.070227 |
| 8 | 0.239541 | 0.188218 | -0.730736 | 0.225694 | 0.758807 | -0.007438 |
| 9 | -0.324800 | -0.169551 | 0.116378 | -0.347375 | -0.153915 | -0.058541 |
| 10 | -1.227659 | -0.768684 | -0.612379 | -1.500158 | 0.456538 | -0.118862 |
| 11 | -0.263209 | -0.234869 | -0.485227 | -0.400698 | 0.445410 | 0.030649 |
| 12 | 0.381200 | 0.282515 | -0.365581 | 0.433222 | 0.413634 | 0.001792 |
| 13 | -1.185021 | -0.941303 | 0.302593 | -1.472310 | -0.460620 | 0.044950 |
| 14 | 1.286640 | 0.930147 | -0.777889 | 1.496445 | 0.941150 | 0.024802 |
| 15 | -0.106760 | -0.095804 | -0.184997 | -0.161600 | 0.168879 | 0.012863 |
| 16 | -0.686865 | -0.352750 | 0.566244 | -0.697350 | -0.643470 | -0.128449 |
Part (d) Spherical coordinates can by calculated by following relations:
and signs of x’ and y’
Calculated values are given in the following table (0.5p for each correct , , tuple):
| i | ||||||
|---|---|---|---|---|---|---|
| 1 | 0.176684 | -0.277372 | -0.027025 | 0.329974 | 5.279566 | 1.652789 |
| 2 | 1.892722 | -0.207212 | 0.154641 | 1.910301 | 6.174141 | 1.489757 |
| 3 | 0.710112 | -1.057359 | 0.177866 | 1.286042 | 5.303793 | 1.432047 |
| 4 | 0.476137 | -1.295537 | -0.209558 | 1.396079 | 5.064586 | 1.721471 |
| 5 | -0.656729 | 1.396668 | -0.188336 | 1.554814 | 2.010330 | 1.692226 |
| 6 | 0.588881 | -1.307808 | 0.203084 | 1.448581 | 5.135477 | 1.430138 |
| 7 | -0.496739 | 0.518483 | 0.070227 | 0.721461 | 2.334780 | 1.473302 |
| 8 | 0.225694 | 0.758807 | -0.007438 | 0.791695 | 1.281697 | 1.580191 |
| 9 | -0.347375 | -0.153915 | -0.058541 | 0.384430 | 3.558678 | 1.723672 |
| 10 | -1.500158 | 0.456538 | -0.118862 | 1.572587 | 2.846171 | 1.646452 |
| 11 | -0.400698 | 0.445410 | 0.030649 | 0.599906 | 2.303400 | 1.519685 |
| 12 | 0.433222 | 0.413634 | 0.001792 | 0.598981 | 0.762273 | 1.567805 |
| 13 | -1.472310 | -0.460620 | 0.044950 | 1.543336 | 3.444801 | 1.541667 |
| 14 | 1.496445 | 0.941150 | 0.024802 | 1.767973 | 0.561416 | 1.556768 |
| 15 | -0.161600 | 0.168879 | 0.012863 | 0.234094 | 2.334171 | 1.515821 |
| 16 | -0.697350 | -0.643470 | -0.128449 | 0.957522 | 3.886829 | 1.705349 |
Part (e) Using radii calculated above and number of galaxies for each data (rewritten below) one can calculate number of galaxies in each bin. Range of bin 1 is (0.2, 0.425), bin 2 - (0.425, 0.65) and so on bin 8 - (1.775, 2.0).
| i | r | n |
|---|---|---|
| 1 | 0.329974 | 291 |
| 2 | 1.910301 | 170 |
| 3 | 1.286042 | 253 |
| 4 | 1.396079 | 8 |
| 5 | 1.554814 | 72 |
| 6 | 1.448581 | 120 |
| 7 | 0.721461 | 302 |
| 8 | 0.791695 | 52 |
| 9 | 0.384430 | 28 |
| 10 | 1.572587 | 40 |
| 11 | 0.599906 | 72 |
| 12 | 0.598981 | 379 |
| 13 | 1.543336 | 82 |
| 14 | 1.767973 | 62 |
| 15 | 0.234094 | 305 |
| 16 | 0.957522 | 293 |
Correct values for each bin are: (0.5p for each correct n)
| i | Center of the bin | Number of the galaxies |
|---|---|---|
| 1 | 0.312500 | 624 |
| 2 | 0.537500 | 451 |
| 3 | 0.762500 | 354 |
| 4 | 0.987500 | 293 |
| 5 | 1.212500 | 253 |
| 6 | 1.437500 | 210 |
| 7 | 1.662500 | 174 |
| 8 | 1.887500 | 170 |
Corresponding histogram is given on Figure 5. (1p)
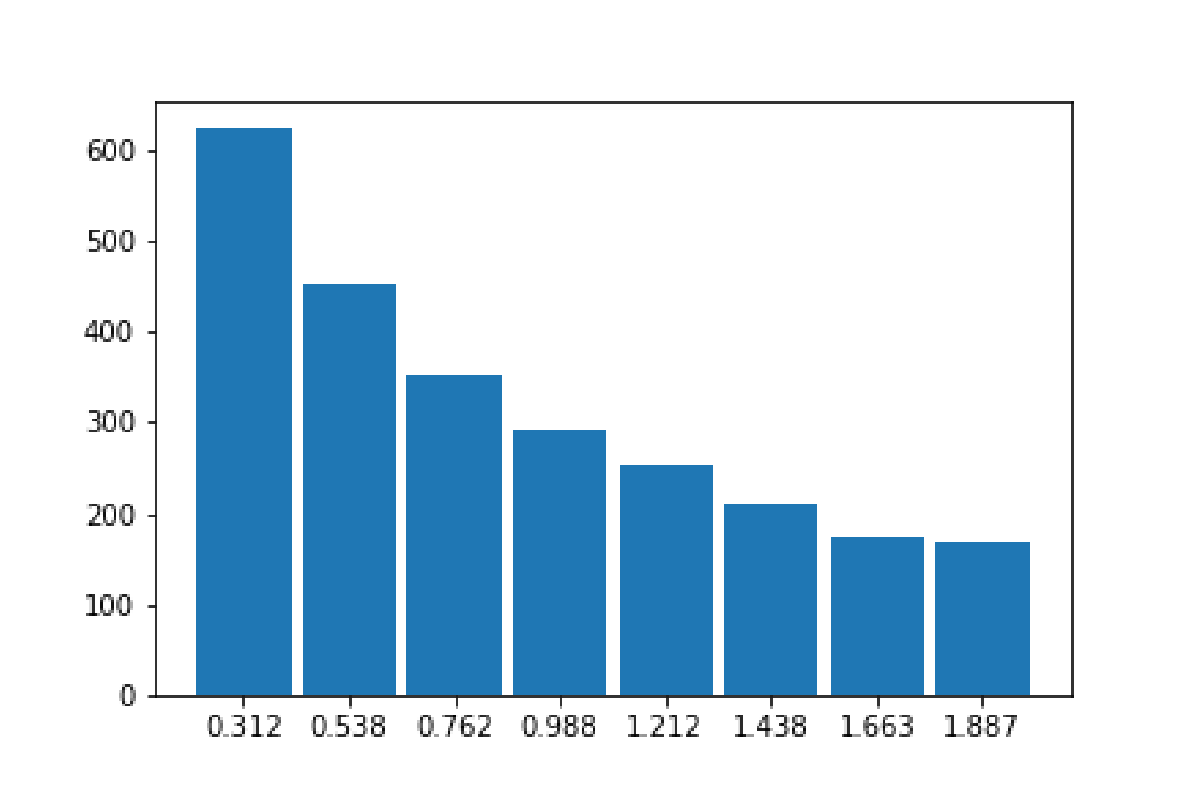
Histogram data as a table:
In order to get probability density function each value of histogram must be divided by it integral on the whole region. The integral can be approximated by finding total area of the rectangles:
Where is size of a bin. After dividing each data by we get (0.25p for each correct probability density):
| i | Center of the bin | Number of the galaxies | Probability density |
|---|---|---|---|
| 1 | 0.312500 | 624 | 1.096613 |
| 2 | 0.537500 | 451 | 0.792584 |
| 3 | 0.762500 | 354 | 0.622117 |
| 4 | 0.987500 | 293 | 0.514916 |
| 5 | 1.212500 | 253 | 0.444620 |
| 6 | 1.437500 | 210 | 0.369052 |
| 7 | 1.662500 | 174 | 0.305786 |
| 8 | 1.887500 | 170 | 0.298757 |
Plotting this data gives the graph on Figure 6 (1p)
Part (f) Since histogram equation has following form:
We should calculate which gives the following values (0.125 for each correct ):
| i | r | H(r) | 1/H(r) |
|---|---|---|---|
| 1 | 0.312500 | 624 | 0.001603 |
| 2 | 0.537500 | 451 | 0.002217 |
| 3 | 0.762500 | 354 | 0.002825 |
| 4 | 0.987500 | 293 | 0.003413 |
| 5 | 1.212500 | 253 | 0.003953 |
| 6 | 1.437500 | 210 | 0.004762 |
| 7 | 1.662500 | 174 | 0.005747 |
| 8 | 1.887500 | 170 | 0.005882 |
Plotting this data gives Figure 7
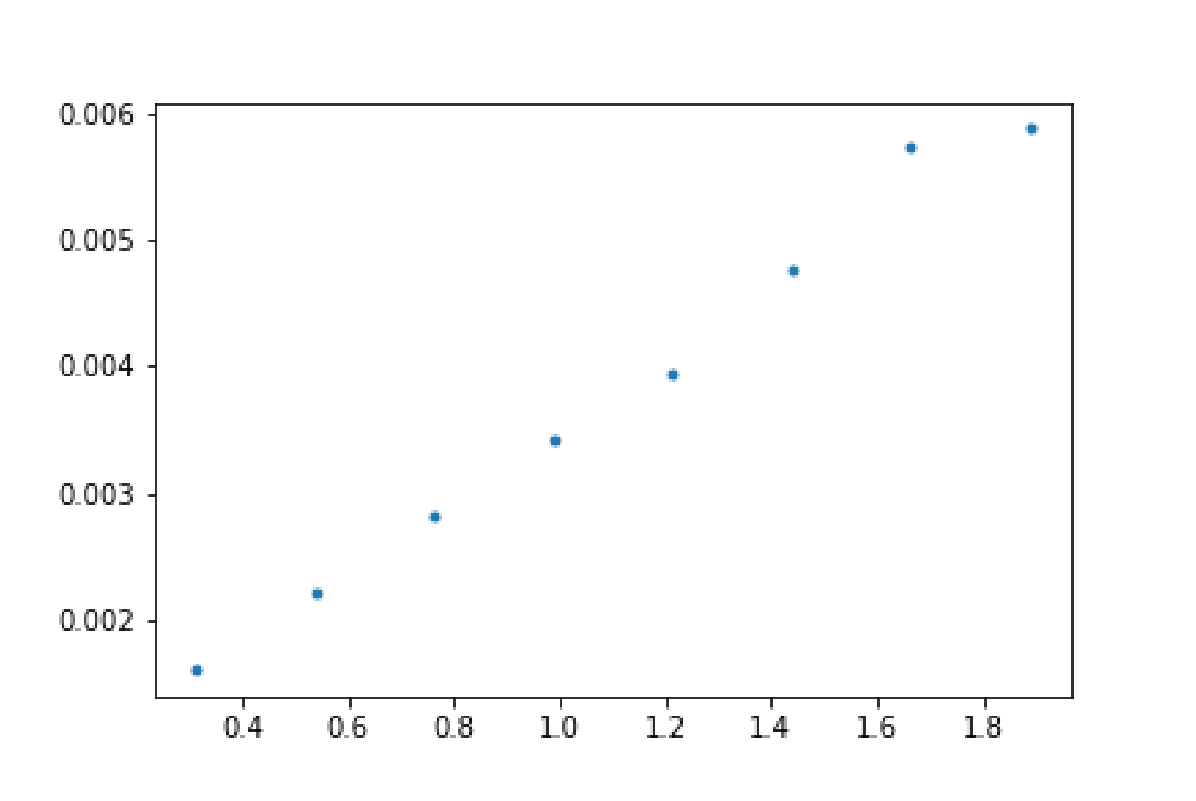
Finding the slope and the intercept of this line (by graph or any other method) gives Following values:
2.5p for B in range 0.002-0.003 2.5p for A in range 0.0006-0.0008
Combined original · Solutions - Part 2
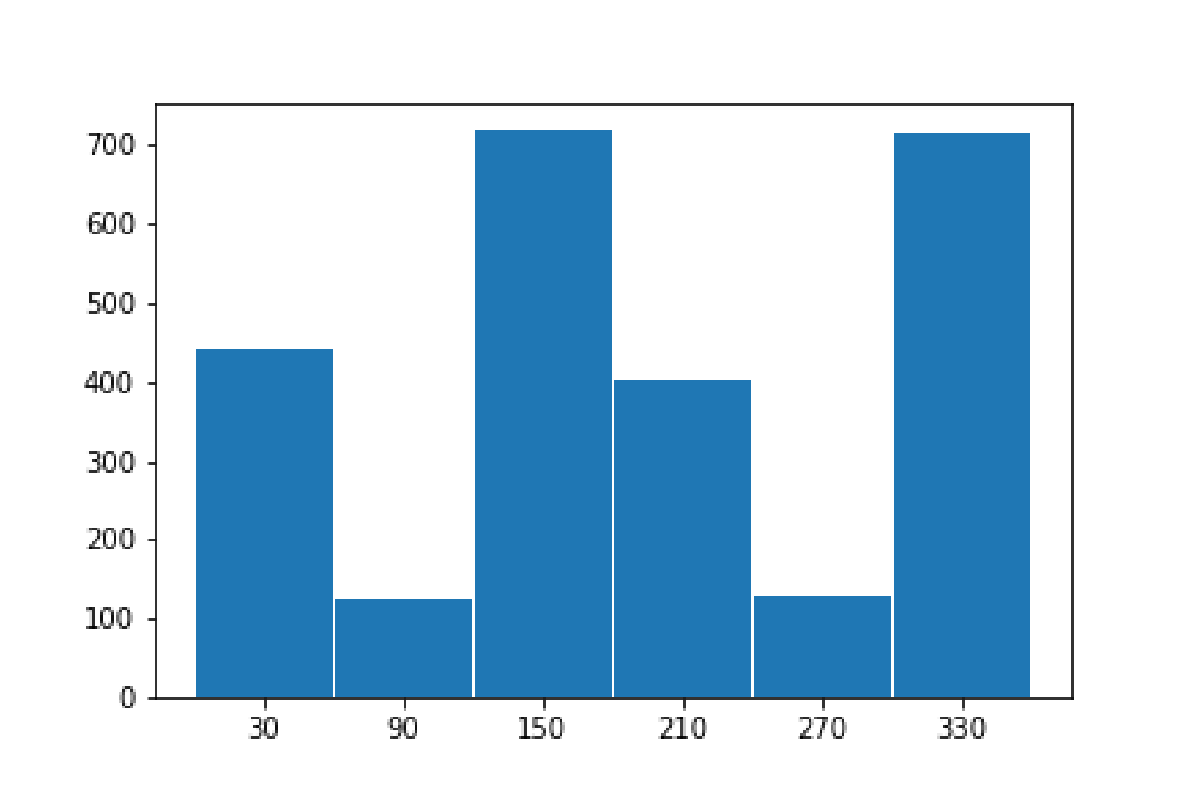
Part (a) We can values from Part 1.c to distribute them in 60 degree bins. In bin 1 we have number of galaxies which fall in (0, 60) degree range, in bin 2 - (60, 120) and so on bin 6 - (300, 360).
Part 1.c data in degrees:
| i | Angle | Number of galaxies |
|---|---|---|
| 1 | 302.496846 | 291 |
| 2 | 353.752245 | 170 |
| 3 | 303.884926 | 253 |
| 4 | 290.179429 | 8 |
| 5 | 115.183442 | 72 |
| 6 | 294.241133 | 120 |
| 7 | 133.773013 | 302 |
| 8 | 73.435830 | 52 |
| 9 | 203.897219 | 28 |
| 10 | 163.073590 | 40 |
| 11 | 131.975076 | 72 |
| 12 | 43.675004 | 379 |
| 13 | 197.372555 | 82 |
| 14 | 32.166754 | 62 |
| 15 | 133.738158 | 305 |
| 16 | 222.698869 | 293 |
We get the following data for the histogram (0.5p for each correct n):
| i | Center of the bin | Number of galaxies |
|---|---|---|
| 1 | 30 | 441 |
| 2 | 90 | 124 |
| 3 | 150 | 719 |
| 4 | 210 | 403 |
| 5 | 270 | 128 |
| 6 | 330 | 714 |
Uniform value is total number of galaxies divides by 6 which is 421.5. Square deviation is (1p)
Graph is given on Figure 8 (2p)
Part (b) A galaxy with the orbital radius around central mass has velocity (2p):
This will cause to give the following error in distance along line of sight (2p):
Angle difference for galaxies at 90 and 270 degrees will be (2p):
For detailed drawing see Figure 9
Part (c) Galaxies originally in bins of range (60, 120) and (240, 300) might move to (120, 180) and (300, 360) respectively. So we should subtract correction value found in previous task to the galaxies in bins 2 and 5 to see if they move to bins 1 and 4 respectively. (0.25p for each correct corrected angle(
| i | Original angle | Corrected angle | Number of galaxies |
|---|---|---|---|
| 1 | 302.494665 | 276.136451 | 291 |
| 2 | 353.752069 | 351.714594 | 170 |
| 3 | 303.884728 | 300.199512 | 253 |
| 4 | 290.178642 | 290.178642 | 8 |
| 5 | 115.184577 | 115.184577 | 72 |
| 6 | 294.241835 | 294.241835 | 120 |
| 7 | 133.776280 | 125.061576 | 302 |
| 8 | 73.437747 | 73.437747 | 52 |
| 9 | 203.899065 | 203.899065 | 28 |
| 10 | 163.073490 | 160.346665 | 40 |
| 11 | 131.977481 | 120.548626 | 72 |
| 12 | 43.676971 | 43.676971 | 379 |
| 13 | 197.372956 | 197.372956 | 82 |
| 14 | 32.167948 | 32.167948 | 62 |
| 15 | 133.743596 | 94.077612 | 305 |
| 16 | 222.694636 | 222.694636 | 293 |
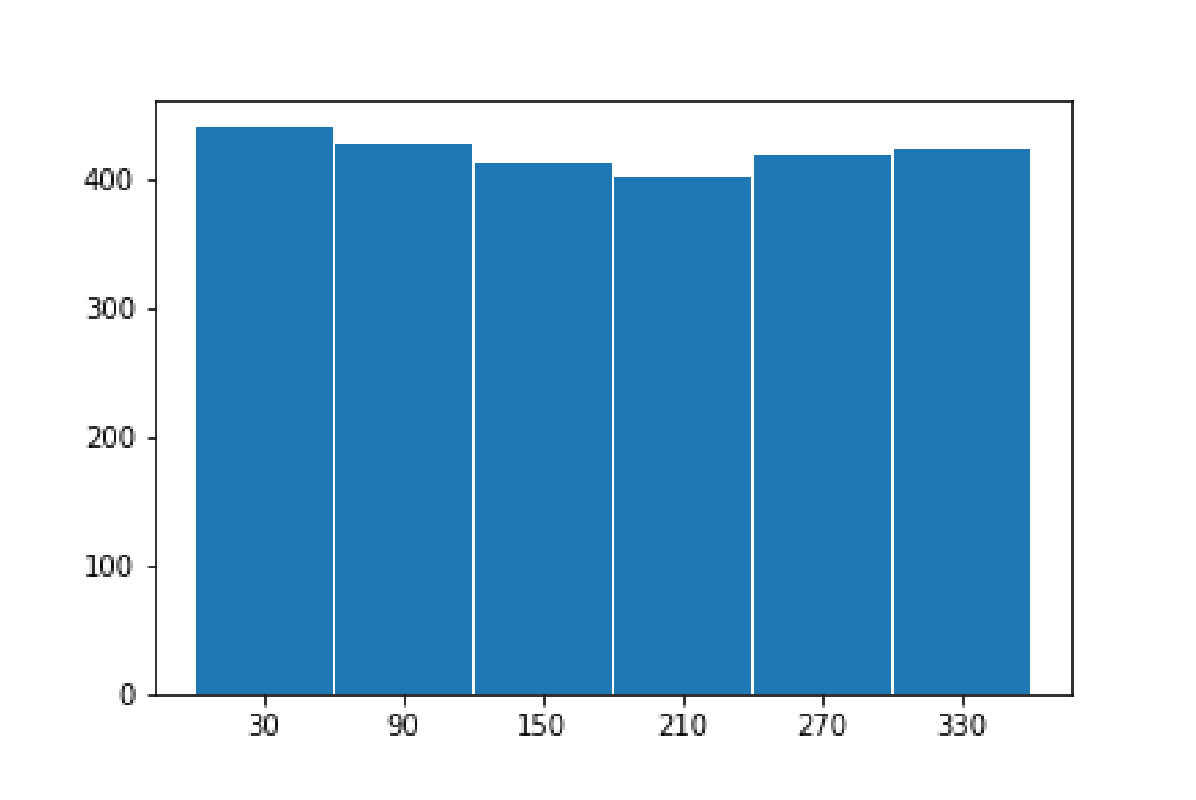
New corrected distribution looks like this (0.3p for each correct n):
| i | Center of the bin | Number of galaxies |
|---|---|---|
| 1 | 30 | 441 |
| 2 | 90 | 429 |
| 3 | 150 | 414 |
| 4 | 210 | 403 |
| 5 | 270 | 419 |
| 6 | 330 | 423 |
In this case square deviation equals to
(1p) And relevant graph is given on Figure 10 (1.2p)
Combined original · Solutions - Part 3
Part (a) With simple combinatorics one can get (0.6p for each correct N):
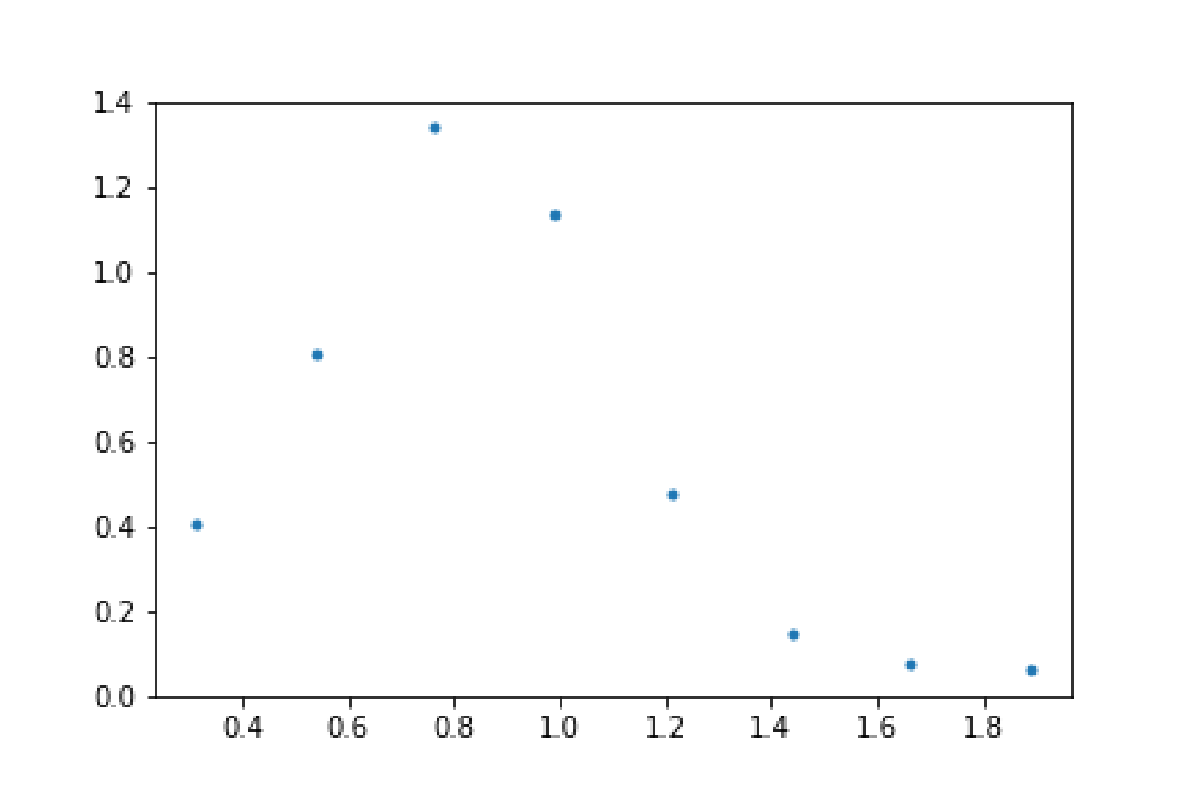
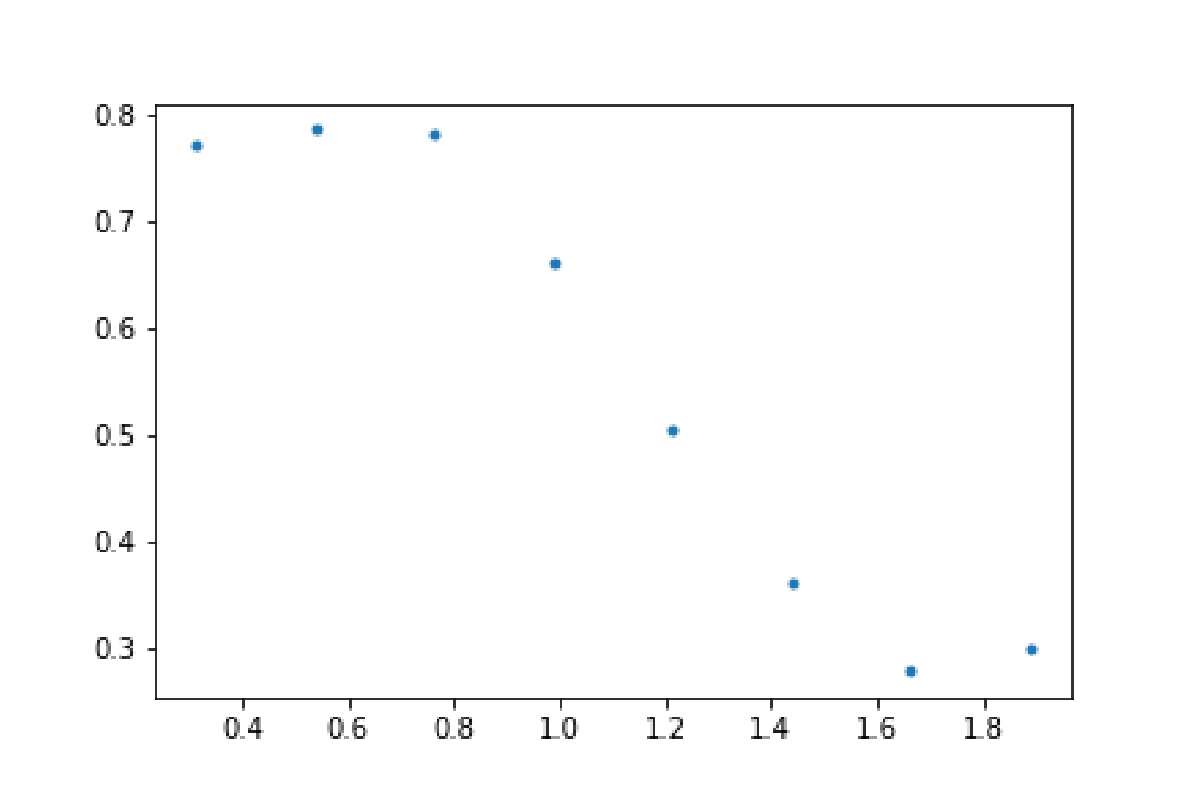
Part (b) We can calculate all probability densities using center-center and center-satellite densities. Non-normalized values (with ) are calculated in the following table (0.5p for each correct tuple):
| i | r | |||||
|---|---|---|---|---|---|---|
| 1 | 0.312500 | 1.096613 | 0.406141 | 0.375800 | 17.365137 | 0.975747 |
| 2 | 0.537500 | 0.792584 | 0.807863 | 0.337652 | 12.992898 | 0.994072 |
| 3 | 0.762500 | 0.622117 | 1.340510 | 0.295110 | 8.653487 | 0.988565 |
| 4 | 0.987500 | 0.514916 | 1.134011 | 0.261824 | 8.568351 | 0.837480 |
| 5 | 1.212500 | 0.444620 | 0.478630 | 0.239696 | 10.729180 | 0.638199 |
| 6 | 1.437500 | 0.369052 | 0.143154 | 0.195787 | 10.112507 | 0.458355 |
| 7 | 1.662500 | 0.305786 | 0.073165 | 0.155452 | 8.262279 | 0.352612 |
| 8 | 1.887500 | 0.298757 | 0.060971 | 0.168470 | 8.998531 | 0.379962 |
For normalization (same way as in Part 1.d) we get ; ; . Multiplying relevant densities by this values gives (0.5p for each correct normalized tuple):
| i | r | |||
|---|---|---|---|---|
| 1 | 0.312500 | 0.822854 | 0.900750 | 0.770962 |
| 2 | 0.537500 | 0.739325 | 0.673957 | 0.785441 |
| 3 | 0.762500 | 0.646175 | 0.448866 | 0.781089 |
| 4 | 0.987500 | 0.573292 | 0.444450 | 0.661713 |
| 5 | 1.212500 | 0.524839 | 0.556535 | 0.504257 |
| 6 | 1.437500 | 0.428697 | 0.524548 | 0.362158 |
| 7 | 1.662500 | 0.340380 | 0.428574 | 0.278607 |
| 8 | 1.887500 | 0.368883 | 0.466764 | 0.300217 |
Plots are given on Figures 11 - 14 (0.5p for each plot).
Part (c) Total probability density is weighted sum of all densities (4p):
Calculated values and normalized densities are given in the following table:
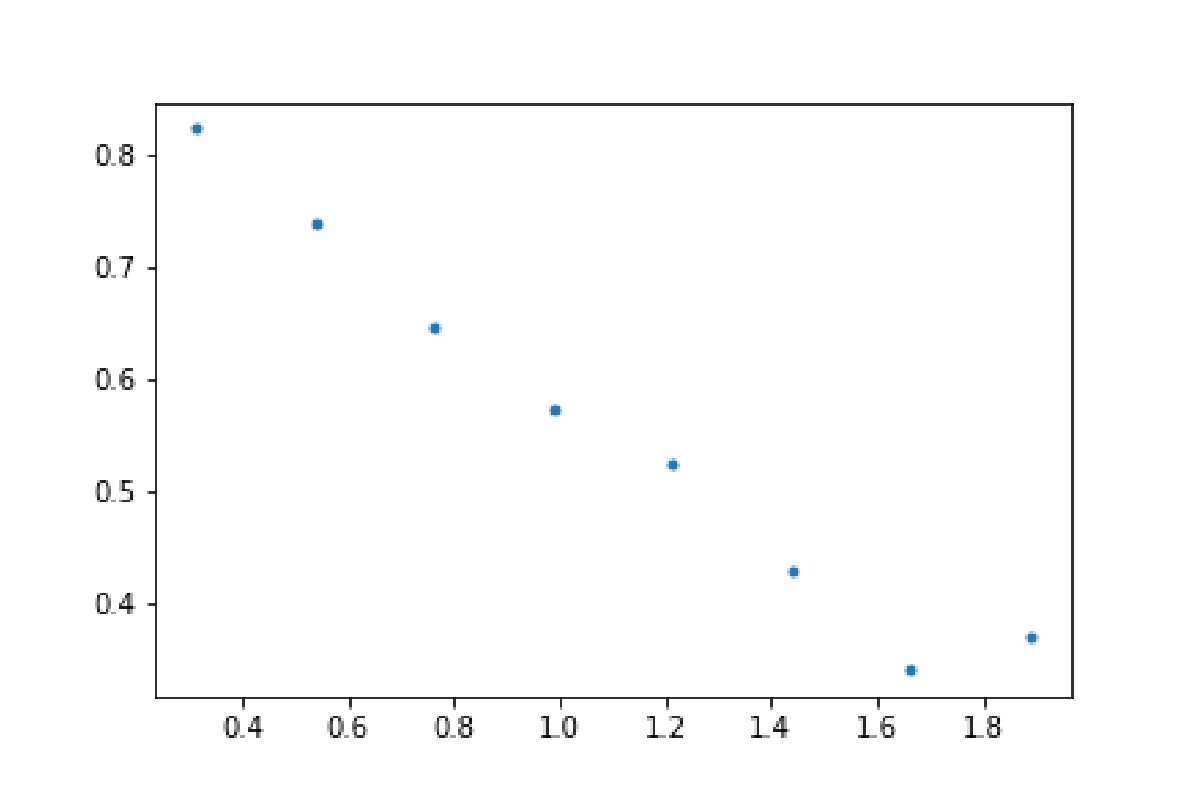
| i | r | Calculated | Normalized |
|---|---|---|---|
| 1 | 0.312500 | 0.004212 | 0.843662 |
| 2 | 0.537500 | 0.003606 | 0.722433 |
| 3 | 0.762500 | 0.002967 | 0.594357 |
| 4 | 0.987500 | 0.002693 | 0.539524 |
| 5 | 1.212500 | 0.002663 | 0.533361 |
| 6 | 1.437500 | 0.002265 | 0.453652 |
| 7 | 1.662500 | 0.001813 | 0.363239 |
| 8 | 1.887500 | 0.001968 | 0.394216 |
And final plot looks like this (Figure 15) (2p)
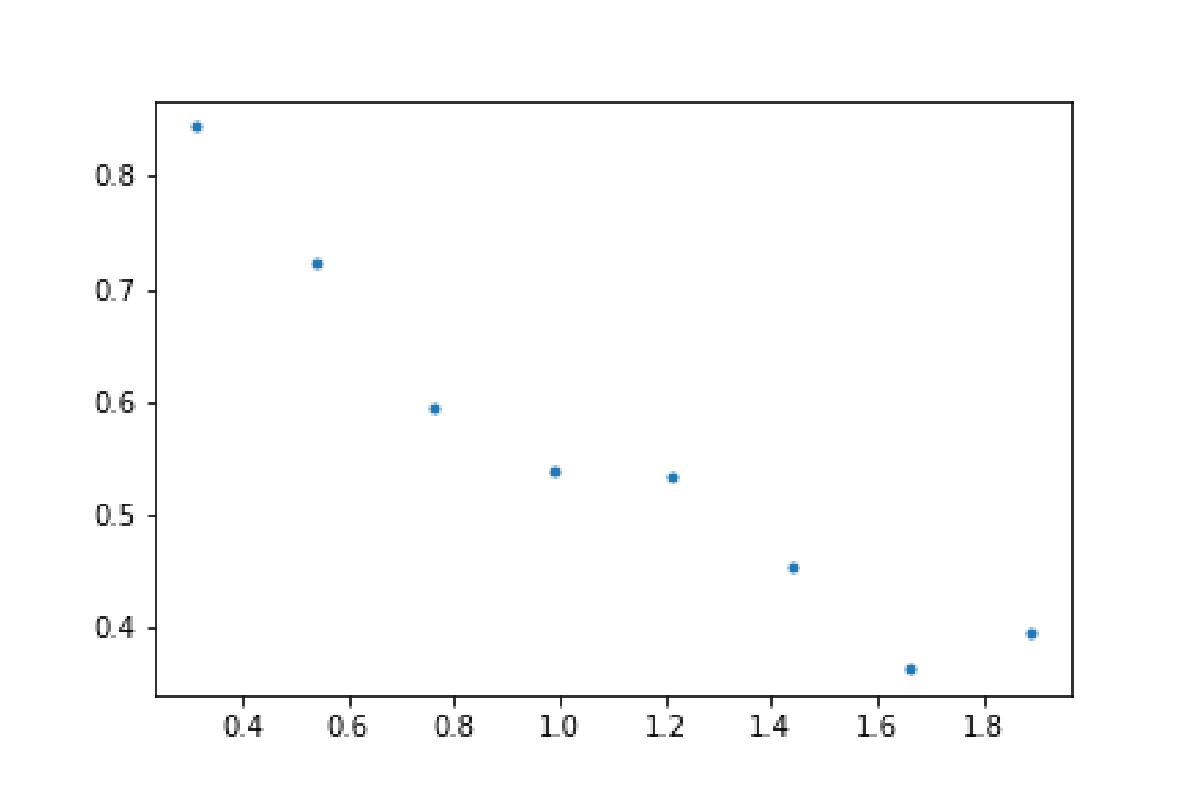
Most similar to this density is plot E on Figure 1 (1p).
Оригинал в Архива: IOAA-Data.pdf · официални решения: Data_Solution.pdf · допълнителни данни: Data Analysis Problems & Solutions.pdf