IOAA 2023, Анализ на данни — Задача 2. Isolated black hole
Data Analysis · 75 т.
Table of Constants
| Fundamental constants | |||
|---|---|---|---|
| Speed of light in vacuum | |||
| Planck constant | |||
| Boltzmann constant | |||
| Stefan-Boltzmann constant | |||
| Elementary charge | |||
| Universal gravitational constant | |||
| Universal electric constant | |||
| Universal gas constant | |||
| Avogadro constant | |||
| Wien’s displacement constant | |||
| Mass of electron | |||
| Mass of proton | |||
| Mass of neutron | |||
| Mass of Helium nucleus | |||
| Atomic mass unit (a.m.u., Dalton) |
| Astronomical data | |||
|---|---|---|---|
| Hubble constant | |||
| North Ecliptic Pole () | |||
| North Galactic Pole () | |||
| 1 jansky | 1 Jy | ||
| 1 parsec | 1 pc | ||
| au | |||
| ly | |||
| 1 astronomical unit (au) | 1 au | ||
| 1 sidereal day | h | ||
| 1 tropical year | solar days | ||
| 1 sidereal year | solar days |
Approximations
if and
Gauss’s formulae
Spherical law of cosines:
Spherical law of sines:
| The Sun | |||
|---|---|---|---|
| Solar luminosity | |||
| Apparent angular diameter of Sun | 32’ | ||
| Effective temperature of Sun | |||
| Apparent visual magnitude | |||
| Absolute visual magnitude | |||
| Apparent bolometric magnitude | |||
| Absolute bolometric magnitude | |||
| Distance of the Sun from the Galactic centre |
| The Earth and Moon | |||
|---|---|---|---|
| Obliquity of the ecliptic (Earth) | |||
| Platonic year (period of precession of Earth’s axis) | years | ||
| Apparent visual magnitude of full Moon | |||
| Apparent angular diameter of Moon | |||
| Inclination of the lunar orbit to the ecliptic | |||
| Inclination of the lunar equator to its orbital plane | |||
| Lunar sidereal month | d | ||
| h | |||
| Synodic month | d | ||
| Tropical month | d | ||
| Anomalistic month (the average time between two successive Moon’s perigees) | d | ||
| Draconic month (time between two successive transits of the Moon through the same node) | d |
The Solar System
| Object | Mean radius [km] | Mass [kg] | Semimajor axis [au] | Eccentricity |
|---|---|---|---|---|
| Sun | — | — | ||
| Mercury | ||||
| Venus | ||||
| Earth | ||||
| Moon | km | (range ) | ||
| Mars | ||||
| Jupiter | ||||
| Saturn | ||||
| Uranus | ||||
| Neptune |
Data analysis - instructions
- Do not touch envelopes until the start of the examination.
- The data analysis examination lasts for 3 hours and is worth a total of 125 marks.
- There are Answer Sheets for carrying out detailed work and Working Sheets for rough work, which are already marked with your student code and question number.
- Use only the answer sheets for a particular question for your answer. Please write only on the printed side of the sheet. Do not use the reverse side. If you have written something on any sheet which you do not want to be evaluated, cross it out.
- Use as many mathematical expressions as you think may help the evaluator to better understand your solutions. The evaluator may not understand your language. If it is necessary to explain something in words, please use short phrases (if possible in English).
- You are not allowed to leave your work desk without permission. If you need any assistance (malfunctioning calculator, need to visit a restroom, etc.), please draw the attention of the supervisor.
- The beginning and end of the examination will be indicated by the supervisor. The remaining time will be displayed on a clock.
- At the end of the examination you must stop writing immediately. Put everything back in the envelope and leave it on the table.
- Once all envelopes are collected, your student guide will escort you out of the examination room.
- A list of constants and useful relations are included in the envelope.
Условие
In 2022, two independent groups reported the discovery of an isolated black hole based on observations of the gravitational microlensing event OGLE-2011-BLG-0462. In this problem, we will analyze data from the Hubble Space Telescope to reproduce their findings.
Gravitational microlensing occurs when the light of a distant star (the ‘source’) is bent and magnified by the gravitational field of an intervening object (the ‘lens’). The characteristic angular scale of gravitational microlensing events, called the angular Einstein radius , depends on the mass and distance from the Earth to the lens:
where is the distance to the source star. For typical microlensing events observed in the Milky Way, the source stars are in the Galactic bulge, near the Galactic center, so kpc.
(a) Calculate the angular Einstein radius in milliarcseconds (mas) for an example lens of located at a distance of 1 kpc. [2 т.]
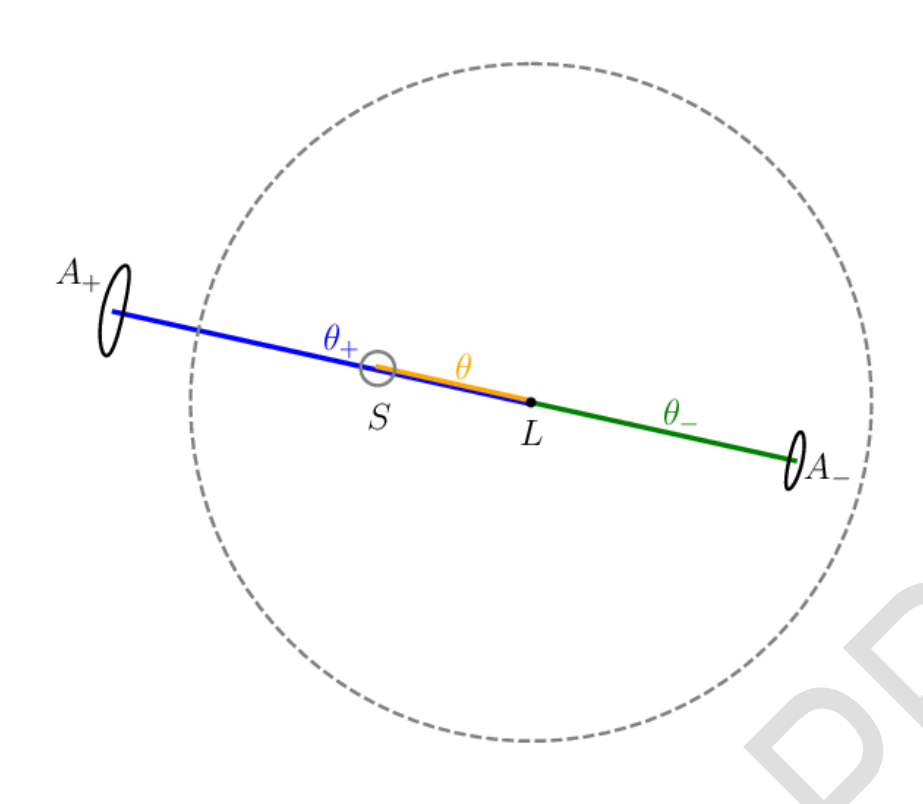
Suppose that at time the lens and the source are separated by an angle on the sky. Two images of the source are created on a line through the positions of the source and the lens, at angular distances and from the lens given by:
These two images are magnified, relative to the unlensed brightness of the source. The absolute amplification of the images is:
The image below shows the geometry of the event. The position of the lens is marked as , the unlensed position of the source is marked as , while and mark the positions of the two images of the source. The dashed circle has a radius of one Einstein radius.
(b) Current telescopes cannot normally resolve this pair of images, but only measure the position of the image centroid, i.e. the brightness-weighted mean of the positions of the two images. Derive an expression for the angular separation of the image centroid relative to the lens as a function of and . [8 т.]
(c) Derive an expression for the source deflection , i.e. the difference between the location of the centroid and the unlensed position of the source, as a function of and . What is the source deflection when the lens and the source are nearly perfectly aligned ()? [4 т.]
The source and lens are moving relative to each other in the sky. Thus, both the total magnification of the images and the position of the centroid changes with time, resulting in observable photometric and astrometric microlensing effects. For now, we assume that the source-lens relative motion is rectilinear.
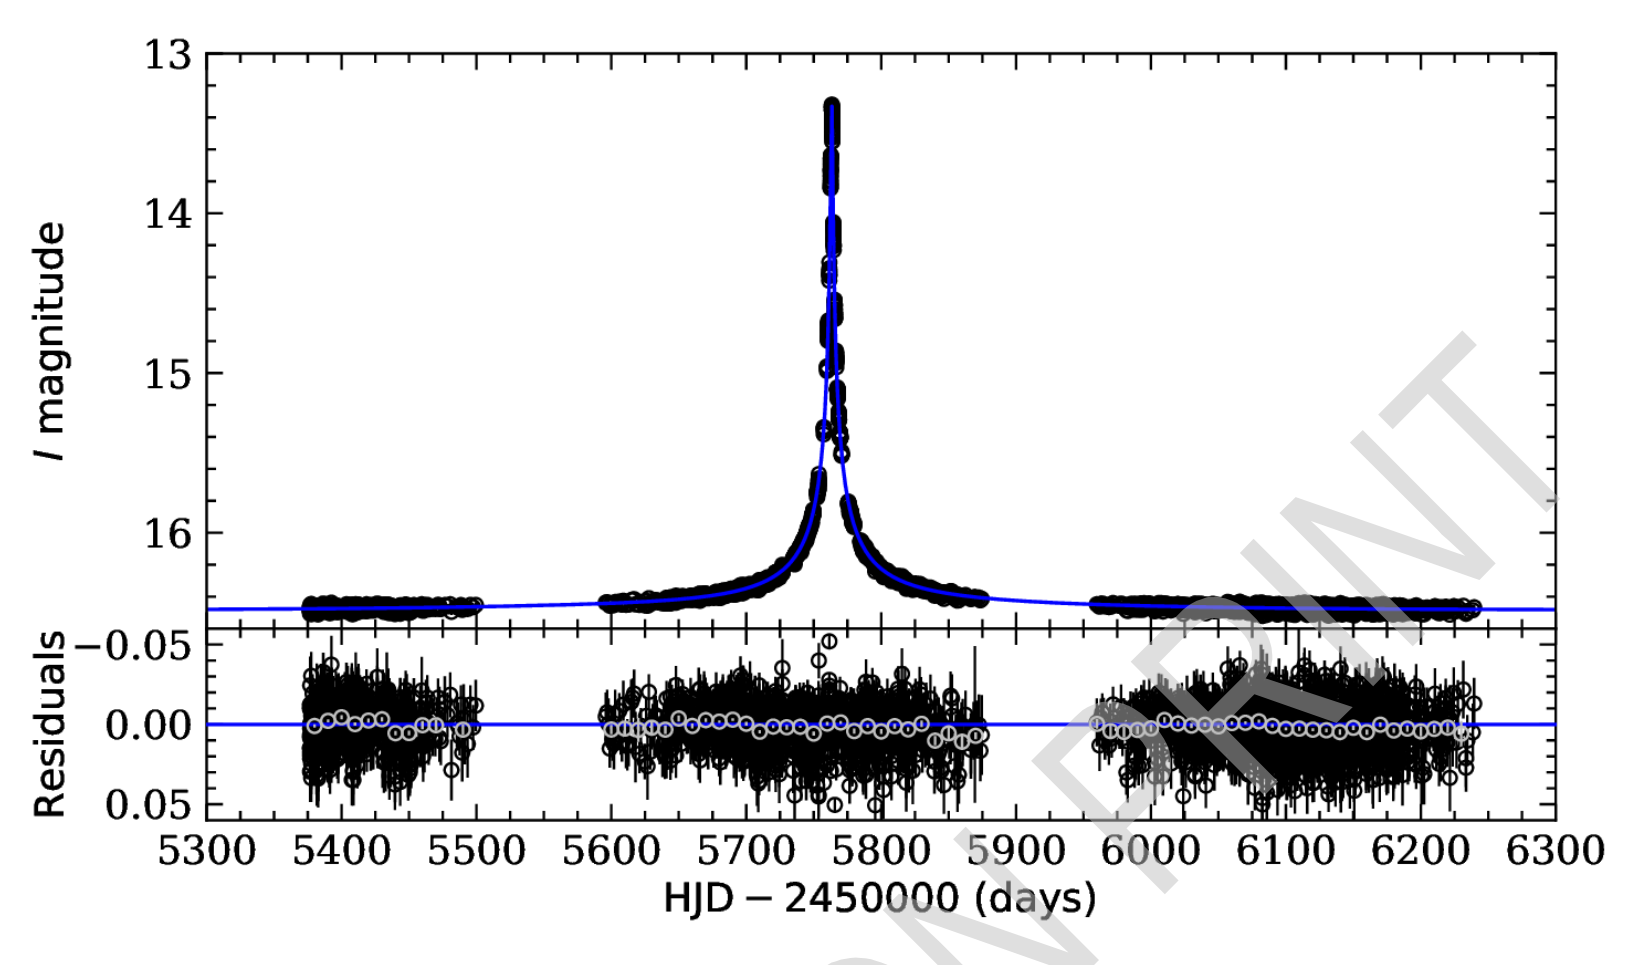
The plot below shows the light curve of the gravitational microlensing event OGLE-2011-BLG-0462, discovered by the OGLE sky survey led by astronomers from the University of Warsaw. The solid line shows the best-fitting light curve model. The Einstein timescale of the event, i.e. the time needed for the source to move by one angular Einstein radius relative to the lens, was days. The event peaked on 21 July 2011 (). The minimal separation between the lens and the source was .
The table below shows the measured positions of the source star against the background objects in the East and North directions based on images from the Hubble Space Telescope.
| HJD | E position (mas) | N position (mas) |
|---|---|---|
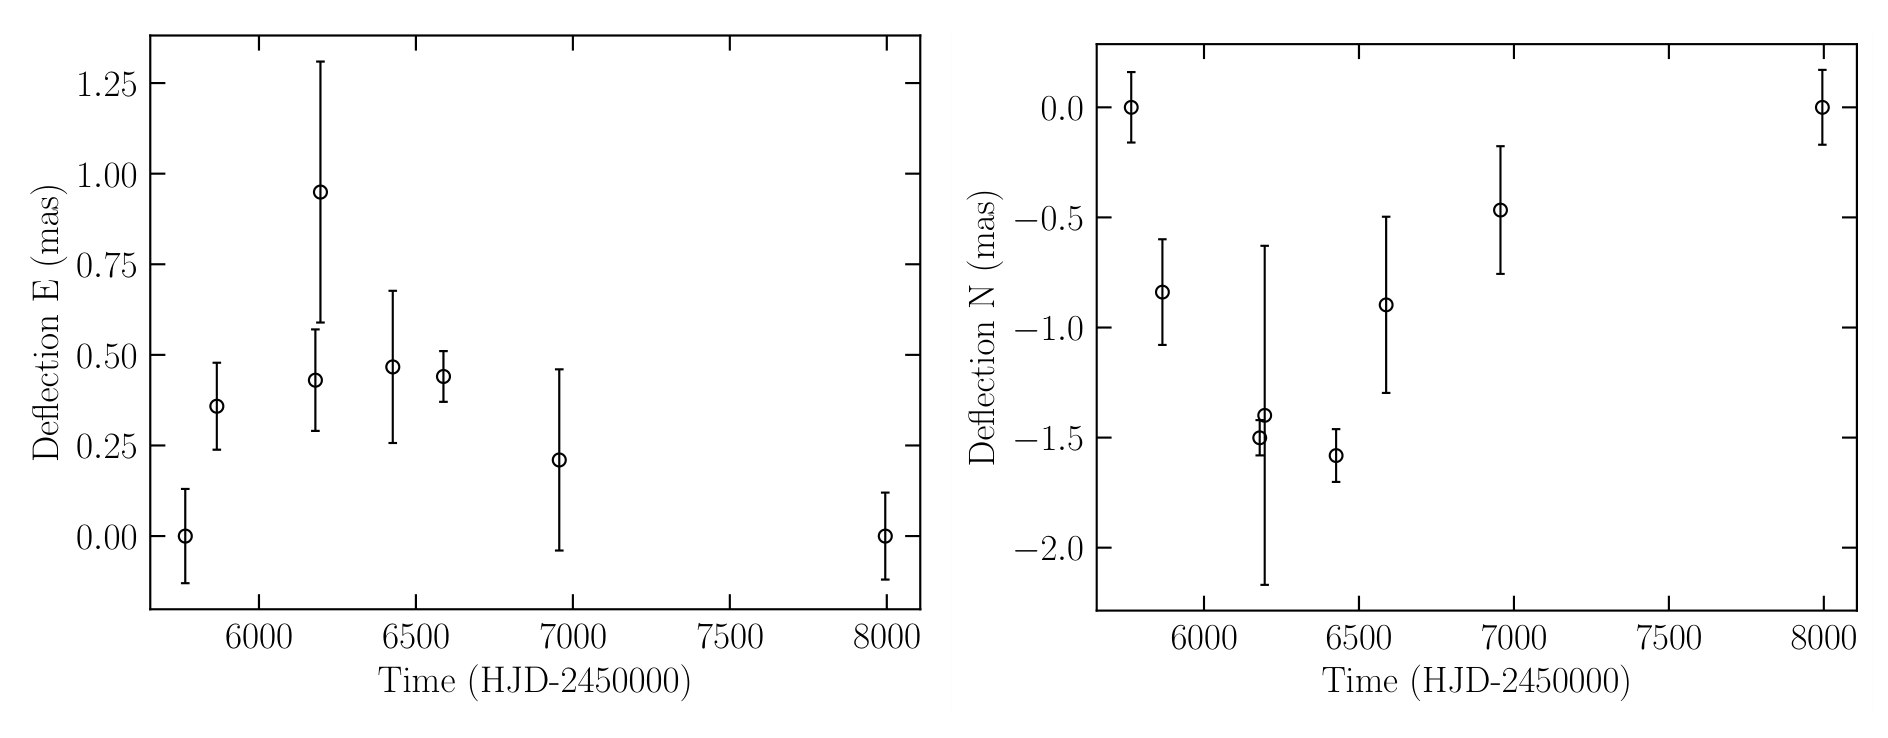
(d) Plot the measured positions of the source star in the East and North directions as a function of time. [10 т.]
(e) The observed motion of the source star is the sum of two effects: rectilinear proper motion of the source and astrometric microlensing effects. Calculate the proper motion (in mas/year) of the source in the East and North directions and its uncertainty. [8 т.]
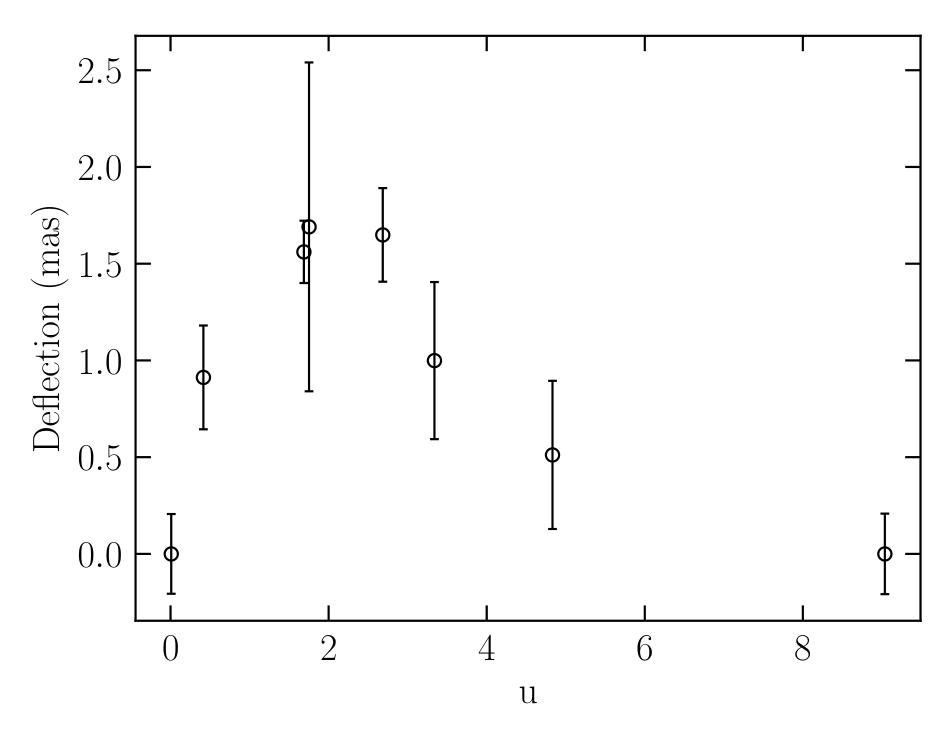
(f) After subtracting the effects of proper motion from the data, calculate and plot the total resultant astrometric deflection as a function of . Neglect uncertainty of the proper motion determination. [20 т.]
(g) Analyse the data to determine the angular Einstein radius of the event and its uncertainty. (Hint: it may be helpful to linearise the expression for ). [16 т.]
(h) For long-timescale events such as OGLE-2011-BLG-0462, the rectilinear approximation of the relative lens-source proper motion is not strictly true and the orbital motion of the Earth has to be taken into account. This allows measurement of a dimensionless quantity called the microlensing parallax, defined as , where and are parallaxes of the lens and the source, respectively.
For this event . Rearrange the expression for given earlier to calculate the mass of the lens in solar masses and its uncertainty. [7 т.]
Отговори
(a) 2.7 mas
(b)
(c)
Δθ(u = 0) = 0: no deflection when the lens and the source are nearly perfectly aligned.
(e) μE = −2.247 ± 0.029 mas/yr, μN = −3.674 ± 0.038 mas/yr
(g) 4.5 mas
Official result: θE = 4.5 ± 0.4 mas.
(h) 5.8 Msun
Official result: M = 5.8 ± 0.8 M_⊙.
Решение
Solution
(a)
The angular resolution of modern large () optical () telescopes is . Thus, , so the images created during microlensing events cannot be resolved by these telescopes.
(2 points)
(b)
(8 points)
(c)
(3 points)
so there is no deflection when the lens and the source are nearly perfectly aligned.
(1 points)
(d)
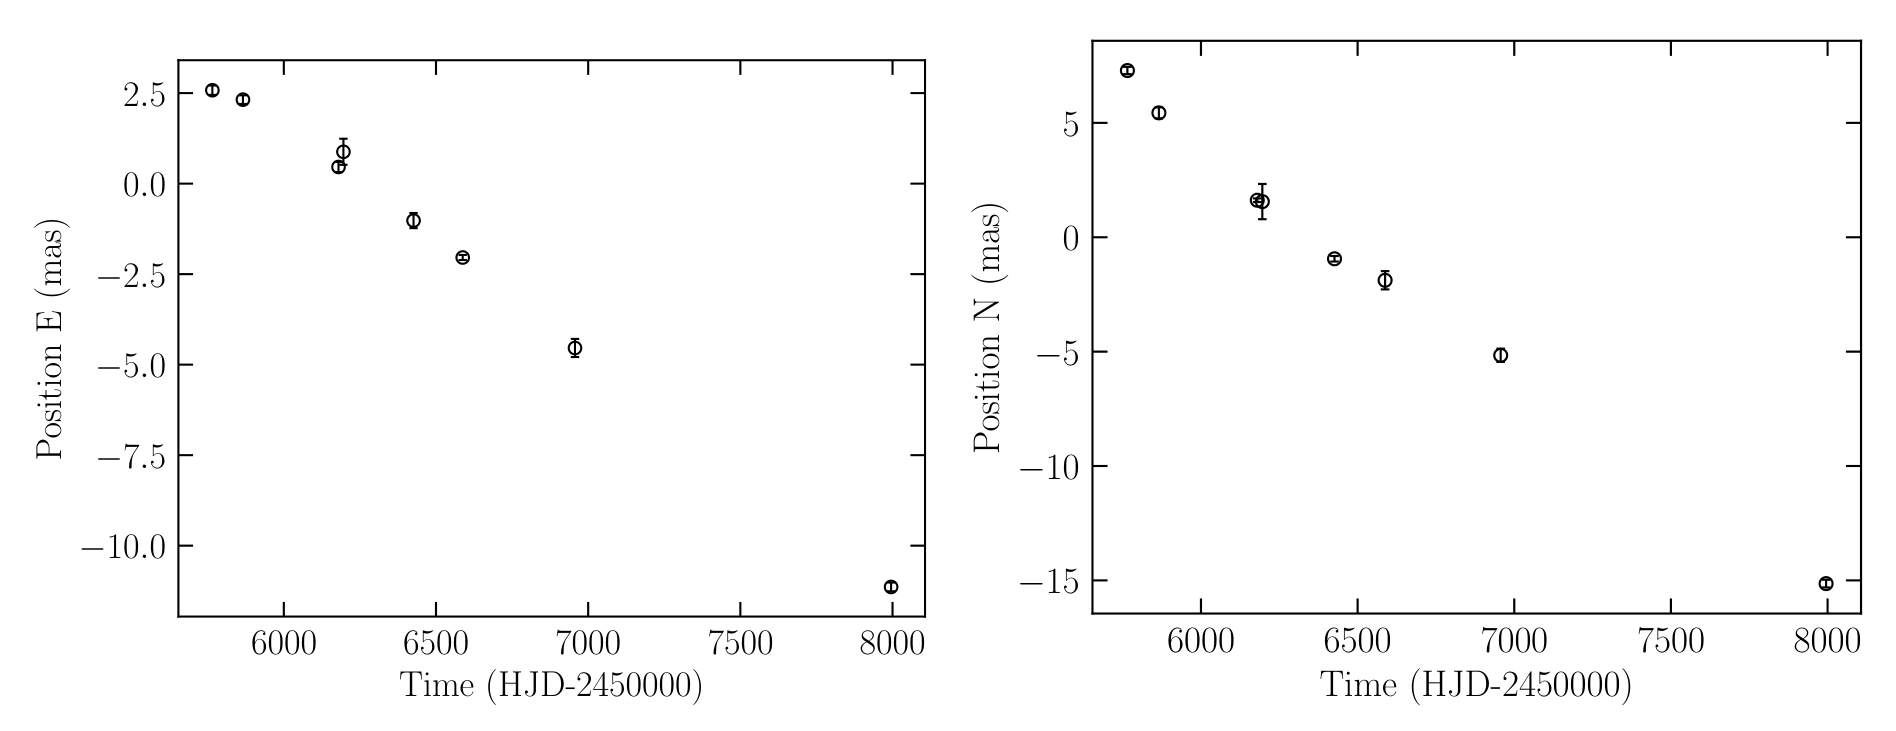
(10 points, 5 points for each graph)
(e) I will use the fact that the first epoch of astrometric observations was taken close to the peak of the light curve (that is, , that is, almost no astrometric deflection). Similarly, astrometric deflection is close to zero for the last epoch. Thus,
(8 points)
No points should be given if a student does not recognize that the deflection is zero during the first epoch, e.g., they try fitting a straight line to all data points.
(f) I fitted a straight line joining the first and last epoch data and then subtracted it from astrometric measurements. This is because the observed path of the source on the sky is the sum of two effects: the rectilinear proper motion of the source and the astrometric deflection:
where is the East position of the source during the first epoch, is the North position of the source during the first epoch, is the time of the first observation, and and is the astrometric deflection due to microlensing in East and North direction, respectively.
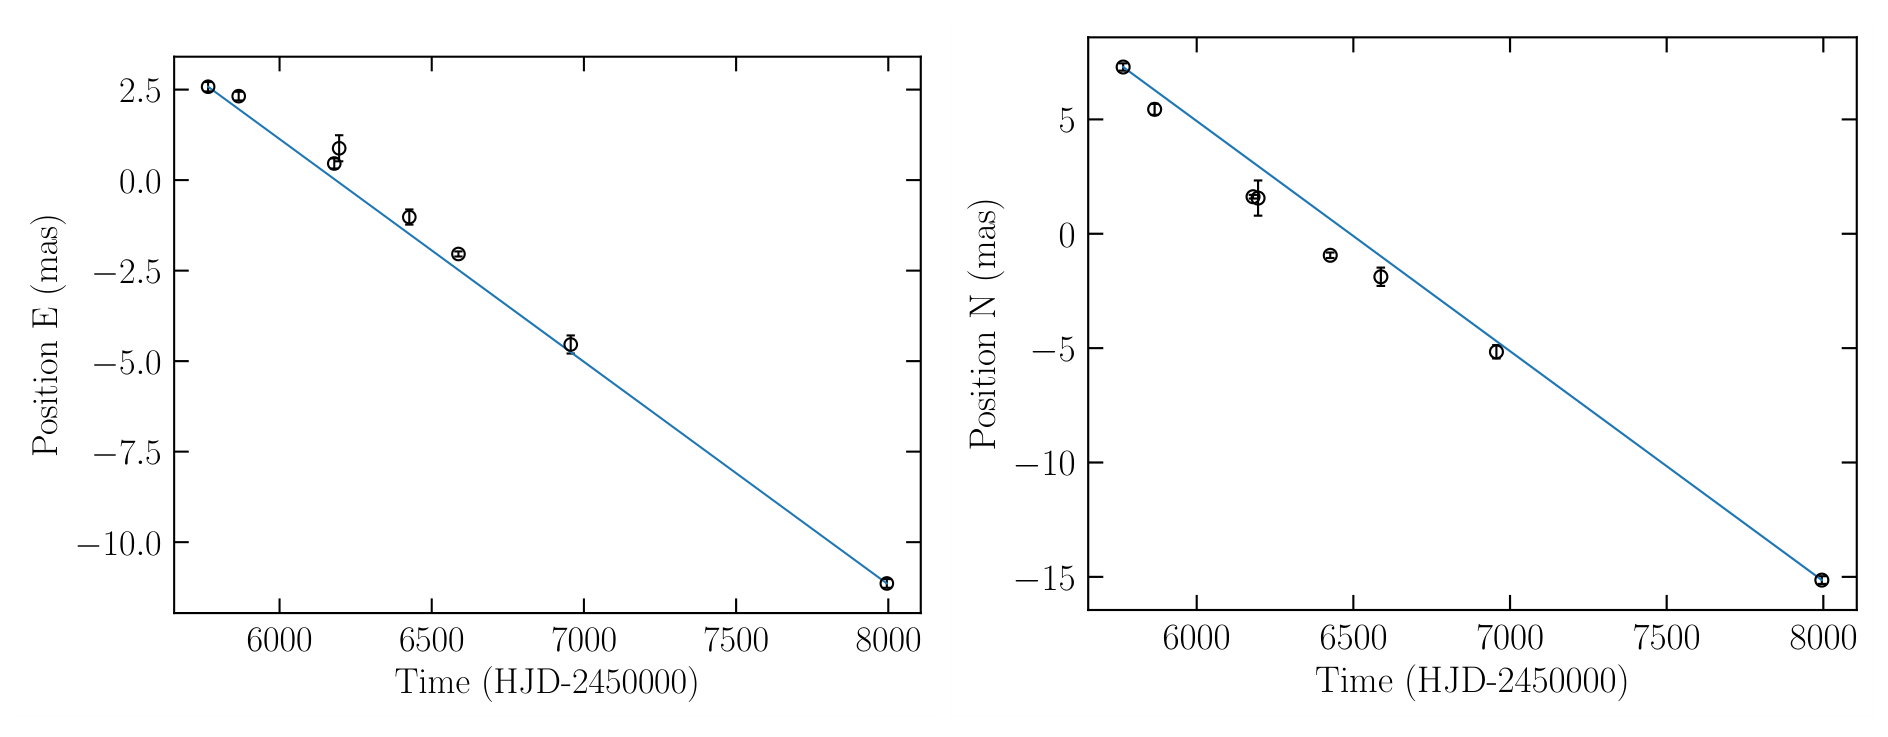
Thus, the astrometric deflection during th epoch is:
and the total deflection is:
I will also use the fact that , so , where is the peak time. Results of my calculations are shown in the table below.
| Epoch | (E,mas) | (N,mas) | (mas) | |
|---|---|---|---|---|
| 1 | ||||
| 2 | ||||
| 3 | ||||
| 4 | ||||
| 5 | ||||
| 6 | ||||
| 7 | ||||
| 8 |
(20 points)
(g) We would like to fit the function to the data. Thus, my “new” independent variable would be . Now, I would like to fit the function , where . Thus
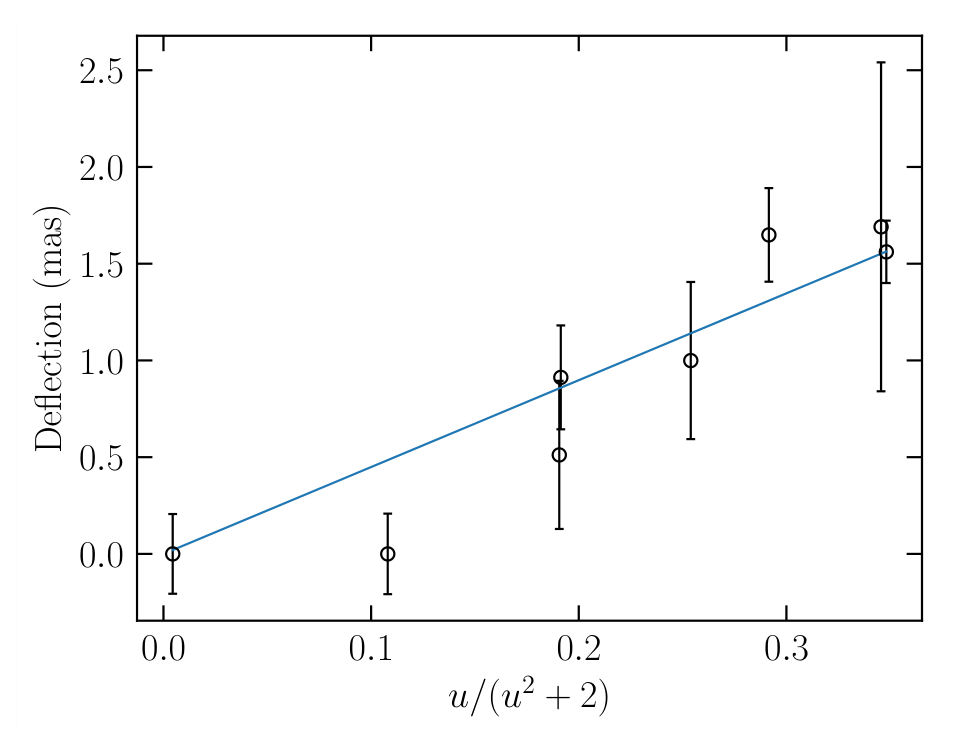
Alternative solution:
The gravitational deflection is described by the formula . It can be demonstrated that this function reaches a local maximum for with . From the data, we can estimate the maximum deflection of . Thus, .
(16 points)
(h)
Let be the relative lens–source parallax. From the definition of the angular Einstein radius we have
From the definition of the microlensing parallax , so this equation becomes:
and hence
The uncertainty on can be determined from the relation:
(7 points)
Grading
| a | Correct value of | 2 |
| b | Correct formula | 8 |
| c | Correct formula | 4 |
| d | Correct plots (5 pts for each plot) | 10 |
| e | Correct within | 3 |
| Correct within | 1 | |
| Incorrect () | 0 | |
| Uncertainty on | 1 | |
| Correct within | 3 | |
| Correct within | 1 | |
| Incorrect () | 0 | |
| Uncertainty on | 1 | |
| No points should be given if the student does not recognize that the deflection is zero during the first epoch | ||
| f | Calculation of the impact parameter for all epochs | 4 |
| Calculation of the total deflection | 6 | |
| Calculation of the uncertainties | 5 | |
| Graph | 5 | |
| Grant full points if results are correct for 7 or 8 epochs | ||
| Grant 60% points if results are correct for 5 or 6 epochs | ||
| Grant 0 points if results are correct for 4 or less than 4 epochs | ||
| g | Correct result with an estimate of the uncertainty | 16 |
| Correct results without the estimate of the uncertainty | 8 | |
| h | Correct result | 7 |
| TOTAL | 75 |
Grading of the graphs:
- Students can get 5 pts for each correct graphs
- data points with error bars 3 pts
- axis labels with units, tick labels - 1 pts
- graph is clear, fills the entire area - 1 pts
Grant full points if the graph shows correct data for 7 or 8 epochs. Grant 60% points if the graph shows correct data for 5 or 6 epochs. Grant 0 points if the graph shows 4 or less than 4 epochs.
Оригинал в Архива: DA.pdf · официални решения: DA_sol.pdf