IOM 2019, Експеримент — Задача 2. Exercise 1.2: Measuring the expansion coefficient of plastic tube
The 4th International Olympiad of Metropolises — Carbon Dioxide Solubility in Water
Recommendations Regarding the Experiment
There are two long exercises in the proposed experiment. Exercise 1.5 and exercise 2.1 in total may take more than three hours to complete. Consider this fact when allocating time and responsibilities to the participants during the experiment.
Условие
Use a 20-ml syringe to measure the inner volume of the tube. Also measure the length of the tube. Calculate the cross-section area of the tube channel.
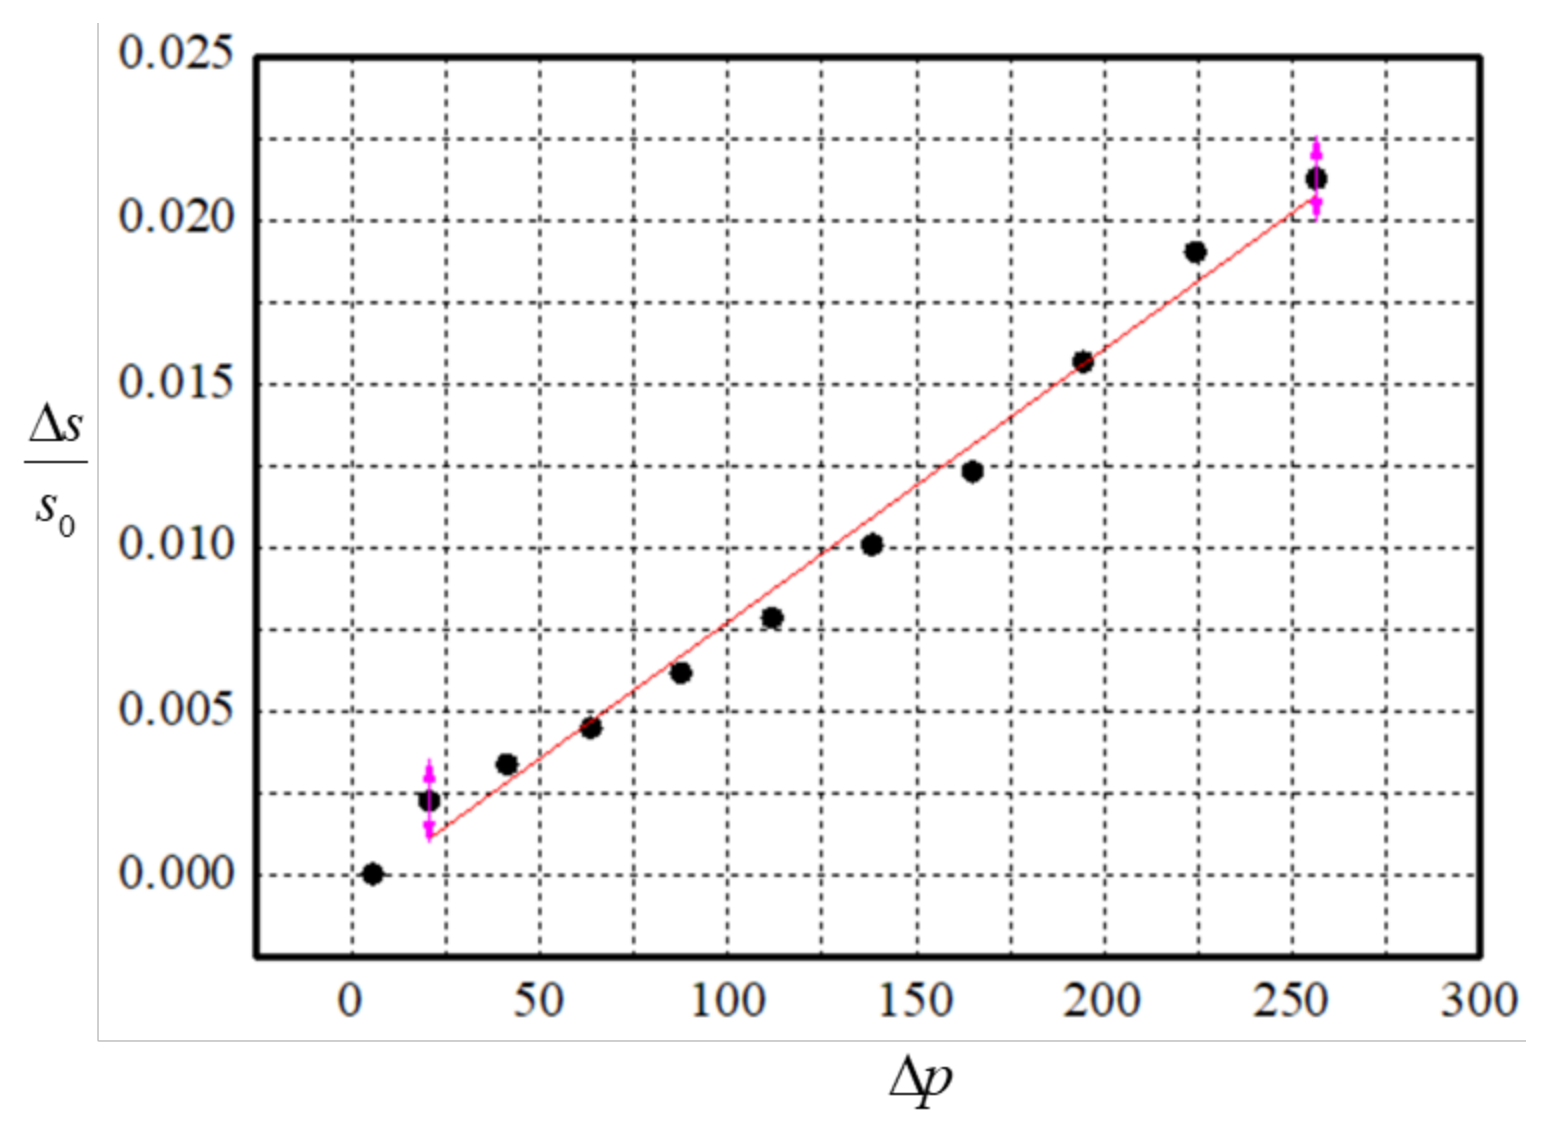
If additional pressure is created inside the plastic tube then the cross-section area of the tube channel changes. Suggest a method to reliably measure the relative change in cross-section area as a function of additional pressure in the tube. Explain the proposed method with the help of drawings similar to those shown in Fig. 1; make annotations to all the elements in your drawings. Measure the above relationship by obtaining at least 7 experimental points in the whole possible range of positive additional pressures in the tube. Draw a graph of the relationship obtained. Determine the slope of the graph.
Отговори
Slope of the graph: 8.3 mmHg⁻¹
Printed as „8.3 mmHg⁻¹“; the data in the table give a slope of about 8.3·10⁻⁵ mmHg⁻¹, so the power of ten appears to be missing in the source.
Решение
Exercise 1.2
Volume of the tube channel : 11 ml
Tube length : 149 cm
Cross-section area of the tube channel : 7.4 mm
| , mmHg | , cm | , cm | , cm |
|---|---|---|---|
| 5.8 | 0.5 | 89.9 | 0.0000 |
| 20.7 | 2 | 91.2 | 0.0022 |
| 41.4 | 4 | 93.1 | 0.0034 |
| 63.7 | 6 | 95 | 0.0045 |
| 87.6 | 8 | 96.85 | 0.0062 |
| 111.8 | 10 | 98.7 | 0.0078 |
| 138.4 | 12 | 100.5 | 0.0101 |
| 165 | 14 | 102.3 | 0.0123 |
| 194.4 | 16 | 104 | 0.0157 |
| 224.3 | 18 | 105.7 | 0.0190 |
| 256.4 | 20 | 107.5 | 0.0213 |
Explain the method of measuring the relationship between the tube cross-section area and pressure in the tube.
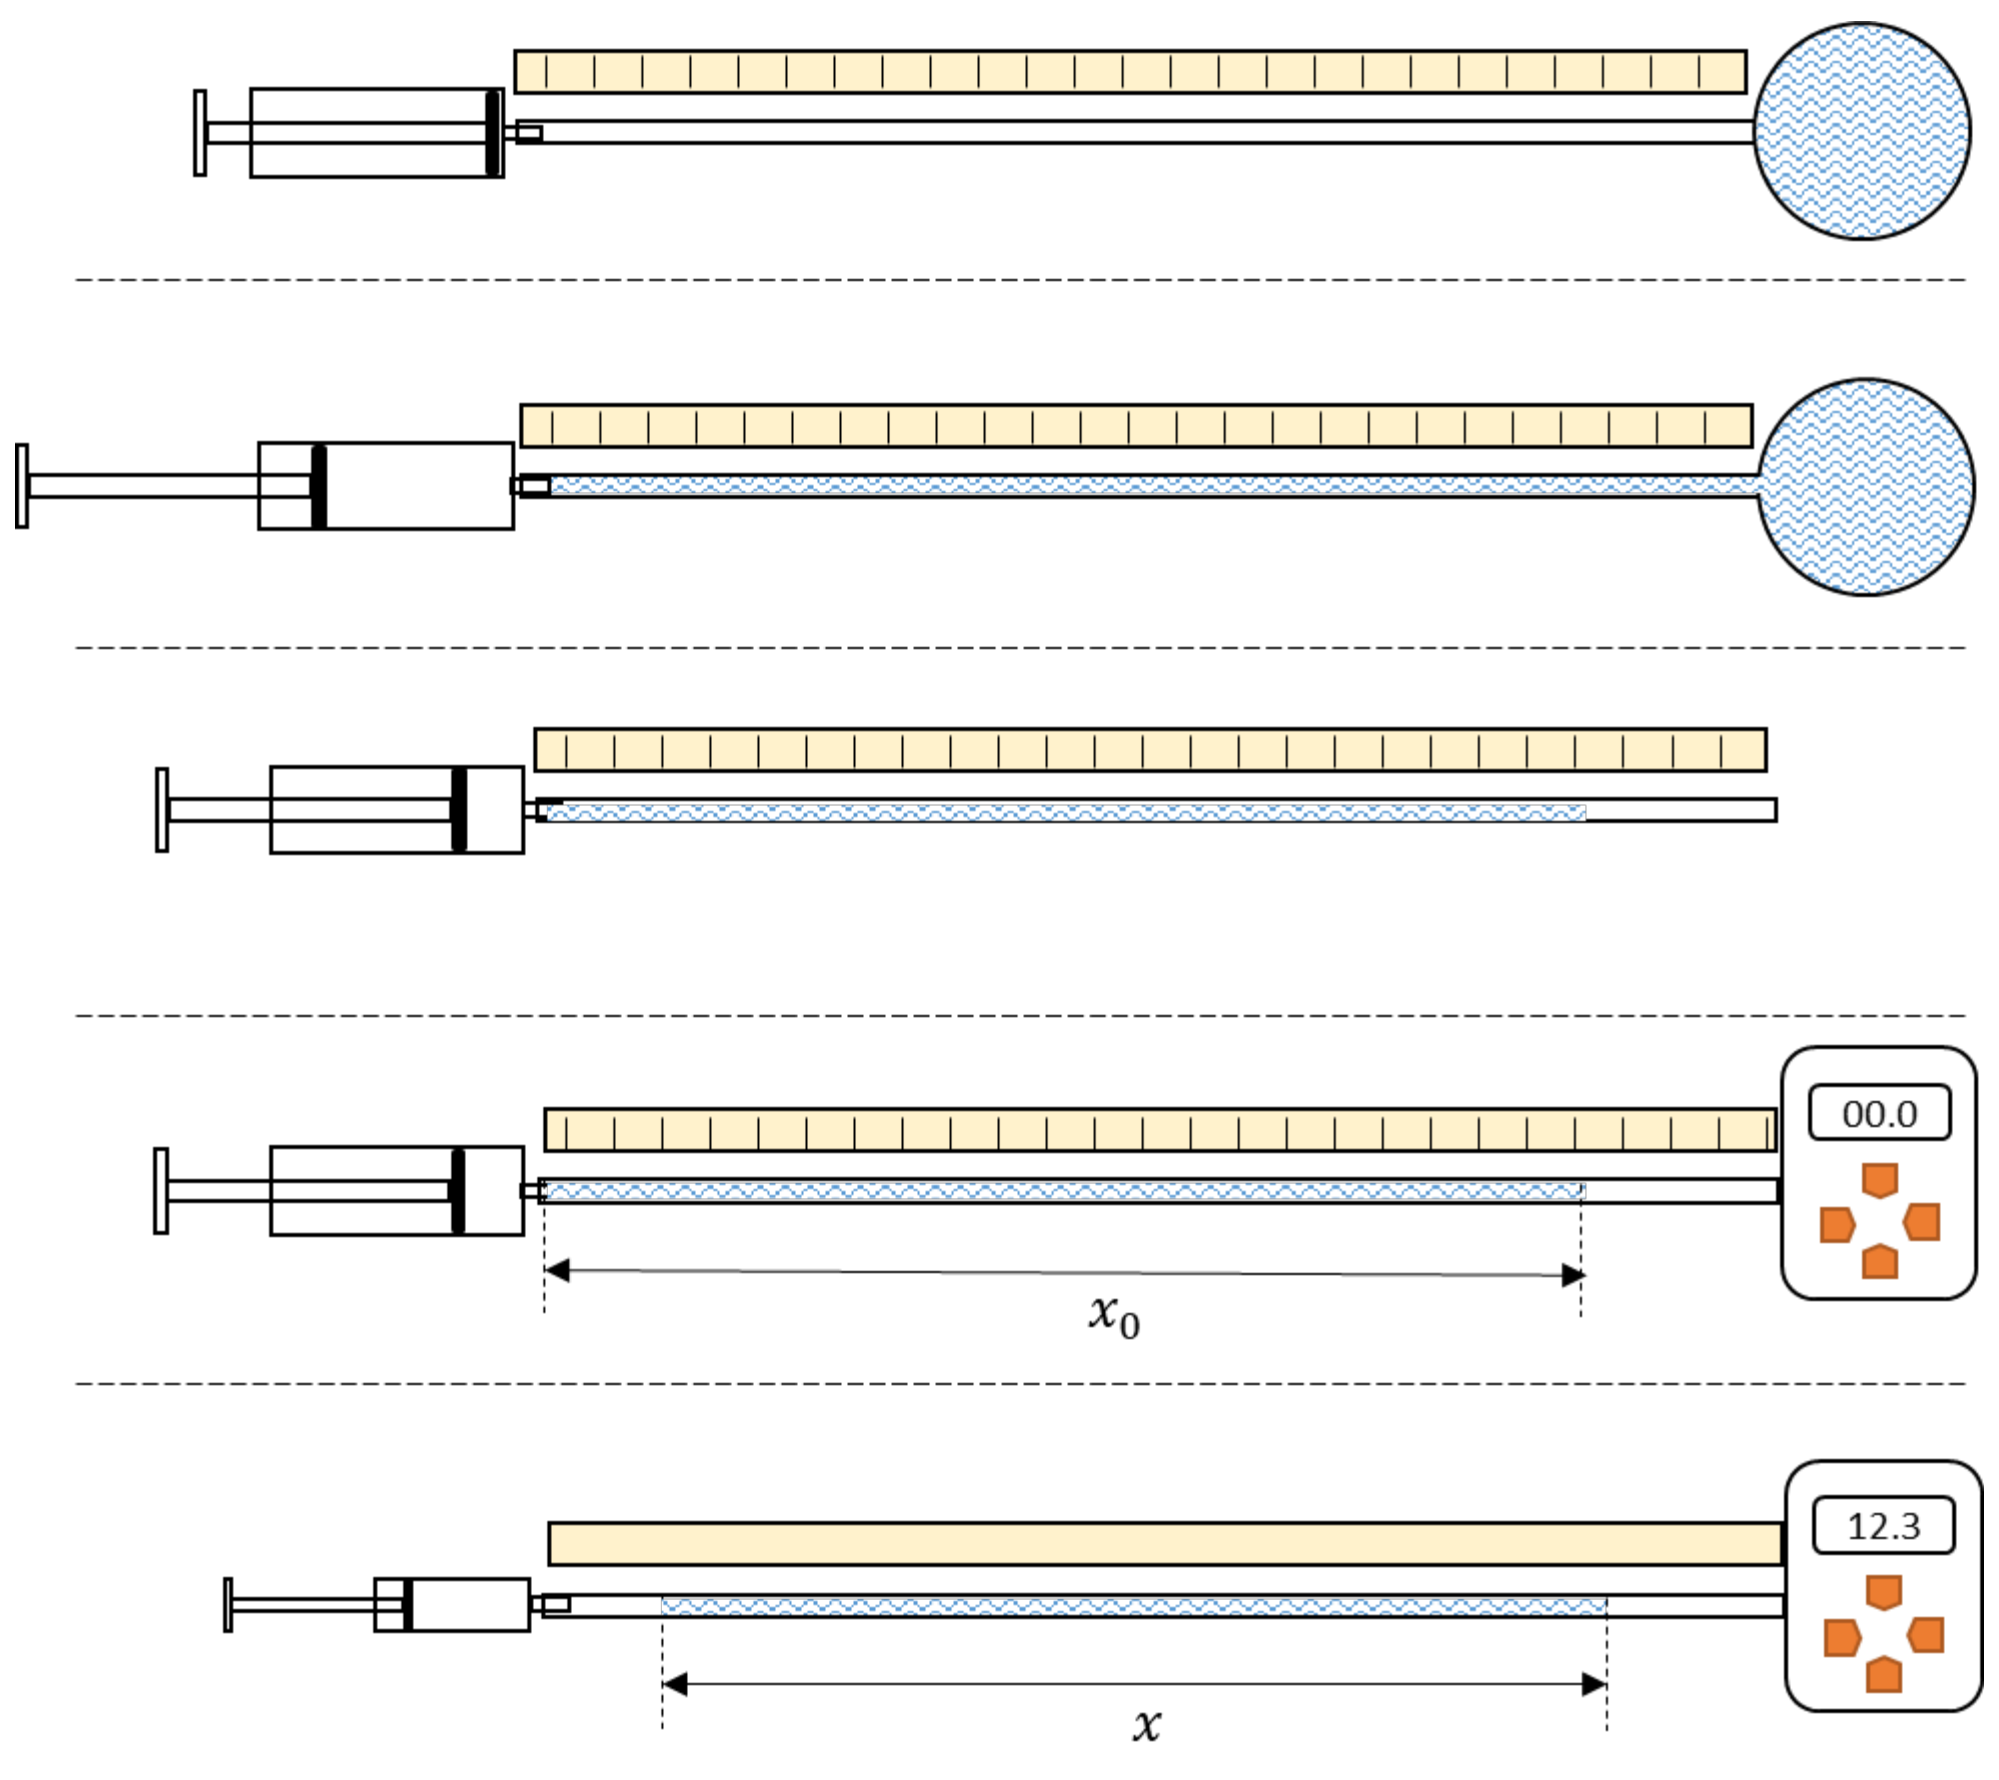
Slope of the graph: 8.3 mmHg
Graph of against
Оригинал в Архива: phys-task-prak-iom-2019-en.pdf · официални решения: phys-solution-prak-iom-2019-en.pdf