IPhO 1992, Експеримент — Задача 2. A Grating and Optical Filters
Experimental Problem 2: A Grating and Optical Filters
Event
XXIII IPhO — Helsinki-Espoo, Finland, July 5–13, 1992.
Условие
The following equipment is at your disposal:
- a small torch
- a non-standard reflection diffraction grating, fixed to a plastic block. The lines on this grating are in the form of circular arcs. Thus the behaviour of the grating is somewhat different from that of an ordinary diffraction grating.
- a few plastic toy blocks, to be used as supports
- several optical ‘slides’:
| Slide | Colour |
|---|---|
| 1 | red |
| 2 | red |
| 3 | blue |
| 4 | pink |
| 5 | purple |
| 6 | grey |
| 7 | white |
- three sheets of graph paper
- a cardboard box that may be used for supporting the apparatus
1) Determine the line separation of the reflection diffraction grating, as accurately as possible. Estimate the error in your result. Explain the theory and describe the experimental method used; draw diagrams where needed. Tabulate your raw experimental data, give your final numerical results complete with errors and an explanation of how you obtained them.
2) Slides 1–5 are coloured filters. Find which wavelengths are transmitted or absorbed by them. Report numerical values and error estimates where possible, or otherwise report your results graphically. Identify the optical item in slide 6.
3) Slide 7 consists of a wire mesh. Determine the distance between the wires in this mesh for both perpendicular directions. Fully describe your method in the form of a diagram.
Visible light has wavelength between and .
Warning
The torch batteries will not last forever. Switch the torch off when you are not using it as otherwise, after 40 minutes, the light will become noticeably dimmer and redder in colour.
Решение
Place the grating and lamp on a sheet of graph paper possibly by using suitable supporting blocks. Make a mark in the middle of the grating. By looking over the lamp find the mirror reflection (0th order spectrum) in the grating. Align the setup in such a way that a line from the lamp to the mark on the grating is parallel to the lines in the graph paper and then adjust the grating so that the mirror image of the lamp is seen exactly on the mark. For measurement purposes we define an -axis which is perpendicular to the line from the lamp to the grating and whose origin is located at the intersection of this -axis and the sighting line (from lamp to mark on the grating). This setup can be called a spectroscope, which is now aligned.
By looking from both sides one can now see a spectrum, actually two on both sides. Because the grid lines on our grating are circular the surface acts as a Fresnel lens that tends to magnify or demagnify the spectrum, but this phenomenon does not affect the angles that need to be measured. Find the side where it is easier to observe the first order spectrum. Find those directions where each colour is seen OVER THE MARK in the grating. Especially identify the directions where the extreme ends of the spectrum, i.e. deep red and violet blue are seen. These directions should correspond to wave lengths and .
Alternately one could perform a symmetric measurement by mesuring the ends of the spectra on both sides. But due to the Fresnel lens effect this may be more difficult.
Denote the distance from the grating to the -axis by . Denote the measurement from the origin of the -axis to the point where any of the sighting lines intersect the -axis by . Find for each end of the spectrum by using quantities and read off the graph paper. Then compute the grid constant from each value as , where is or .
Typical values might be as follows:
| Colour, wavelength | |||
|---|---|---|---|
| red, | |||
| blue, |
An uncertainty of in will affect by in the red end and by in the blue end. This can be found out by using a calculator. The quantity can easily be measured more accurately, uncertainty will change "red" by .
What would be a proper result for the grid constant ? If we assume that the given values for the red and blue ends of the visible spectrum have an uncertainty of the red end is more reliable. Moreover it is quite possible that an incandescent light bulb radiates weakly in the blue region. Thus one should probably give more weight to the measurement carried out with red light. A reasonable result from the values above would be with an uncertainty of .
A quick measurement with a red HeNe laser at gave a result . Actually not all gratings are equal. The nominal value given in technical literature is .
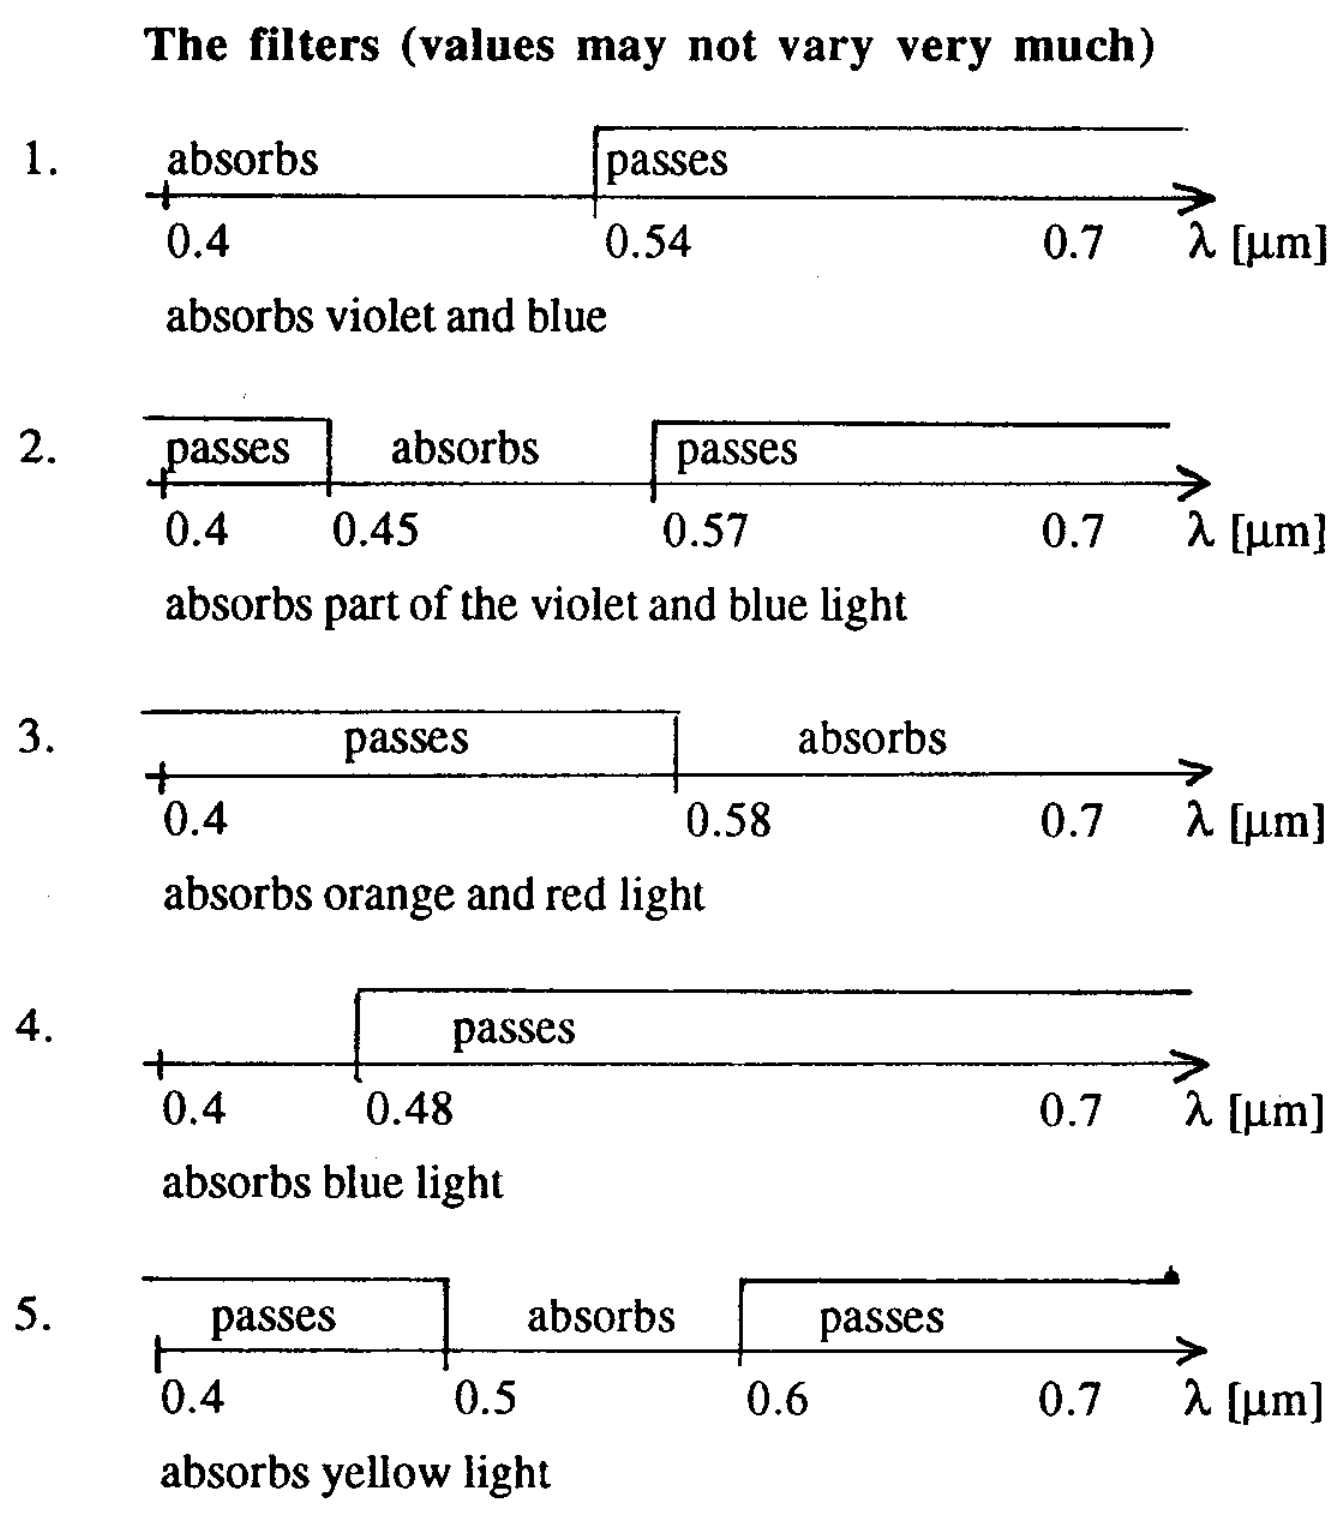
After one has determined the grid constant our spectroscope is also calibrated. We do not need really an accurate value of the quantity if we use the given end points and as fixed calibration points. By looking at the spectrum through each of the filters one soon gets an idea about their characteristics that is which colours are transmitted and which are absorbed. Since a human eye is not very suited to absolute intensity measurements the results can be presented as follows:
The following results are from measurements carried out independently before the results from the IPhO students arrived:
[The filters (values may not vary very much)]
A few comments can be made about the filters. Numbers 1 and 2 were made of red material used in front of floodlights used for stage lighting. They both transmit red light very well, but there is a small difference in cutoff wave length and moreover number 2 also transmits some blue light, it is almost pink.
Filters 3 .. 5 were made by photographing a VGA colour screen on slide film. They do not have pure colours and they have different characteristics. Number 3 is a high pass, number 4 is a low pass filter, together they make up an almost neutral grey filter. Number 5 is a band reject filter, it does not transmit yellow light.
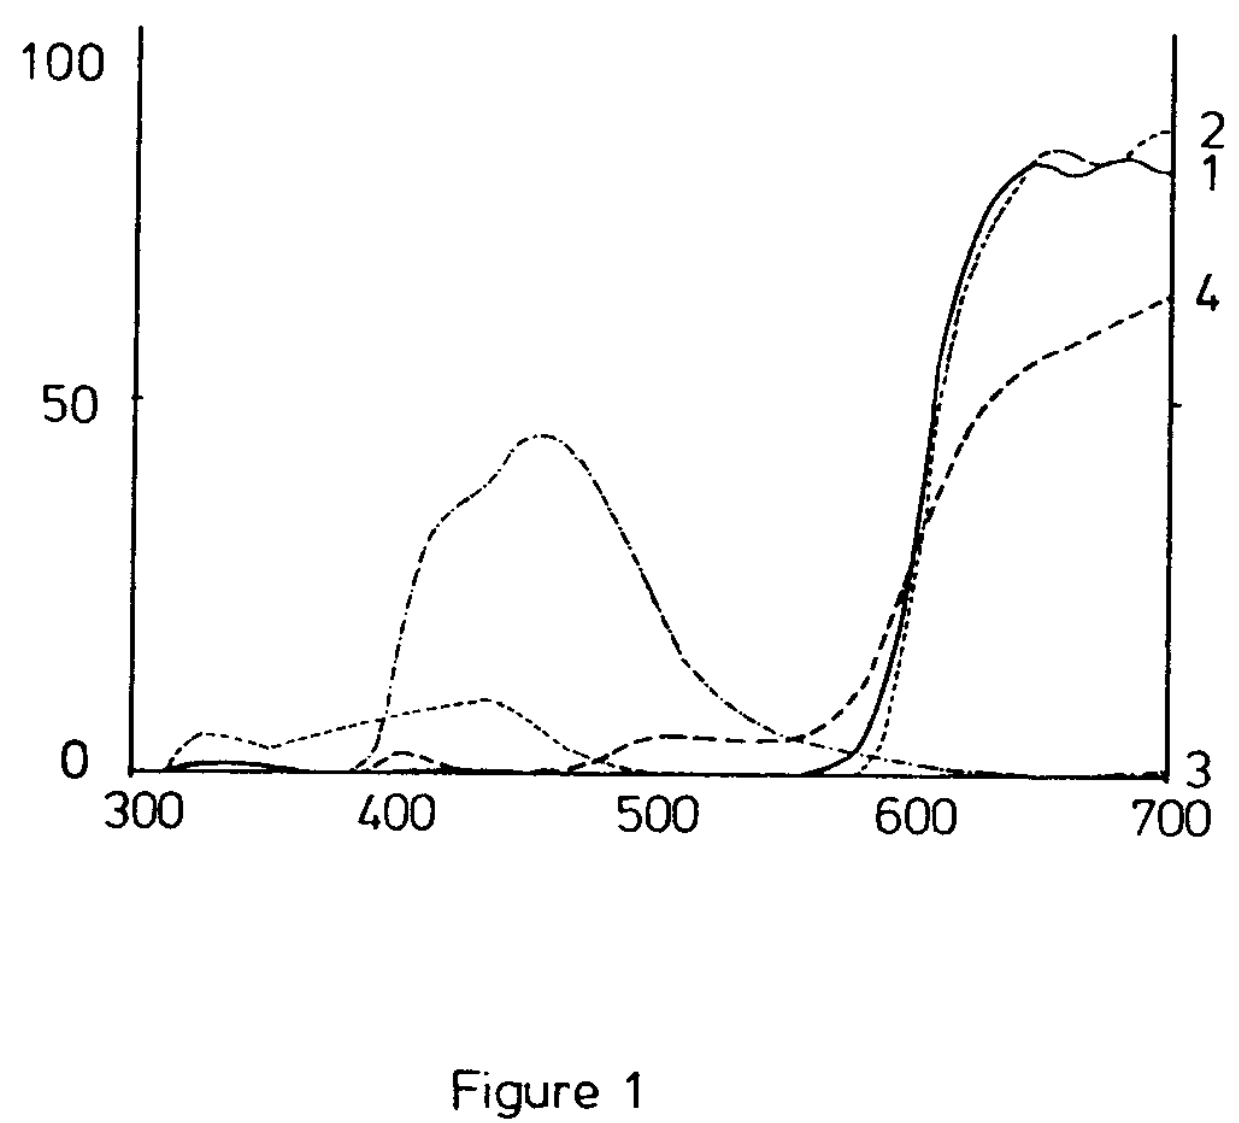
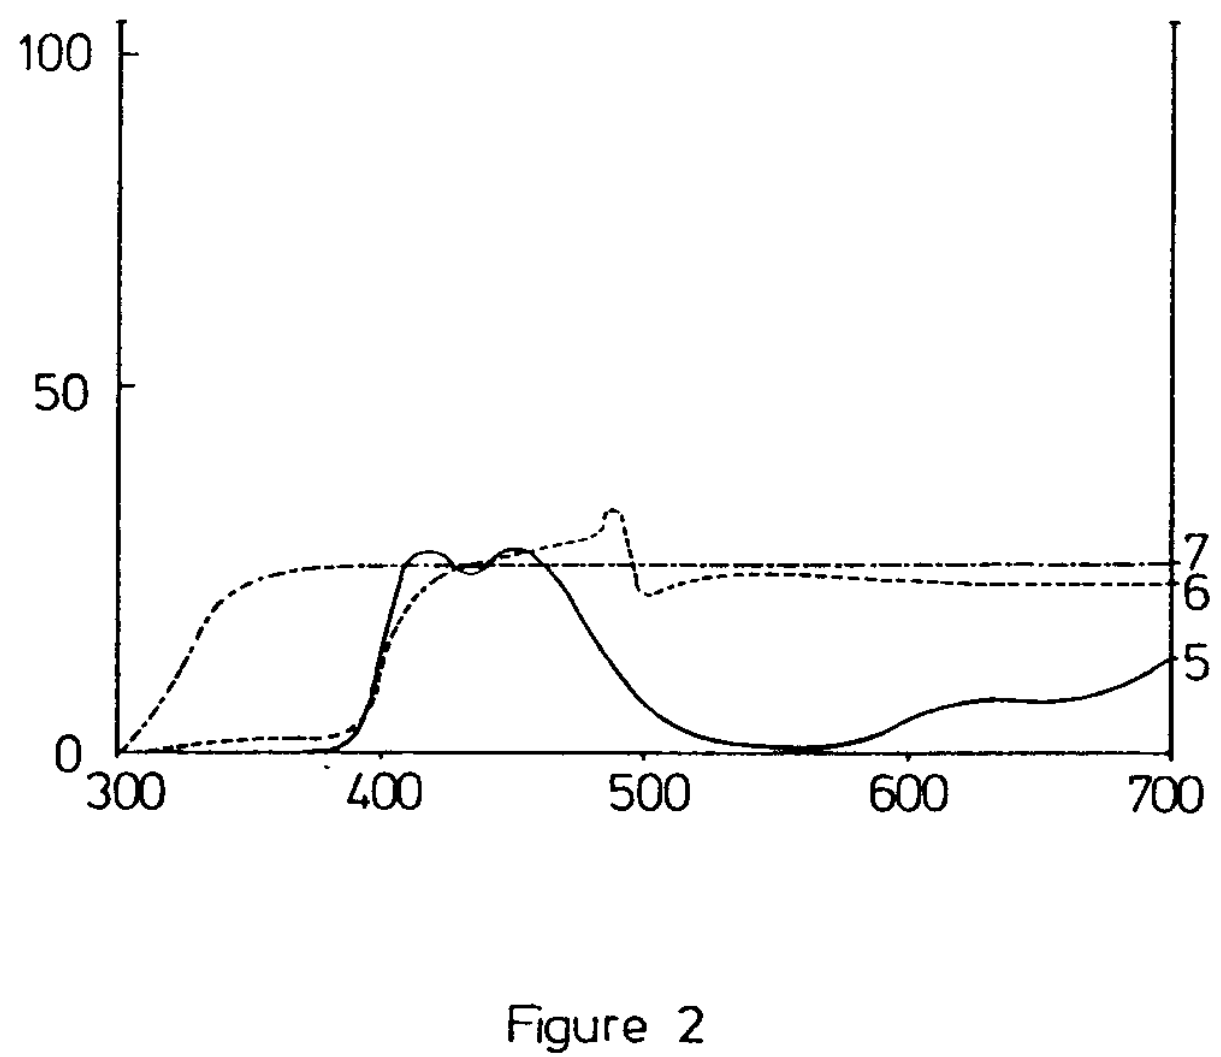
After the contest these filters were measured by using a spectrophotometer. The results are shown in figures 1 and 2. The cutoff wave lengths in the sketches shown above correspond very well to the measured curves. The eye does not measure intensities reliably as was stated above.
Item number 6 is a polarizer. It can be identified by looking at reflected light from any insulating surface, tabletop, ruler etc. Any LCD display in a watch or calculator will also identify it without difficulty.
[Figure 1]
[Figure 2]
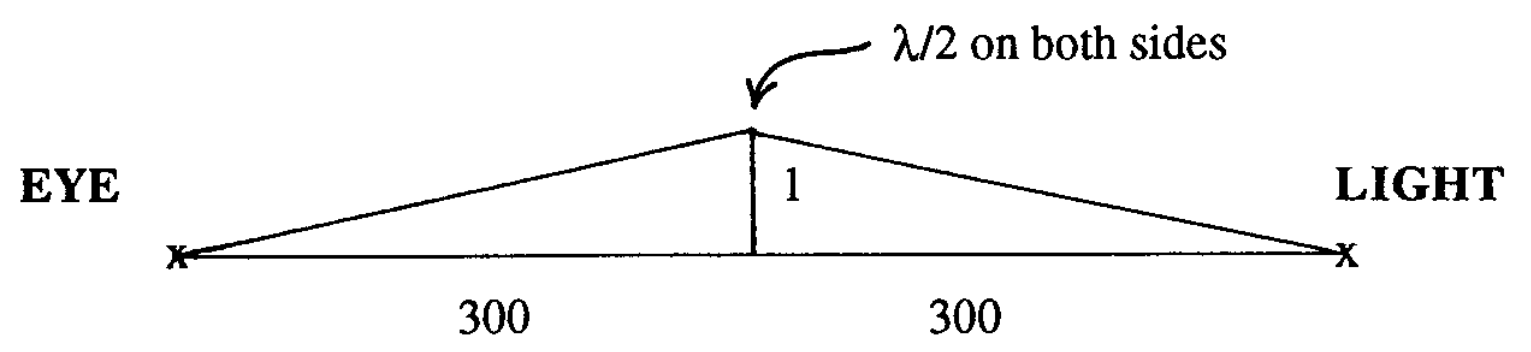
The last item number 7 is a fine mesh as was indicated in the text. By looking at a point light source (which is found if one looks into the penlight bulb from side) through the mesh a two dimensional diffraction pattern can be seen. The grid constant can be determined as follows: Take the mesh and a ruler in your hand so that the ruler is in front of the mesh. Then look through the mesh at the light and keep it half way between your eye and the light. Adjust the distance so that the diffraction pattern matches the millimeter scale on the ruler. Then note the distance between the eye and the light. It is approximately . Then the grid constant can be the computed from the geometry:
[Eye–mesh–light geometry]
The middle wave length of visible light is which gives for the grid constant.
An investigation with a microscope shows that the wires and holes in the mesh are roughly equal in width and that the holes are approximately .
Оригинал в Архива: 23rd_IPhO_1992_exp_problem_2.pdf · официални решения: 23rd_IPhO_1992_exp_problem_2.pdf · допълнителни данни: 23rd_IPhO_1992_distribution.pdf