IPhO 1995, Експеримент — Задача 2. Diffraction and Scattering of Laser Light
Experimental Question 2 — Diffraction and Scattering of Laser Light · 20 т.
Условие
The aim of this experiment is to demonstrate and quantify to some extent the reflection, diffraction, and scattering of light, using visible radiation from a Laser Diode source. A metal ruler is employed as a diffraction grating, and a perspex tank, containing water and diluted milk, is used to determine reflection and scattering phenomena.
Section 1 Place the 150 mm length metal ruler provided so that it is nearly normal to the incident laser beam, and so that the laser beam illuminates several rulings on it. Observe a number of “spots” of light on the white paper screen provided, caused by the phenomenon of diffraction.
Draw the overall geometry you have employed and measure the position and separation of these spots with the screen at a distance of approximately 1.5 metres from the ruler.
Using the relation
where
| is the order of diffraction | |
| is the radiation wavelength | |
| is the grating period | |
| is the angle of diffraction |
and the information obtained from your measurements, determine the wavelength of the laser radiation. [6 т.]
Section 2 Now insert the empty perspex tank provided into the space between the laser and the white paper screen. Set the tank at approximately normal incidence to the laser beam.
(i) Observe a reduction in the emergent beam intensity, and estimate the percentage value of this reduction. Some calibrated transmission discs are provided to assist with this estimation. Remember that the human eye has a logarithmic response.
This intensity reduction is caused primarily by reflection losses at the aid/perspex boundaries, of which there are four in this case. THe reflection coefficient for normal incidence at each boundary, , which is the ratio of the reflected to incident intensities, is given by
where and are the refractive indices before and after the boundary. The corresponding transmission coefficient, assuming zero absorption in the perspex, is given by
(ii) Assuming a refractive index of 1.59 for the perspex and neglecting the effect of multiple reflections and coherence, calculate the intensity transmission coefficient of the empty perspex tank. Compare this result with the estimate you made in Part (i) of this Section. [4 т.]
Section 3 Without moving the perspex tank, repeat the observations and calculations in Section 2 with the 50 mL of water provided in a beaker now added to the tank. Assume the refractive index of water to be 1.33. [1 т.]
Section 4 (i) Add 0.5 mL (12 drops) of milk (the scattering material) to the 50 mL of water in the perspex tank, and stir well. Measure as accurately as possible the total angle through which the laser light is scattered, and the diameter of the emerging light patch at the exit face of the tank, noting that these quantities are related. Also estimate the reduction in transmitted intensity, as in earlier sections.
(ii) Add a further 0.5 mL of milk to the tank, and repeat the measurements requested in part (i).
(iii) Repeat the process in part (ii) until very little or no transmitted laser light can be observed.
(iv) Determine the relationship between scattering angle and milk concentration in the tank.
(v) Use your results, and the relationship
where
| is the input intensity | |
| is the emerging intensity | |
| is the distance in the tank | |
| is the attenuation coefficient and equals a constant times the concentration of the scatterer | |
| is the transmission coefficient for the milk |
to obtain an estimate for the value of for a scatterer concentration of 10%. [10 т.]
Отговори
Section 1 690 nm
Official sample result: measured λ = (690 ± 70) nm; accepted value 680 nm.
Section 2 80.8 %
Calculated total transmission of the empty tank, ; estimates between 75% and 85% accepted for (i).
Section 3 88.5 %
Section 4 0.16 mm⁻¹
Official sample result at 10% concentration; also for the scattering angle.
Решение
Section 1
i. A typical geometric layout is as shown below.
(a) Maximum distance from ruler to screen is advised to increase the spread of the diffraction pattern.
(b) Note that the grating (ruler) lines are horizontal, so that diffraction is in the vertical direction.
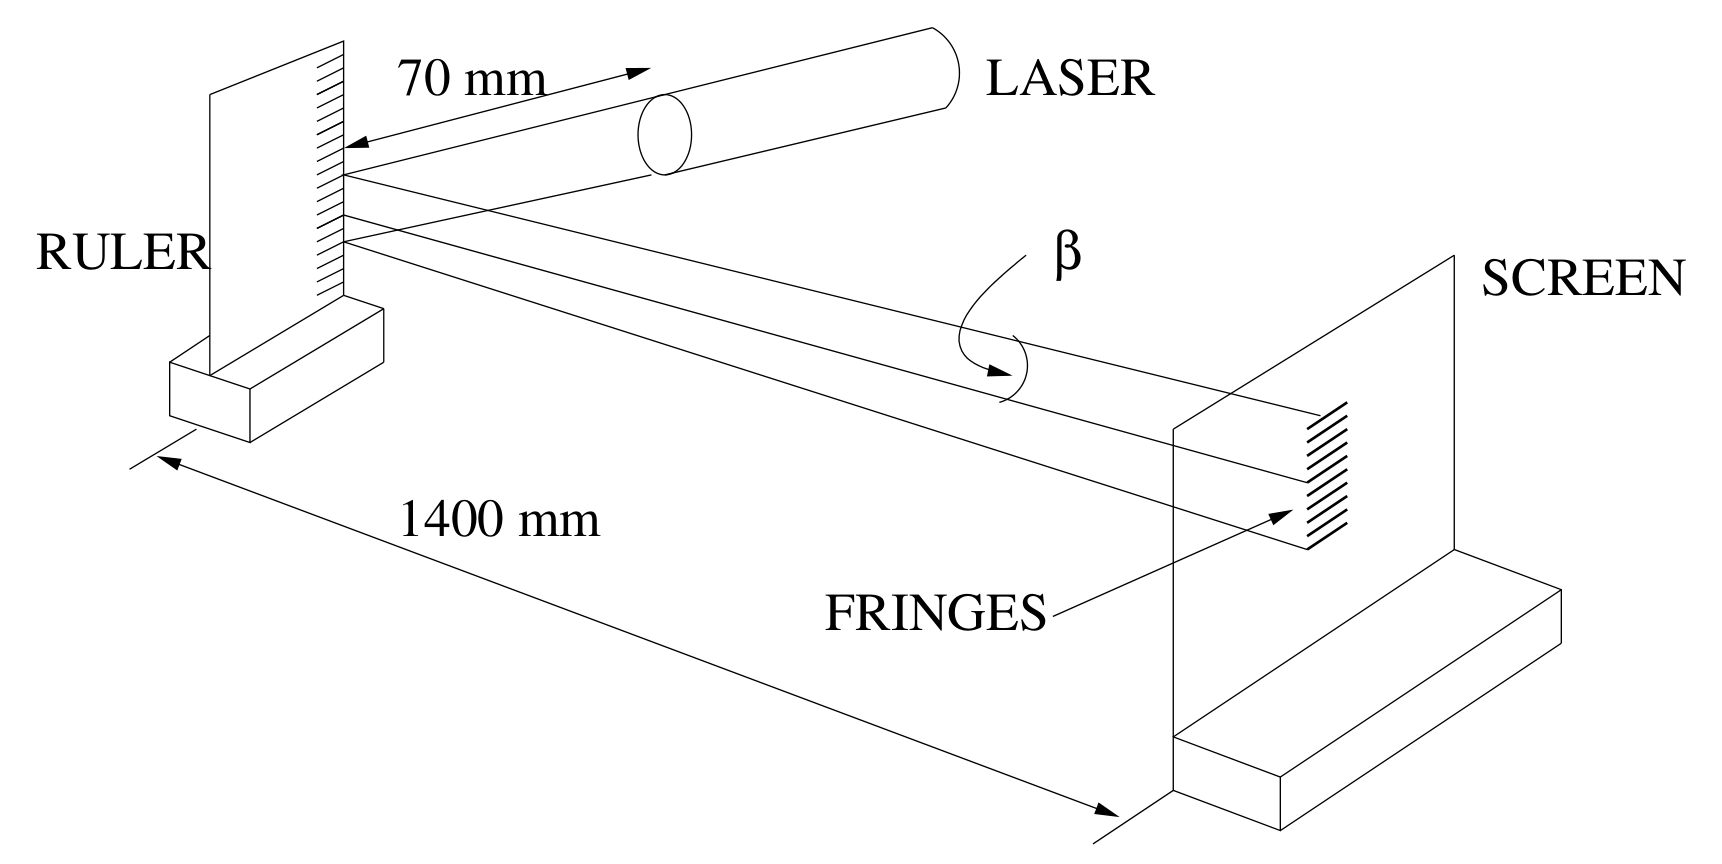
ii. Vis a vis the diffraction phenomenon,
The angle is measured using either a protractor (not recommended) or by measuring the value of the fringe separation on the screen, , for a given order .
If the separation between 20 orders is measured, then ( is central zero order).
The values of should be tabulated for . If students choose other orders, this is also acceptable.
| mm | 39.0 | 38.5 | 39.5 | 41.0 | 37.5 | 38.0 | 39.0 | 38.0 | 37.0 | 37.5 |
| mm | 19.5 | 19.25 | 19.75 | 20.5 | 18.75 | 19.0 | 19.5 | 19.0 | 18.5 | 18.75 |
Mean Value mm
i.e. Mean “spot” distance mm for order .
From observation of the ruler itself, the grating period, mm.
Thus in the relation
Since is small,
i.e. measured nm
The accepted value is 680 nm so that the departure from accepted value equals 1.5%.
Section 2
This section tests the student’s ability to make semi-quantitative measurements and the use of judgement in making observations.
i. Using the transmission disc, students should note that the transmission through the tank is greater than this value. Using a linear approximation, 75% could well be estimated. Using the hint about the eye’s logarithmic response, the transmission through the tank could be estimated to be as high as 85%.
Any figure for transmission between 75% and 85% is acceptable.
ii. Calculation of the transmission through the tank, using
for each of the four surfaces of the tank, and assuming for the perspex, results in a total transmission
Section 3
With water in the tank, surfaces 2 and 3 become perspex/water interfaces instead of perspex/air interfaces, as in (ii).
The resultant value is
Section 4
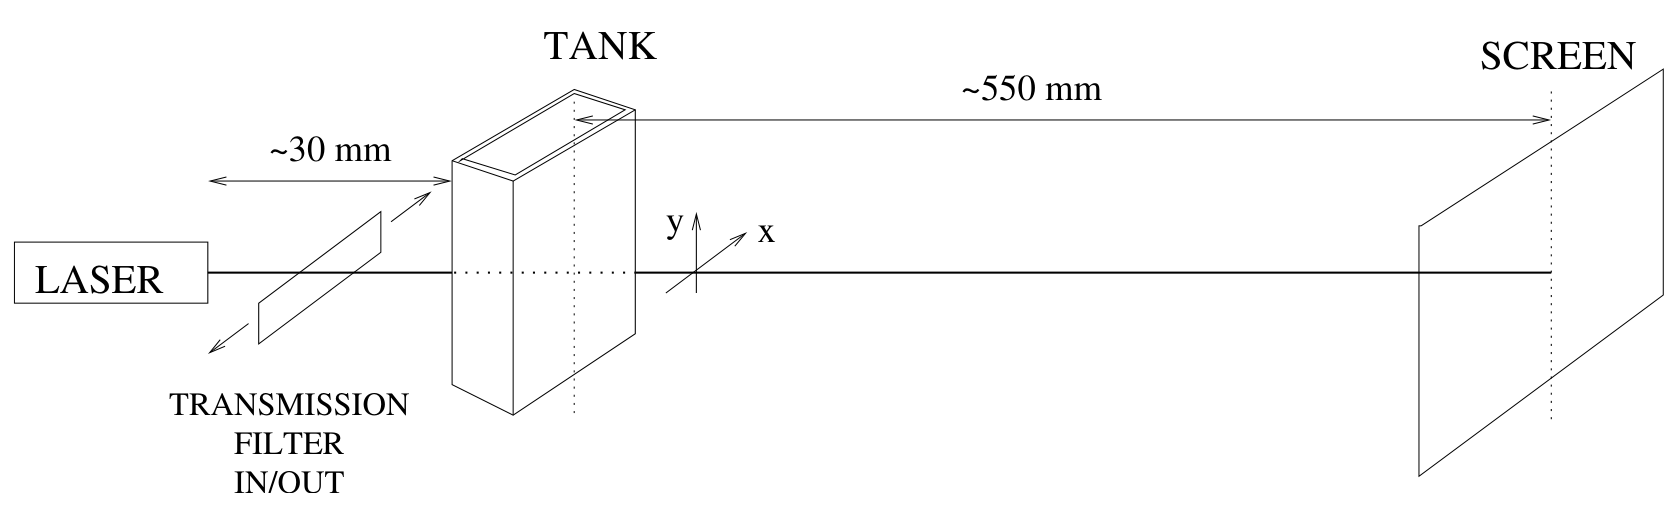
With pure water in the tank only, we see from Section 3 that the transmission is
The aim here is to determine the beam divergence (scatter) and transmission as a function of milk concentration. Looking down on the tank, one sees
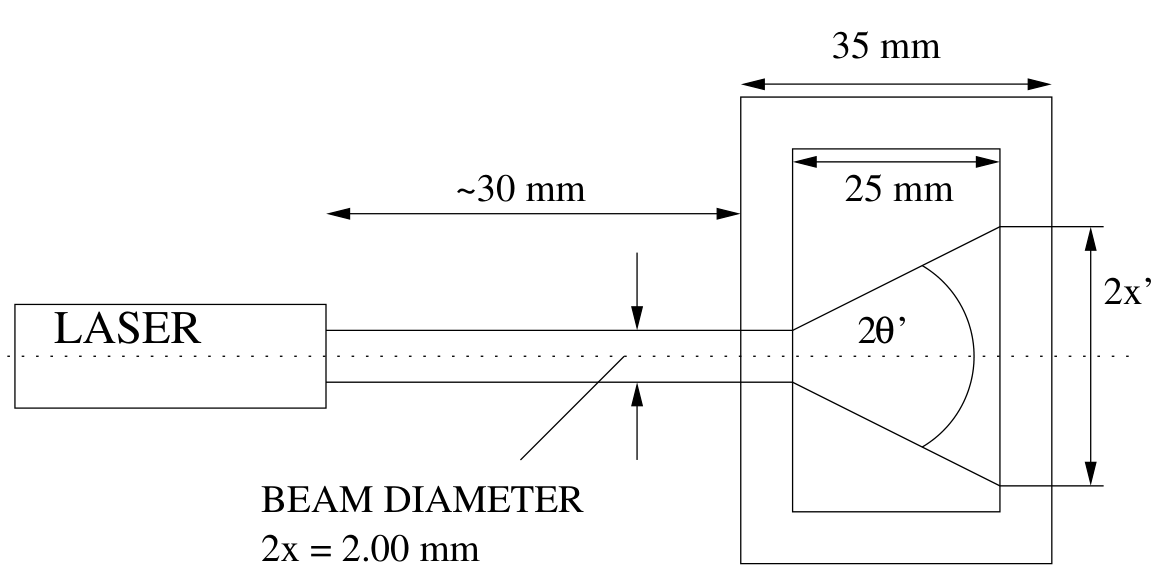
i. The entrance beam diameter is 2.00 mm. The following is an example of the calculations expected:
With 0.5 mL milk added to the 50 mL water, we find
Scattering angle
Transmission estimated with the assistance of the neutral density filters
Hence
Note that
If students miss the relationship (1), deduct one mark.
ii. & iii. One thus obtains the following table of results. can be determined as shown above, OR by looking down onto the tank and using the protractor to measure the value of . It is important to note that even in the presence of scattering, there is still a direct beam being transmitted. It is much stronger than the scattered radiation intensity, and some skill will be required in measuring the scattering angle using either method. Making the correct observations requires observational judgement on the part of the student.
Typical results are as follows:
| Milk volume (mL) | 0 | 0.5 | 1.0 | 1.5 | 2.0 | 2.5 | 3.0 | 3.5 | 4.0 |
|---|---|---|---|---|---|---|---|---|---|
| % Concentration | 0 | 1 | 2 | 3 | 4 | 5 | 6 | 7 | 8 |
| 2.00 | 2.2 | 6.2 | 9.4 | 12 | Protractor | ||||
| (Degrees) | 4 | 12 | 18 | 23 | 28 | 36 | 41 | 48 | |
| 1.0 | 0.79 | 0.45 | 0.22 | 0.15 | 0.12 | 0.08 | 0.06 | 0.05 |
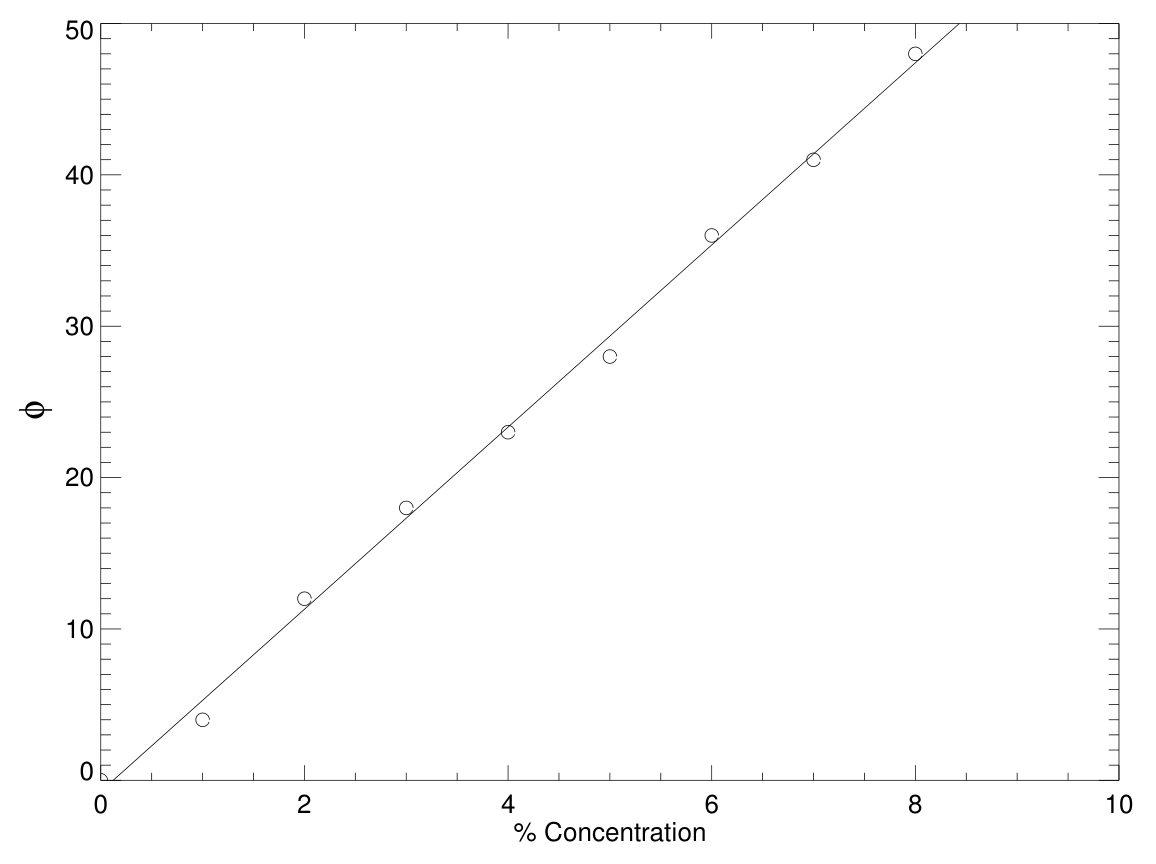
iii. From the graphed results in Figure 1, one obtains an approximately linear relationship between milk concentration, , and scattering angle, of the form
iv. Assuming the given relation
where is the distance into the tank containing milk/water.
We have
Thus
Hence .
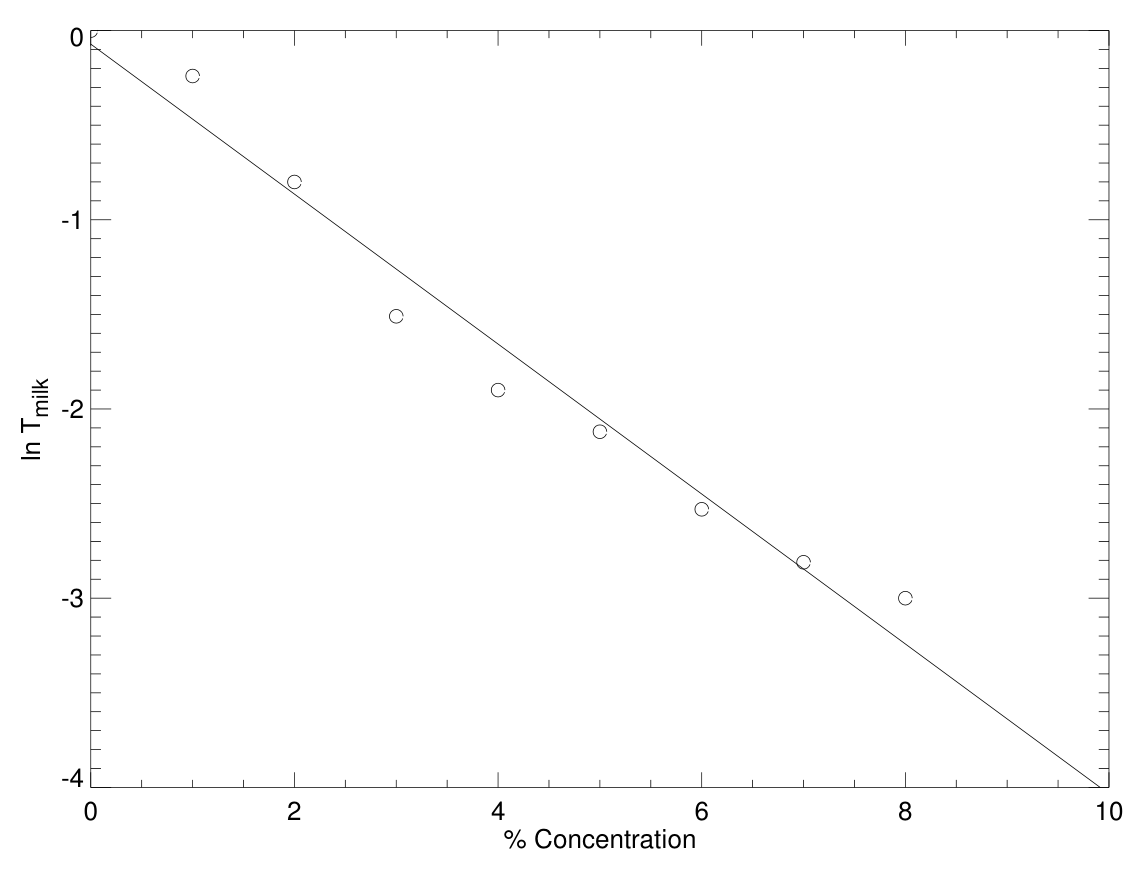
Since is a constant in this experiment, a plot of as a function of should yield a straight line. Typical data for such a plot are as follows:
| % Concentration | 0 | 1 | 2 | 3 | 4 | 5 | 6 | 7 | 8 |
|---|---|---|---|---|---|---|---|---|---|
| 1.0 | 0.79 | 0.45 | 0.22 | 0.15 | 0.12 | 0.08 | 0.06 | 0.05 | |
| 0 | -0.24 | -0.8 | -1.51 | -1.90 | -2.12 | -2.53 | -2.81 | -3.00 |
An approximately linear relationship is obtained, as shown in Figure 2, between and , the concentration viz.
Thus we can write
For the tank used, mm and thus
By extrapolation of the graph of versus concentration , one finds that for a scatterer concentration of 10%
Detailed Mark Allocation
Section 1
| A clear diagram illustrating geometry used with appropriate allocations | [1] |
| Optimal geometry used - as per model solution (laser close to ruler) | [1] |
| Multiple measurements made to ascertain errors involved | [1] |
| Correctly tabulated results | [1] |
| Sources of error including suggestion of ruler variation (suggested by non-ideal diffraction pattern) | [1] |
| Calculation of uncertainty | [1] |
| Final result | [2] |
| Allocated as per: | |
| (612, 748 nm) | [2] |
| (544, 816 nm) | [1] |
| anything worse | [0] |
Section 2
| For evidence of practical determination of transmission rather than simply “back calculating”. Practical range | [1] |
| For correct calculation of transmission (no more than 3 significant figures stated) | [1] |
Section 3
| Correct calculation with no more than 3 significant figures stated and an indication that the measurement was performed | [1] |
Section 4
| Illustrative diagram including viewing geometry used, i.e. horizontal/vertical | [1] |
| For recognizing the difference between scattered light and the straight-through beam | [1] |
| For taking the into account when calculating | [1] |
| Correctly calculated and tabulated results of with results within 20% of model solution | [1] |
| Using a graphical technique for determining the relationship between scatter angle and milk concentration | [1] |
| Using a graphical technique to extrapolate to 10% concentration | [1] |
| Final result for | [2] |
| Allocated as [2], [1], anything worse [0] | |
| A reasonable attempt to consider uncertainties | [1] |
| TOTAL | 20 |
Оригинал в Архива: exp2.pdf · официални решения: exp2_sol.pdf