IPhO 2000, Експеримент — Задача 1. CDROM SPECTROMETER
31st International Physics Olympiad, Leicester, U.K. — Experimental Competition, Wednesday, July 12th, 2000 · 12 юли 2000 г.
Please read this first:
- The time available is 2 ½ hours for each of the 2 experimental questions. Answers for your first question will be collected after 2 ½ hours.
- Use only the pen issued in your back pack.
- Use only the front side of the sheets of paper provided. Do not use the side marked with a cross.
- Each question should be answered on separate sheets of paper.
- For each question, in addition to the blank writing sheets where you may write, there is an answer sheet where you must summarise the results you have obtained. Numerical results should be written with as many digits as are appropriate to the given data. Do not forget to state the units
- Write on the blank sheets of paper the results of all your measurements and whatever else you consider is required for the solution of the question and that you wish to be marked. However you should use mainly equations, numbers, symbols, graphs and diagrams. Please use as little text as possible.
- It is absolutely essential that you enter in the boxes at the top of each sheet of paper used your Country and your student number (Student No.). In addition, on the blank sheets of paper used for each question, you should enter the number of the question (Question No.), the progressive number of each sheet (Page No.) and the total number of blank sheets that you have used and wish to be marked for each question (Total No. of pages). It is also helpful to write the question number and the section label of the part you are answering at the beginning of each sheet of writing paper. If you use some blank sheets of paper for notes that you do not wish to be marked, put a large cross through the whole sheet and do not include it in your numbering.
- When you have finished, arrange all sheets in proper order (for each question put answer sheets first, then used sheets in order, followed by the sheets you do not wish to be marked. Put unused sheets and the printed question at the bottom). Place the papers for each question inside the envelope labelled with the appropriate question number, and leave everything on your desk. You are not allowed to take any sheets of paper out of the room.
Условие
In this experiment, you are NOT expected to indicate uncertainties in your measurements.
The aim is to produce a graph showing how the conductance* of a light-dependent resistor (LDR) varies with wavelength across the visible spectrum.
*conductance = 1/resistance (units: siemens, )
There are five parts to this experiment:
- Using a concave reflection grating (made from a strip of CDROM) to produce a focused first order spectrum of the light from bulb A (12 V 50W tungsten filament).
- Measuring and plotting the conductance of the LDR against wavelength as it is scanned through this first order spectrum.
- Showing that the filament in bulb A behaves approximately as an ideal black body.
- Finding the temperature of the filament in bulb A when it is connected to the 12 V supply.
- Correcting the graph of conductance against wavelength to take account of the energy distribution within the spectrum of light emitted by bulb A.
Precautions
- Beware of hot surfaces.
- Bulb B should not be connected to any potential difference greater than 2.0 V.
- Do not use the multimeter on its resistance settings in any live circuit.
Procedure
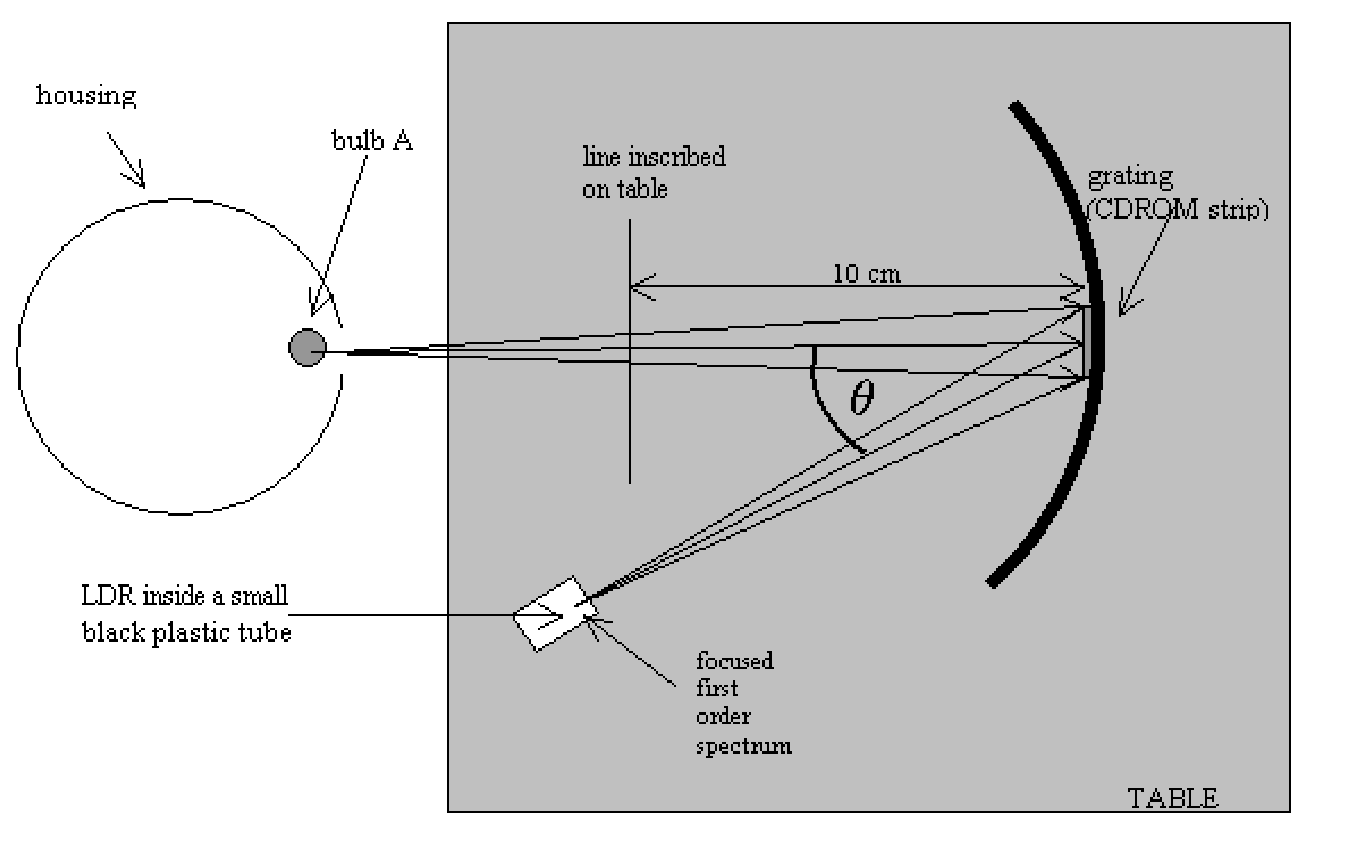
(a) The apparatus shown in Figure 1 has been set up so that light from bulb A falls normally on the curved grating and the LDR has been positioned in the focused first order spectrum. Move the LDR through this first-order spectrum and observe how its resistance (measured by multimeter X) changes with position.
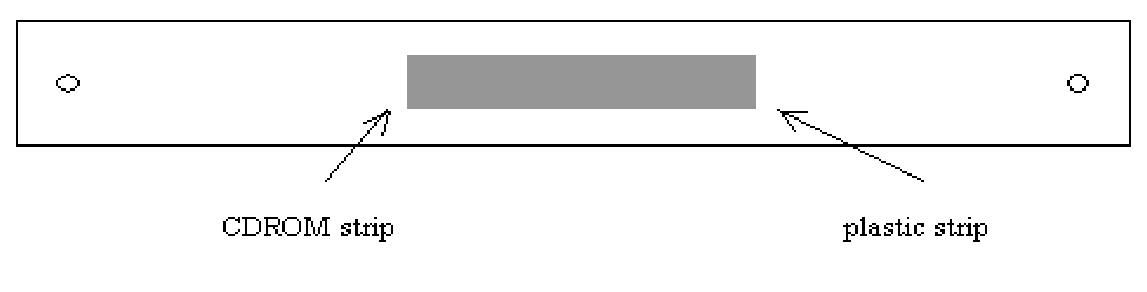
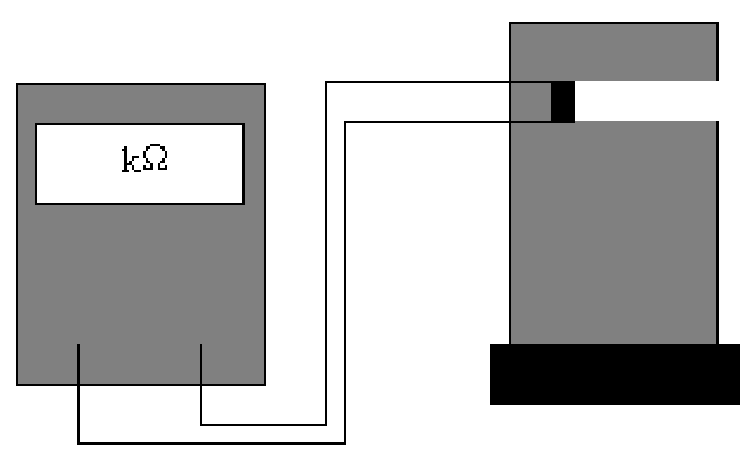
(b) (i) Measure and record the resistance of the LDR at different positions within this first-order spectrum. Record your data in the blank table provided.
(ii) Plot a graph of the conductance of the LDR against wavelength using the graph paper provided.
Note The angle between the direction of light of wavelength in the first-order spectrum and that of the white light reflected from the grating (see Figure 1) is given by:
where is the separation of lines in the grating.
The grating has 620 lines per mm.
The graph plotted in (b)(ii) does not represent the sensitivity of the LDR to different wavelengths correctly as the emission characteristics of bulb A have not been taken into account. These characteristics are investigated in parts (c) and (d) leading to a corrected curve plotted in part (e).
- Note for part (c) that three multimeters are connected as ammeters. These should NOT be adjusted or moved. Use the fourth multimeter (labelled X) for all voltage measurements.
(c) If the filament of a 50 W bulb acts as a black-body radiator it can be shown that the potential difference across it should be related to the current through it by the expression:
Measure corresponding values of and for bulb A (in the can). The ammeter is already connected and should not be adjusted.
(i) Record your data and any calculated values in the table provided on the answer sheet.
(ii) Plot a suitable graph to show that the filament acts as a black-body radiator on the graph paper provided.
(d) To correct the graph in (b)(ii) we need to know the working temperature of the tungsten filament in bulb A. This can be found from the variation of filament resistance with temperature.
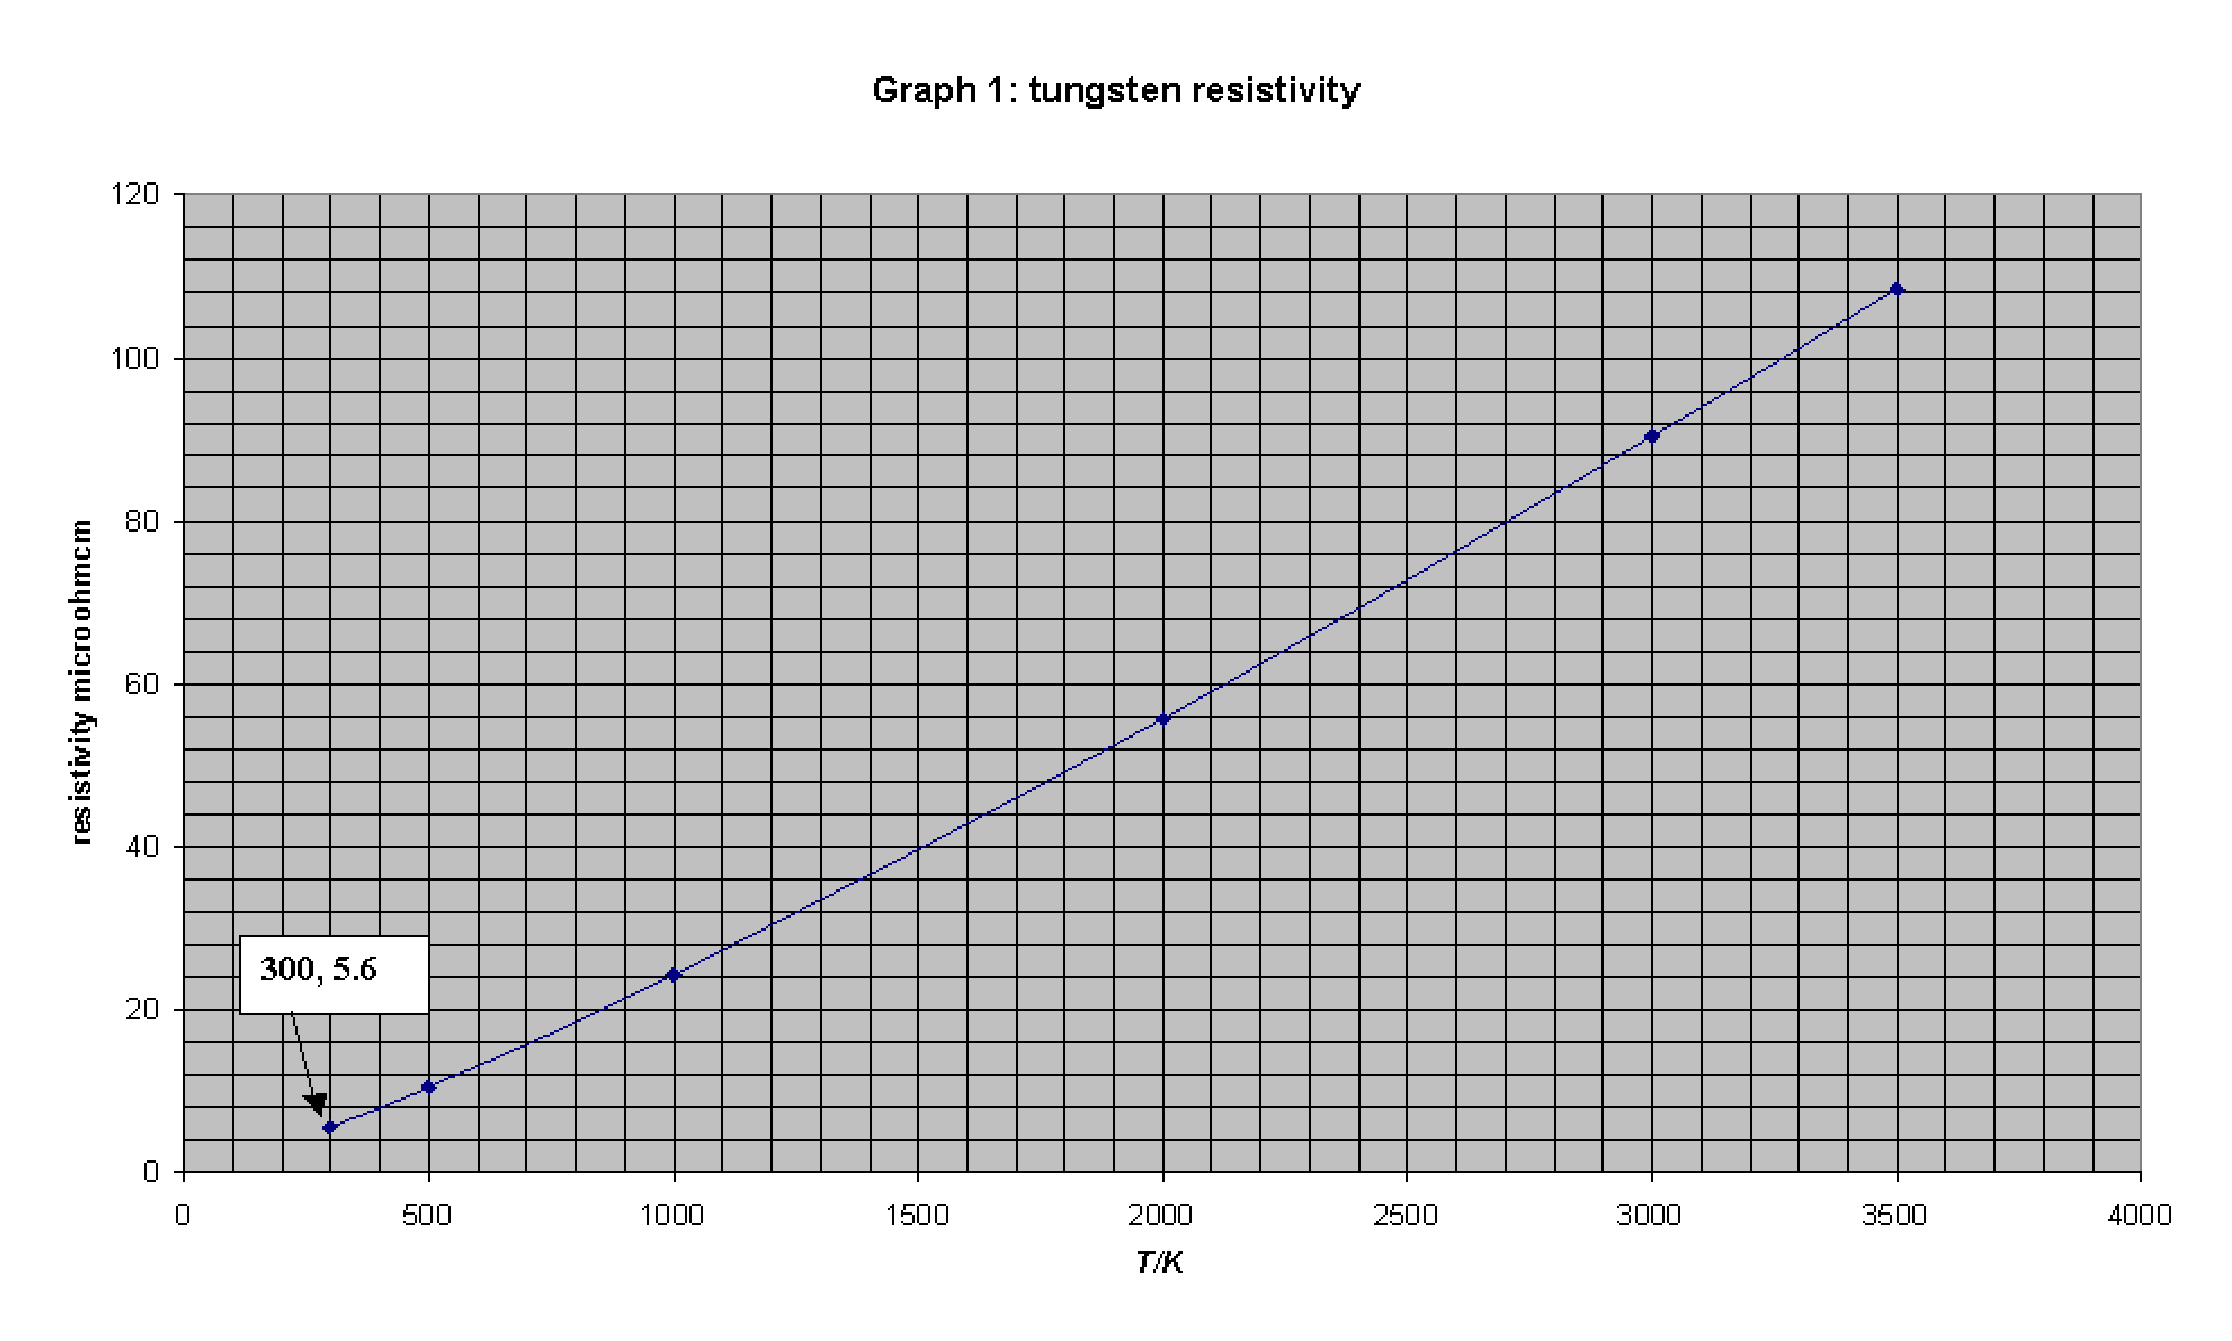
- You are provided with a graph of tungsten resistivity () against temperature (K).
If the resistance of the filament in bulb A can be found at a known temperature then its temperature when run from the 12 V supply can be found from its resistance at that operating potential difference. Unfortunately its resistance at room temperature is too small to be measured accurately with this apparatus. However, you are provided with a second smaller bulb, C, which has a larger, measurable resistance at room temperature. Bulb C can be used as an intermediary by following the procedure described below. You are also provided with a second 12V 50W bulb (B) identical to bulb A. Bulbs B and C are mounted on the board provided and connected as shown in Figure 2.
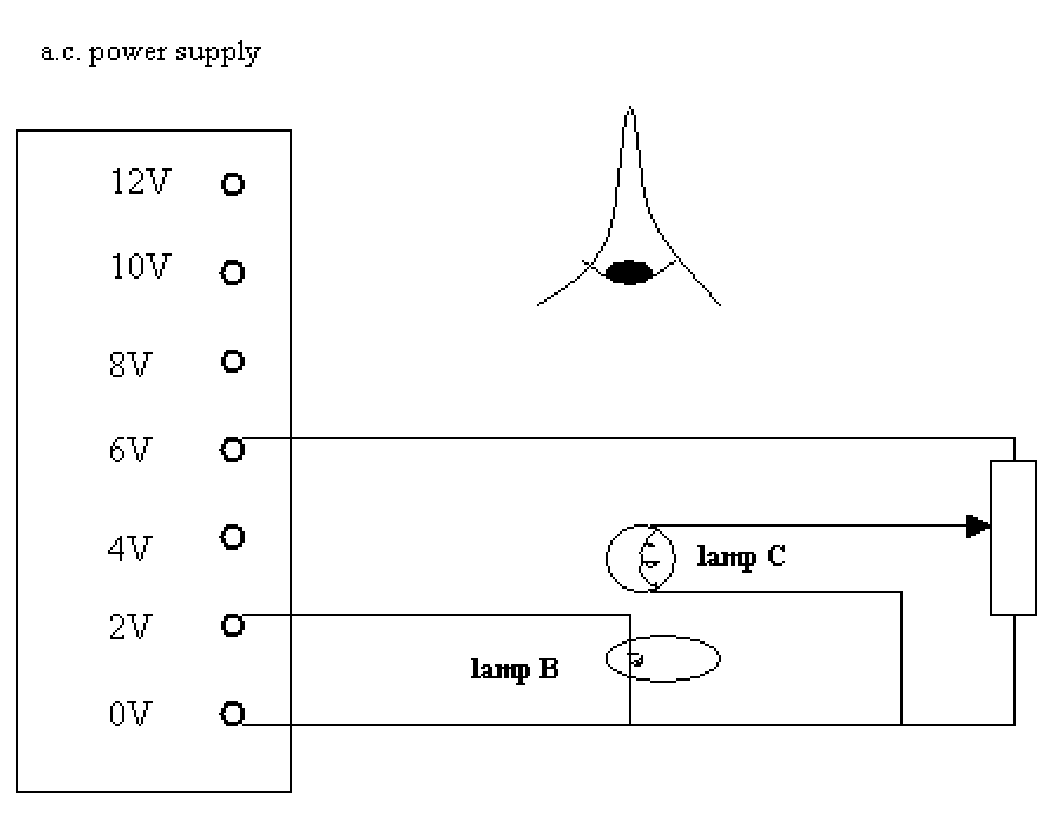
(i) Measure the resistance of bulb C when it is unlit at room temperature (use multimeter X, and take room temperature to be 300 K). Record this resistance on the answer sheet.
i. Use the circuit shown in Figure 2 to compare the filaments of bulbs B and C. Use the variable resistor to vary the current through bulb C until you can see that overlapping filaments are at the same temperature. If the small filament is cooler than the larger one it appears as a thin black loop. Measure the resistances of bulbs B and C when this condition has been reached and record their values, and , on the answer sheet. Remember, the ammeters are already connected.
(iii) Use the graph of resistivity against temperature (supplied) to work out the temperature of the filaments of B and C when they are matched. Record this temperature, , on the answer sheet.
(iv) Measure the resistance of the filament in bulb A (in the can) when it is connected to the 12 V a.c. supply. Once again the ammeter is already connected and should not be adjusted. Record this value, on the answer sheet.
(v) Use the values for the resistance of bulb A at 2 V and 12 V and its temperature at 2 V to work out its temperature when run from the 12 V supply. Record this temperature, in the table on the answer sheet.
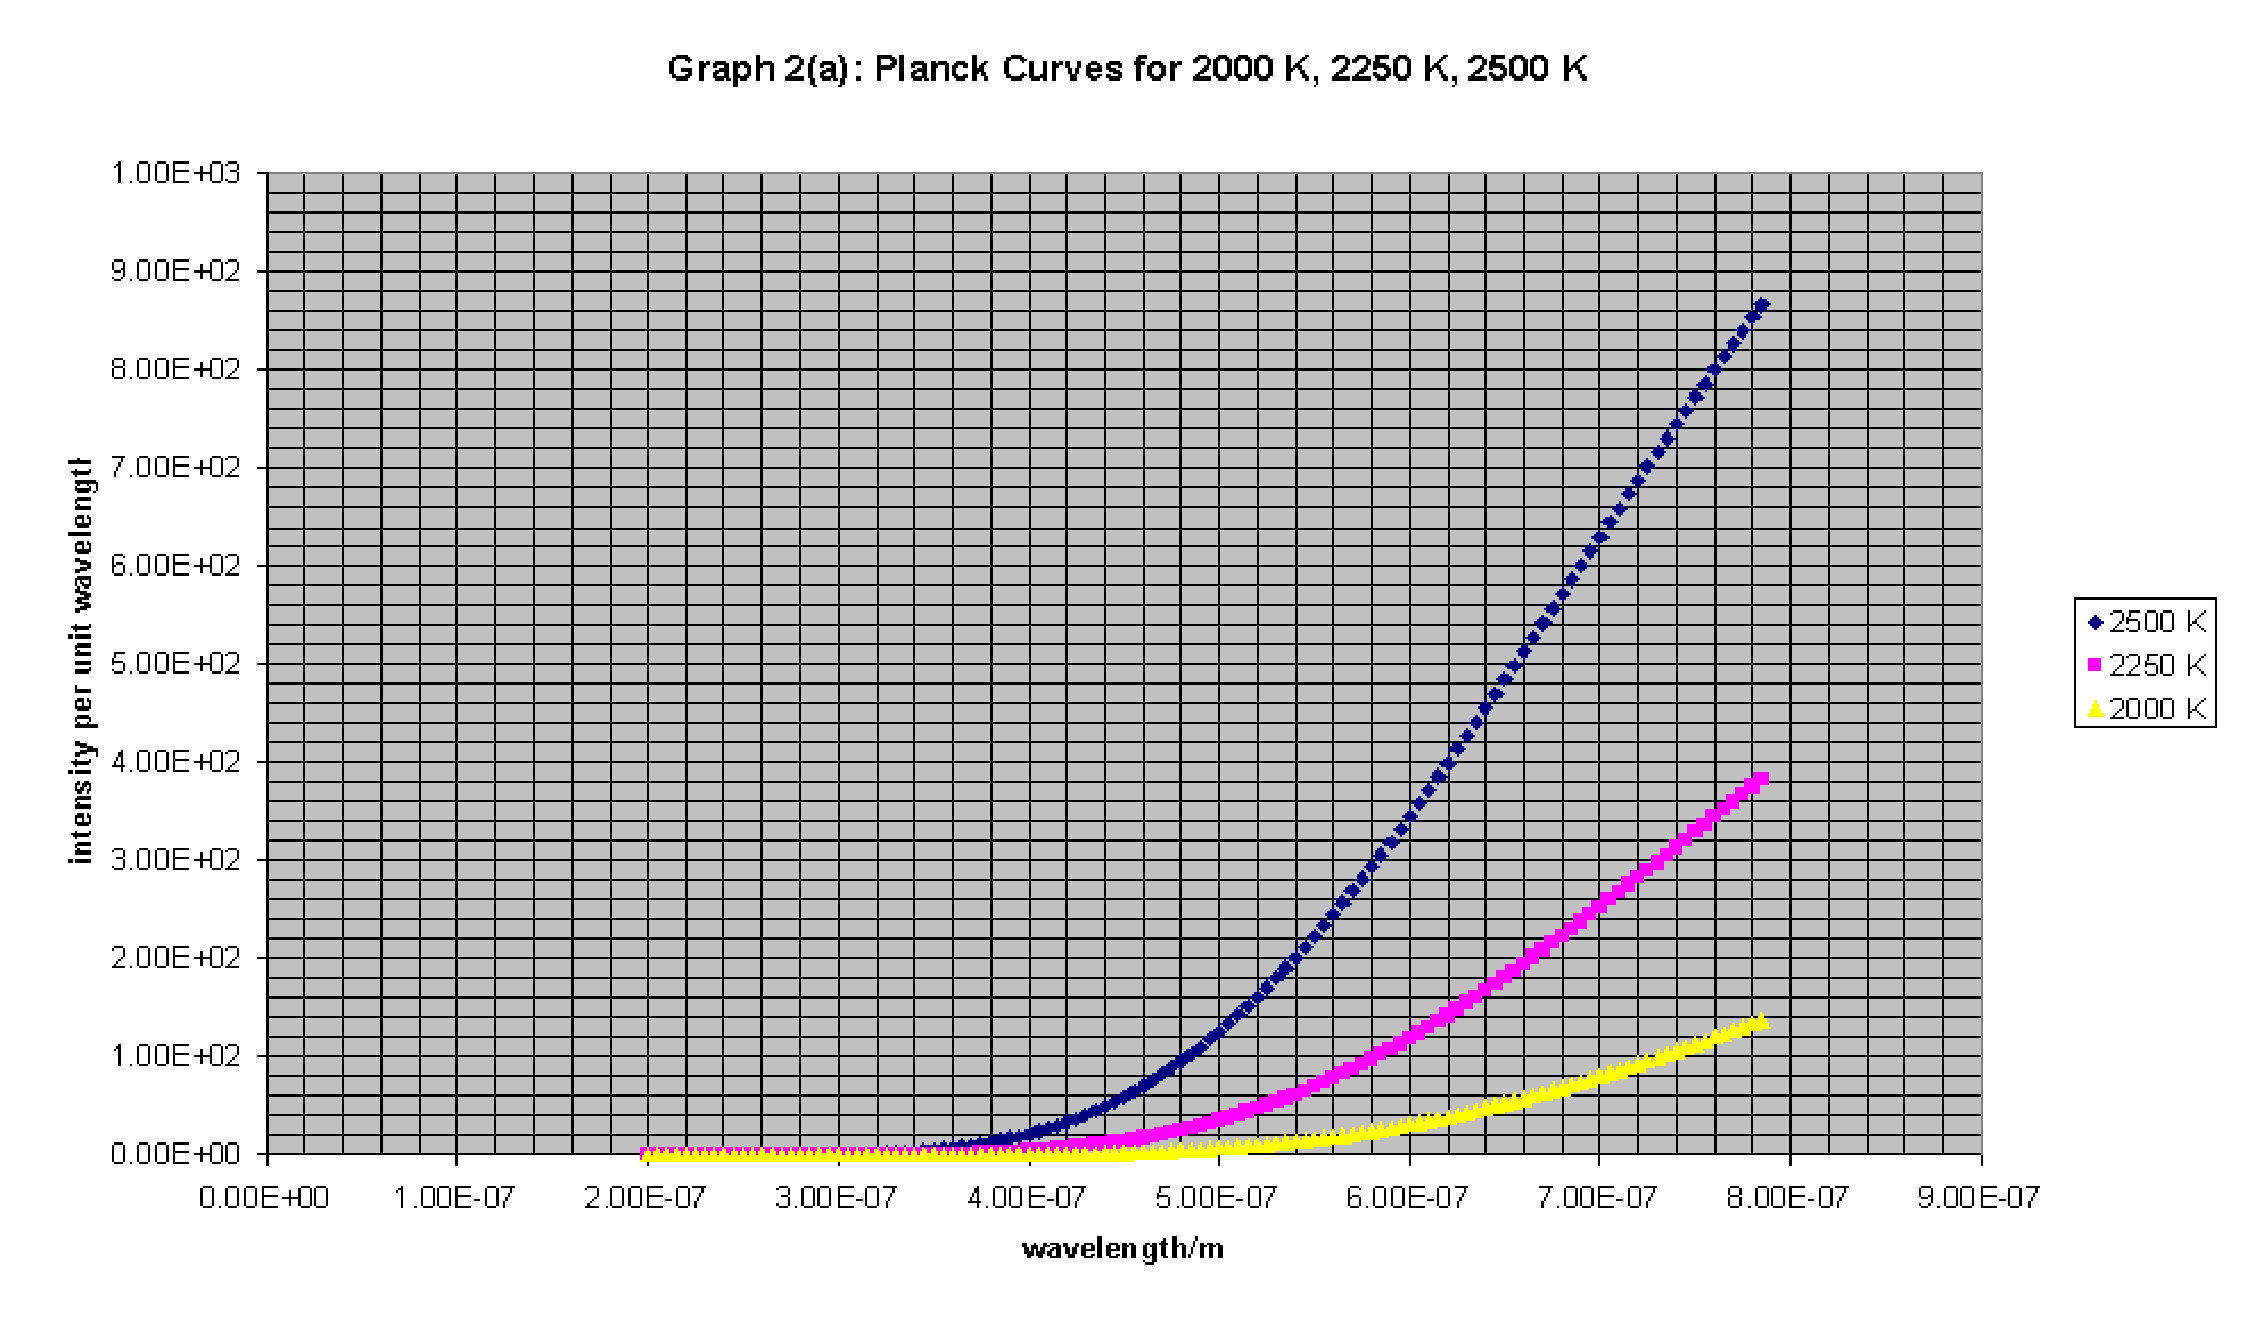
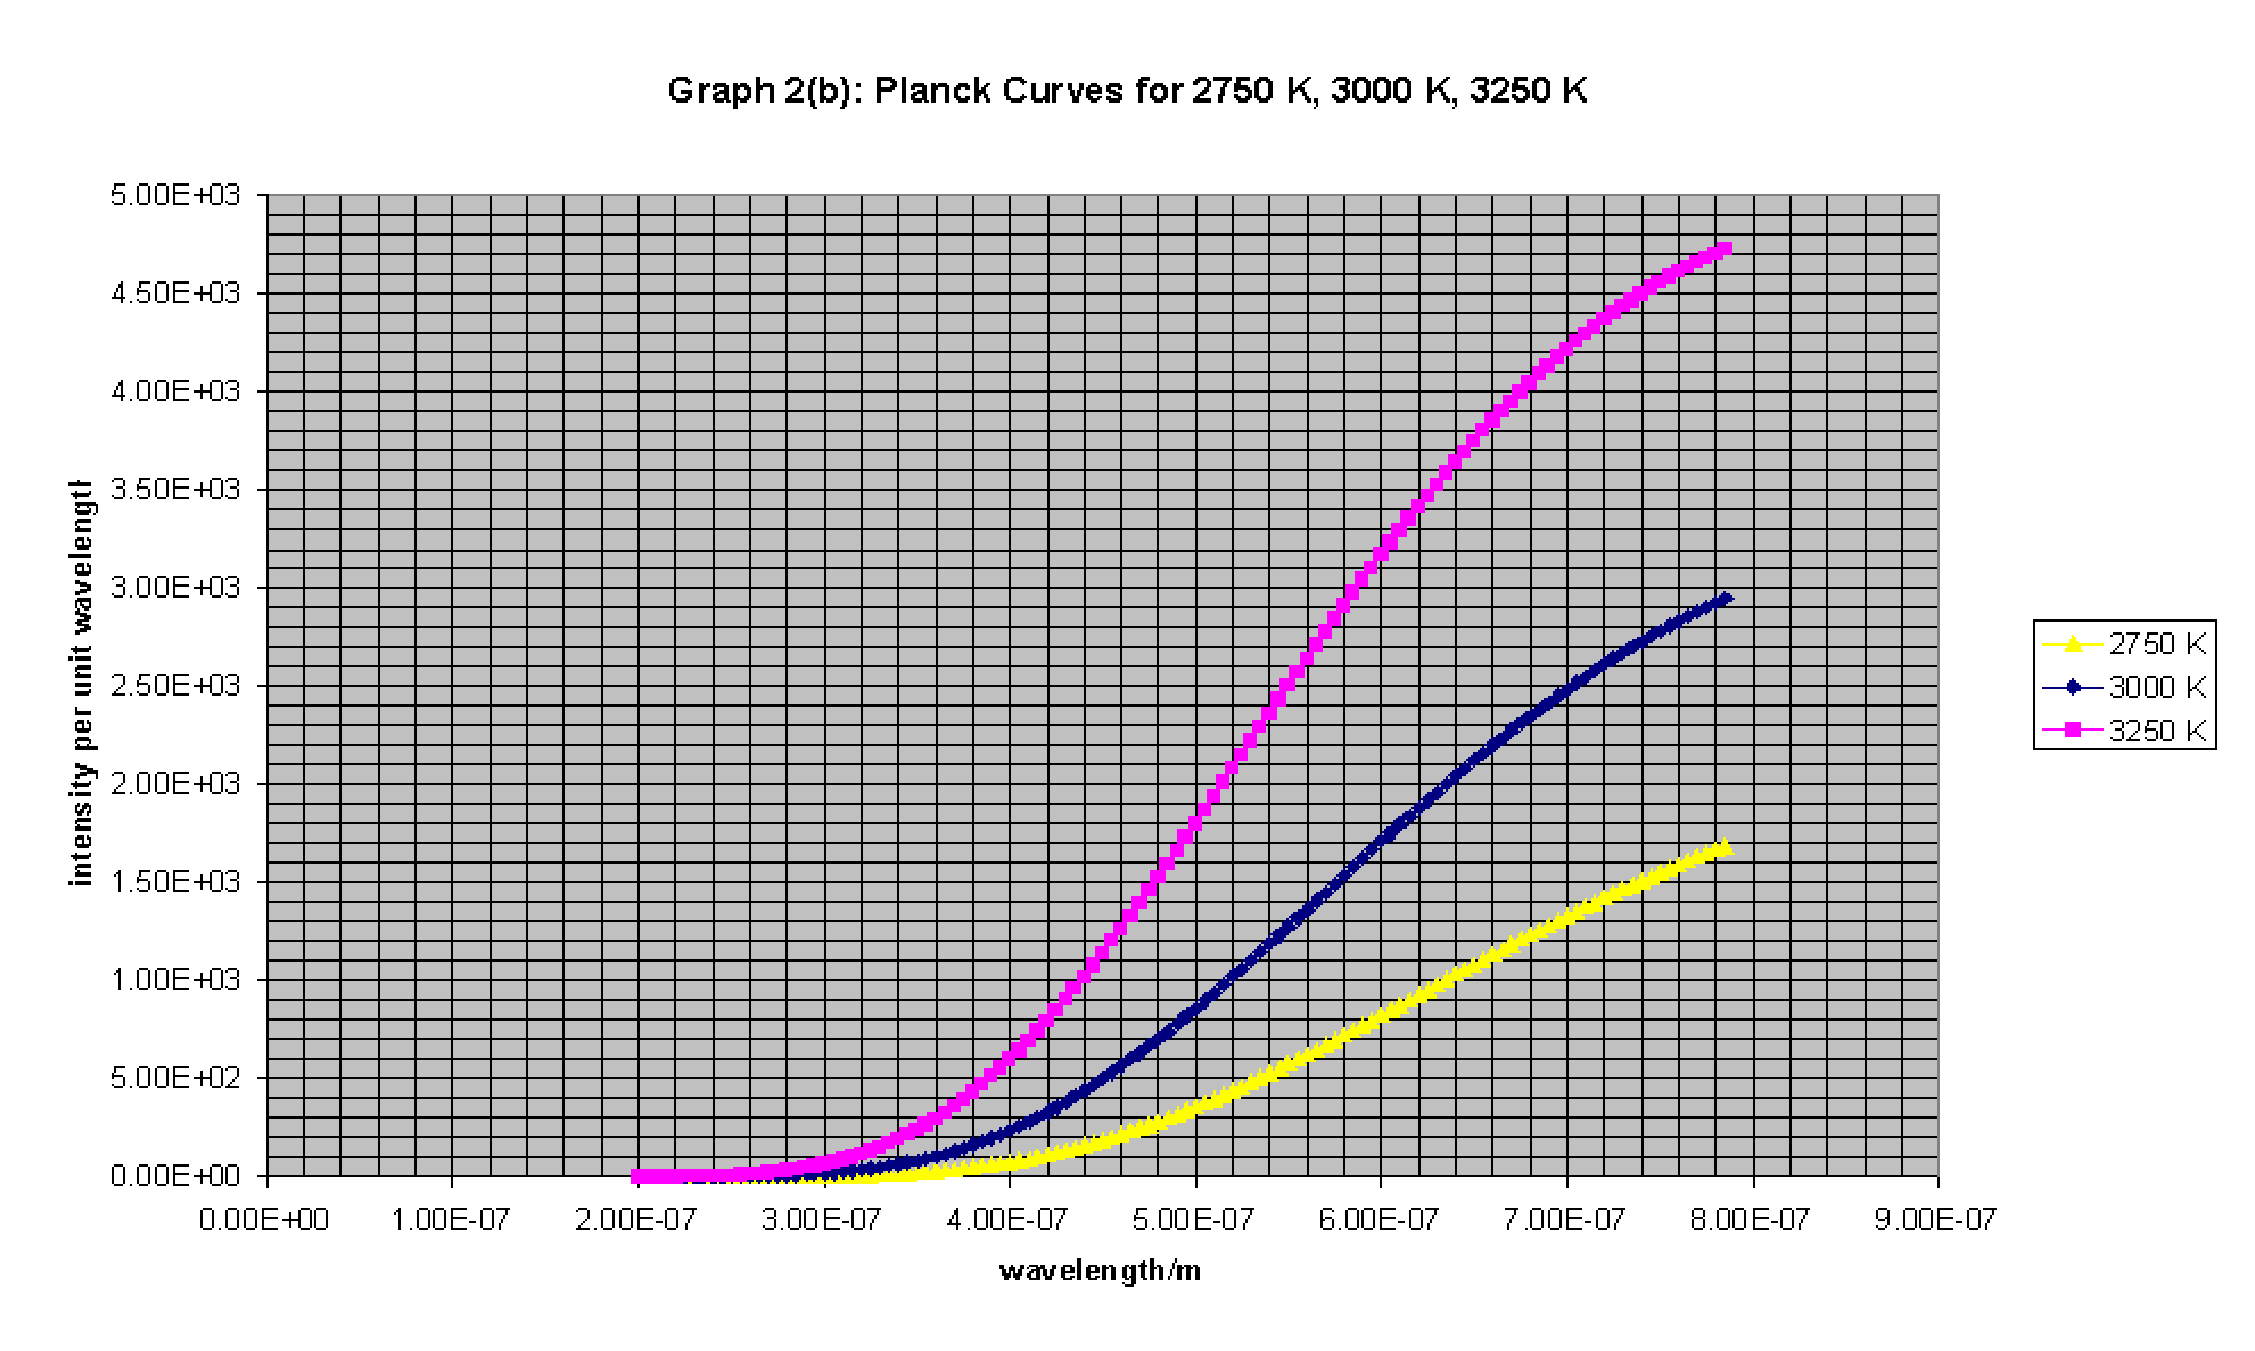
- You are provided with graphs that give the relative intensity of radiation from a black-body radiator (Planck curves) at 2000 K, 2250 K, 2500 K, 2750 K, 3000 K and 3250 K.
(e) Use these graphs and the result from (d)(v) to plot a corrected graph of LDR conductance (arbitrary units) versus wavelength using the graph paper provided. Assume that the conductance of the LDR at any wavelength is directly proportional to the intensity of radiation at that wavelength (This assumption is reasonable at the low intensities falling on the LDR in this experiment). Assume also that the grating diffracts light equally to all parts of the first order spectrum.
Решение
Внимание: Непълно решение
В архива няма официално решение на тази задача.
Оригинал в Архива: E1.pdf