IPhO 2003, Експеримент — Задача 2. Part B Optical Properties of Nematic Liquid Crystal : Electro-optical switching characteristic of 90° TN LC cell
The 34th International Physics Olympiad — Taipei, Taiwan — Experimental Competition — Wednesday, August 6, 2003 · 6 август 2003 г. · 7,5 т.
Please Read This First:
- Use only the pen provided.
- Use only the front side of the answer sheets and paper.
- In your answers please use as little text as possible; express yourself primarily in equations, numbers and figures. If the required result is a numerical number, underline your final result with a wavy line.
- Write on the blank sheets of paper the results of your measurements and whatever else you consider is required for the solution of the question and that you wish to be marked.
- It is absolutely essential that you enter in the boxes at the top of each sheet of paper used your Country and your student number [Student No.]. In addition, on the blank sheets of paper used for each question, you should enter the question number [Question No. : e.g. A-(1)], the progressive number of each sheet [Page No.] and the total number of blank sheets that you have used and wish to be marked for each question [Total No. of pages]. If you use some blank sheets of paper for notes that you do not wish to be marked, put a large cross through the whole sheet and do not include them in your numbering.
- At the end of the exam please put your answer sheets and graphs in order.
- Error bars on graphs are only needed in part A of the experiment.
- Caution: Do not look directly into the laser beam. You can damage your eyes!!
Условие
I. Introduction
- Liquid Crystal
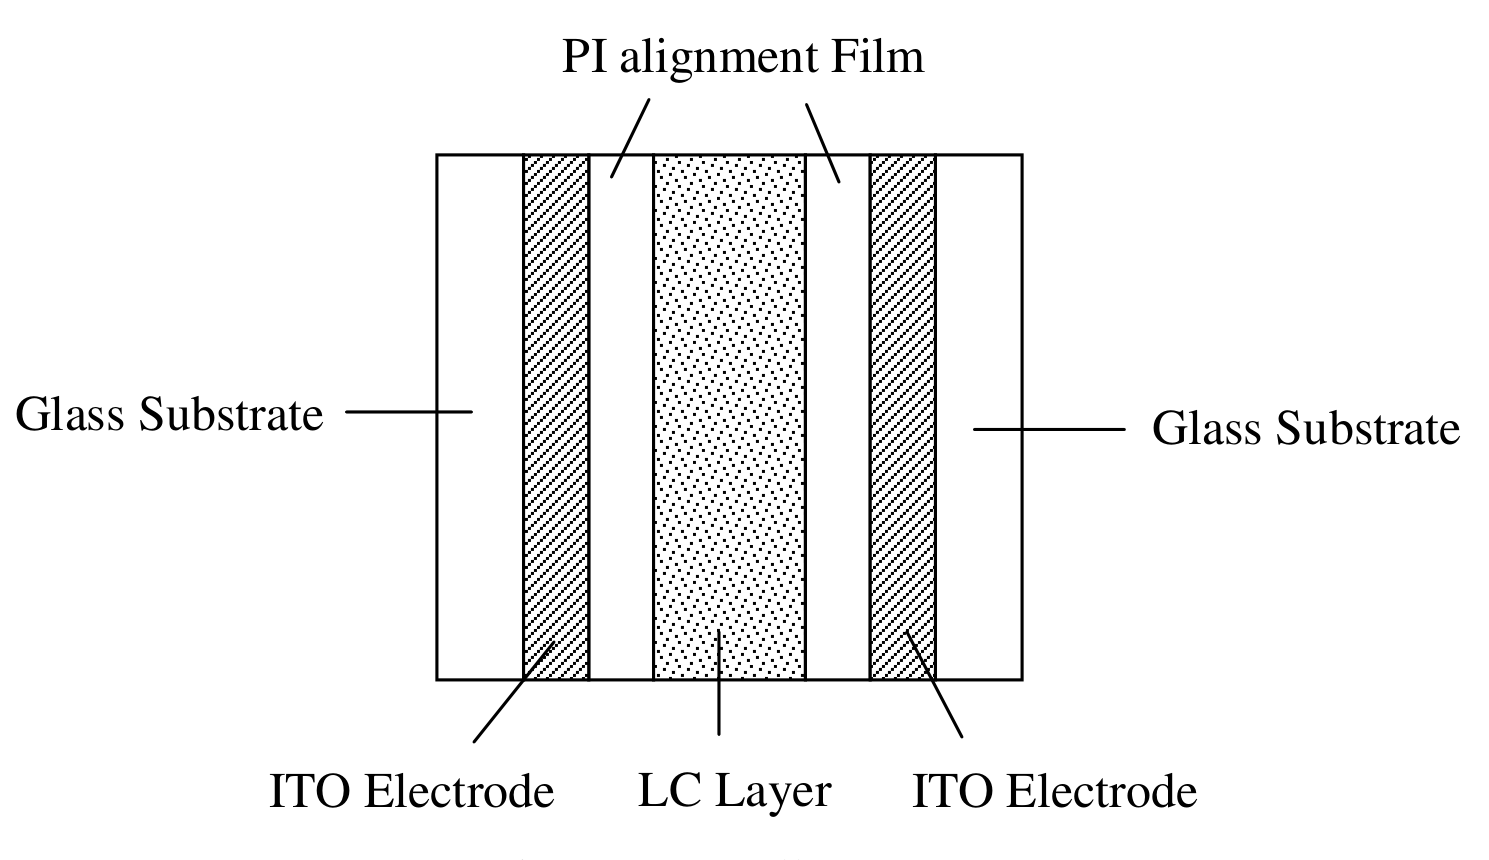
Liquid crystal (LC) is a state of matter that is intermediate between the crystalline solid and the amorphous liquid. The nematic LCs are organic compounds consist of long-shaped needle-like molecules. The orientation of the molecules can be easily aligned and controlled by applying an electrical field. Uniform or well prescribed orientation of the LC molecules is required in most LC devices. The structure of the LC cell used in this experiment is shown in Fig 7. Rubbing the polyimide film can produce a well-aligned preferred orientation for LC molecules on substrate surfaces, thus due to the molecular interaction the whole slab of LC can achieve uniform molecular orientation. The local molecular orientation is called the director of LC at that point.
The LC cell exhibits the so-called double refraction phenomenon with two principal refractive indices. When light propagates along the direction of the director, all polarization components travel with the same speed , where is called the ordinary index of refraction. This propagation direction (direction of the director) is called the optic axis of the LC cell. When a light beam propagates in the direction perpendicular to the optic axis, in general, there are two speeds of propagation. The electric field of the light polarized perpendicular (or parallel) to the optic axis travels with the speed of (or , where is called the extraordinary index of refraction). The birefringence (optical anisotropy) is defined as the difference between the extraordinary and the ordinary indices of refraction .
- Twisted Nematic LC Cell
In the twisted nematic (TN) cell shown in Fig. 8, the LC director of the back surface is twisted with respect to the front surface. The front local director is set parallel to the transmission axis of the polarizer. An incident unpolarized light is converted into a linearly polarized light by the front polarizer.
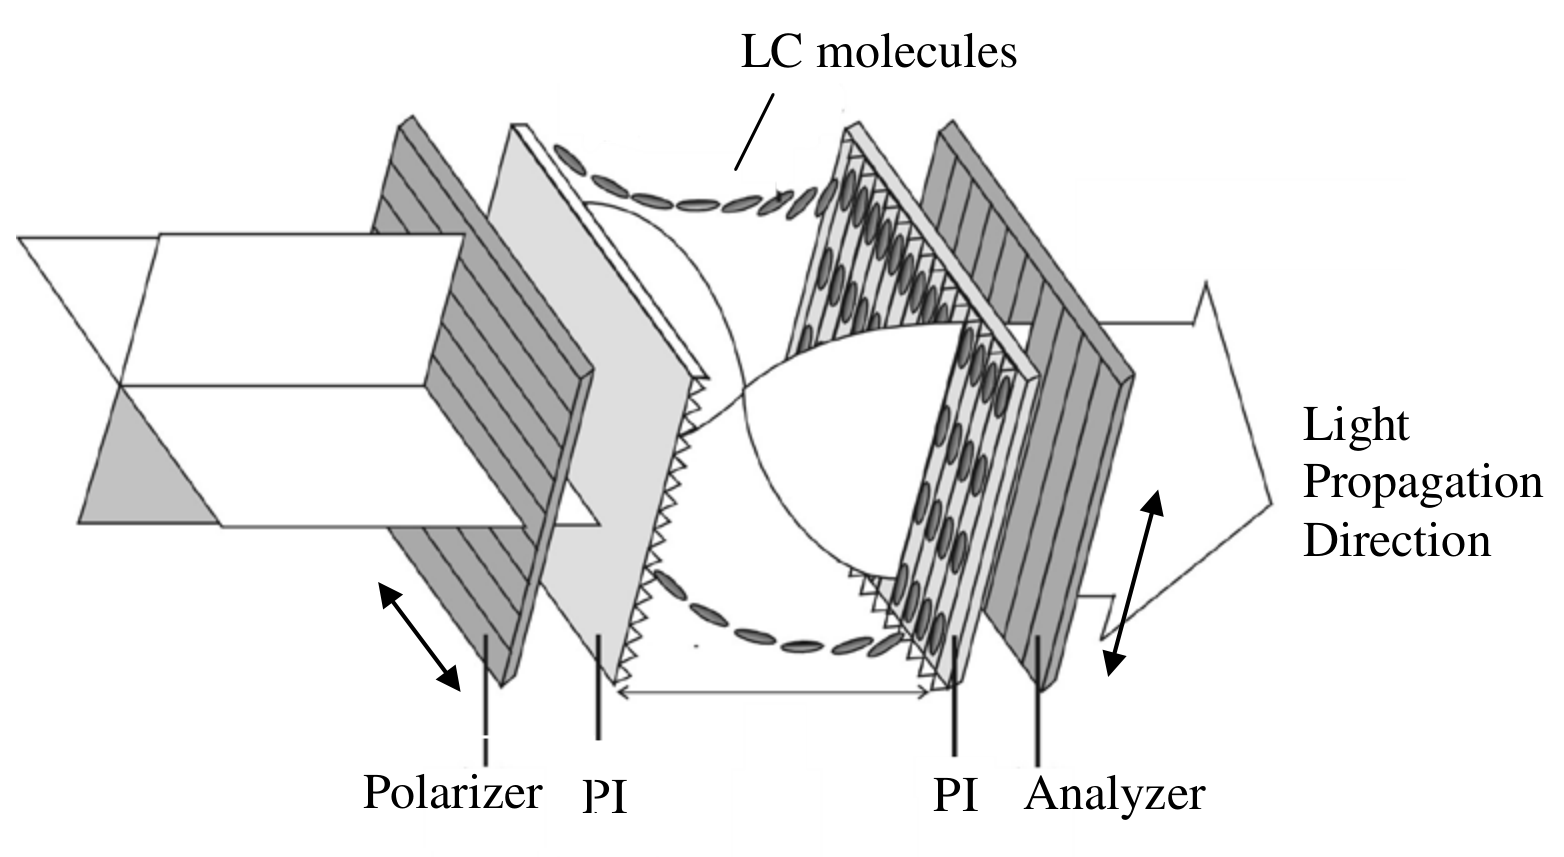
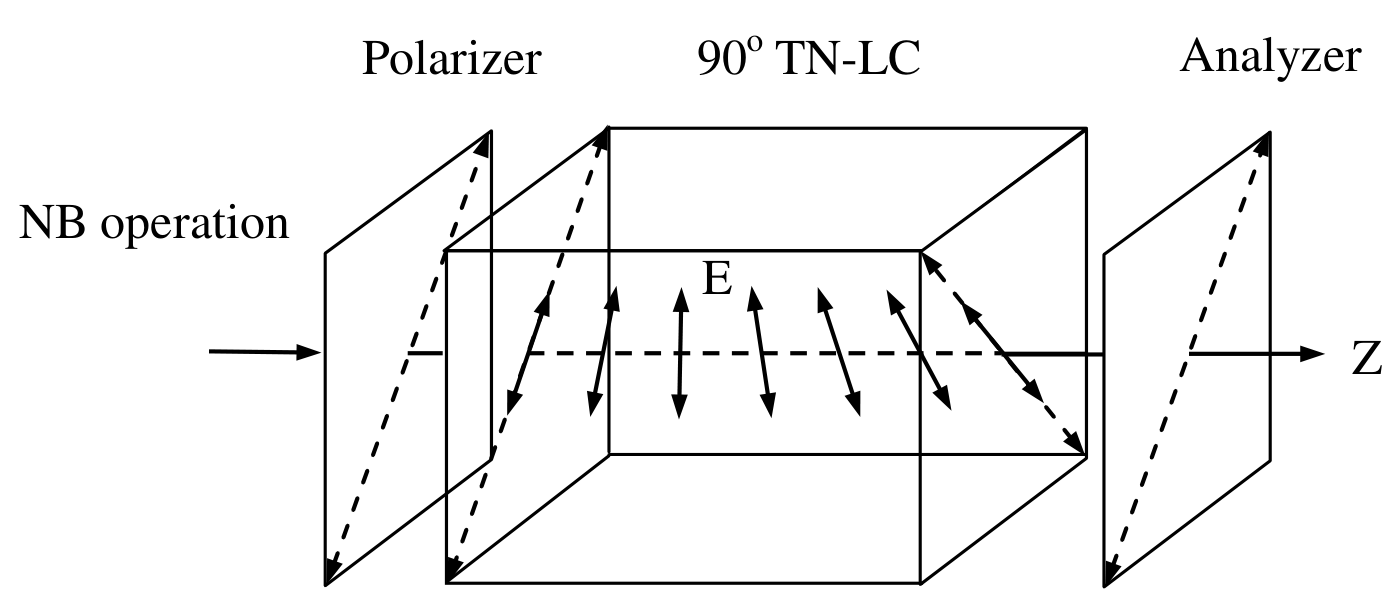
When a linearly polarized light traverses through a TN cell, its polarization follows the twist of the LC directors (polarized light sees only) so that the output beam remains linearly polarized except for that its polarization axis is rotated by (it’s called the polarizing rotary effect by ; similarly we can also find polarizing rotary effect by ). Thus, for a normally black (NB) mode using a TN cell, the analyzer’s (a second polarizer) transmission axis is set to be parallel to the polarizer’s transmission axis, as shown in Fig. 9. However, when the applied voltage V across the LC cell exceeds a critical value , the director of LC molecules tends to align along the direction of applied external electrical field which is in the direction of the propagation of light. Hence, the polarization guiding effect of the LC cell is gradually diminishing and the light leaks through the analyzer. Its electro-optical switching slope is defined as , where and are the applied voltages enabling output light signal reaches up to 10% and 90% of its maximum light intensity, respectively.
II. Experiments and procedures
- Setup a NB TN LC mode between two polarizers with parallel transmission axes and apply 100 Hz square wave voltage using a function generator onto the ITO portions of two glass substrates and vary the applied voltage () from 0 to 7.2 Volts.
* In the crucial turning points, take more data if necessary.
B-(1) Measure, tabulate, and plot the electro-optical switching curve ( vs. curve) of the NB TN LC, and find its switching slope , where is defined as . [5 т.]
B-(2) Determine the critical voltage of this NB TN LC cell. Show explicitly with graph how you determine the value .
Hint:* When the external applied voltage exceeds the critical voltage, the light transmission increases rapidly and abruptly. [2,5 т.]
Отговори
B-(1) γ ± Δγ = (0.42 ~ 0.44) ± 0.02
Accepted range from the official marking scheme.
B-(2) VC ± ΔVC = (1.20 ~ 1.50) ± 0.01 Volts
Accepted range from the official solution.
Решение
Part B: Optical Properties of Nematic Liquid Crystal
Electro-optical switching characteristic of TN LC cell
Question B-(1) (5.0 points)
Measure, tabulate, and plot the electro-optical switching curve ( vs. curve) of the NB TN LC, and find its switching slope , where is defined as .
a. Proper data table marked with variables and units. (0.3 pts)
| Applied voltage (Volts) | Light intensity (Volts) | Applied voltage (Volts) | Light intensity (Volts) |
|---|---|---|---|
| 0.00 | 0.00 | 2.44 | 1.22 |
| 0.10 | 0.00 | 2.50 | 1.26 |
| 0.20 | 0.00 | 2.55 | 1.27 |
| 0.30 | 0.00 | 2.60 | 1.29 |
| 0.40 | 0.00 | 2.67 | 1.32 |
| 0.50 | 0.00 | 2.72 | 1.33 |
| 0.60 | 0.00 | 2.85 | 1.36 |
| 0.70 | 0.00 | 2.97 | 1.37 |
| 0.80 | 0.00 | 3.11 | 1.38 |
| 0.90 | 0.00 | 3.20 | 1.39 |
| 1.00 | 0.00 | 3.32 | 1.39 |
| 1.10 | 0.02 | 3.41 | 1.39 |
| 1.20 | 0.04 | 3.50 | 1.40 |
| 1.24 | 0.04 | 3.60 | 1.39 |
| 1.30 | 0.04 | 3.70 | 1.40 |
| 1.34 | 0.03 | 3.80 | 1.40 |
| 1.38 | 0.02 | 4.03 | 1.40 |
| 1.45 | 0.01 | 4.22 | 1.40 |
| 1.48 | 0.01 | 4.40 | 1.39 |
| 1.55 | 0.02 | 4.61 | 1.39 |
| 1.59 | 0.03 | 4.78 | 1.40 |
| 1.64 | 0.05 | 5.03 | 1.39 |
| 1.71 | 0.11 | 5.20 | 1.39 |
| 1.78 | 0.21 | 5.39 | 1.38 |
| 1.81 | 0.26 | 5.61 | 1.39 |
| 1.85 | 0.33 | 5.81 | 1.38 |
| 1.90 | 0.44 | 6.02 | 1.38 |
| 1.96 | 0.57 | 6.21 | 1.38 |
| 2.03 | 0.70 | 6.40 | 1.38 |
| 2.08 | 0.80 | 6.63 | 1.38 |
| 2.15 | 0.92 | 6.80 | 1.38 |
| 2.21 | 1.02 | 7.02 | 1.38 |
| 2.28 | 1.10 | 7.20 | 1.38 |
| 2.33 | 1.14 | ||
| 2.39 | 1.19 |
b. Properly choose the size of scales and units for abscissa and ordinate that bears the relation to the accuracy and range of the experiment. (0.3 pts)
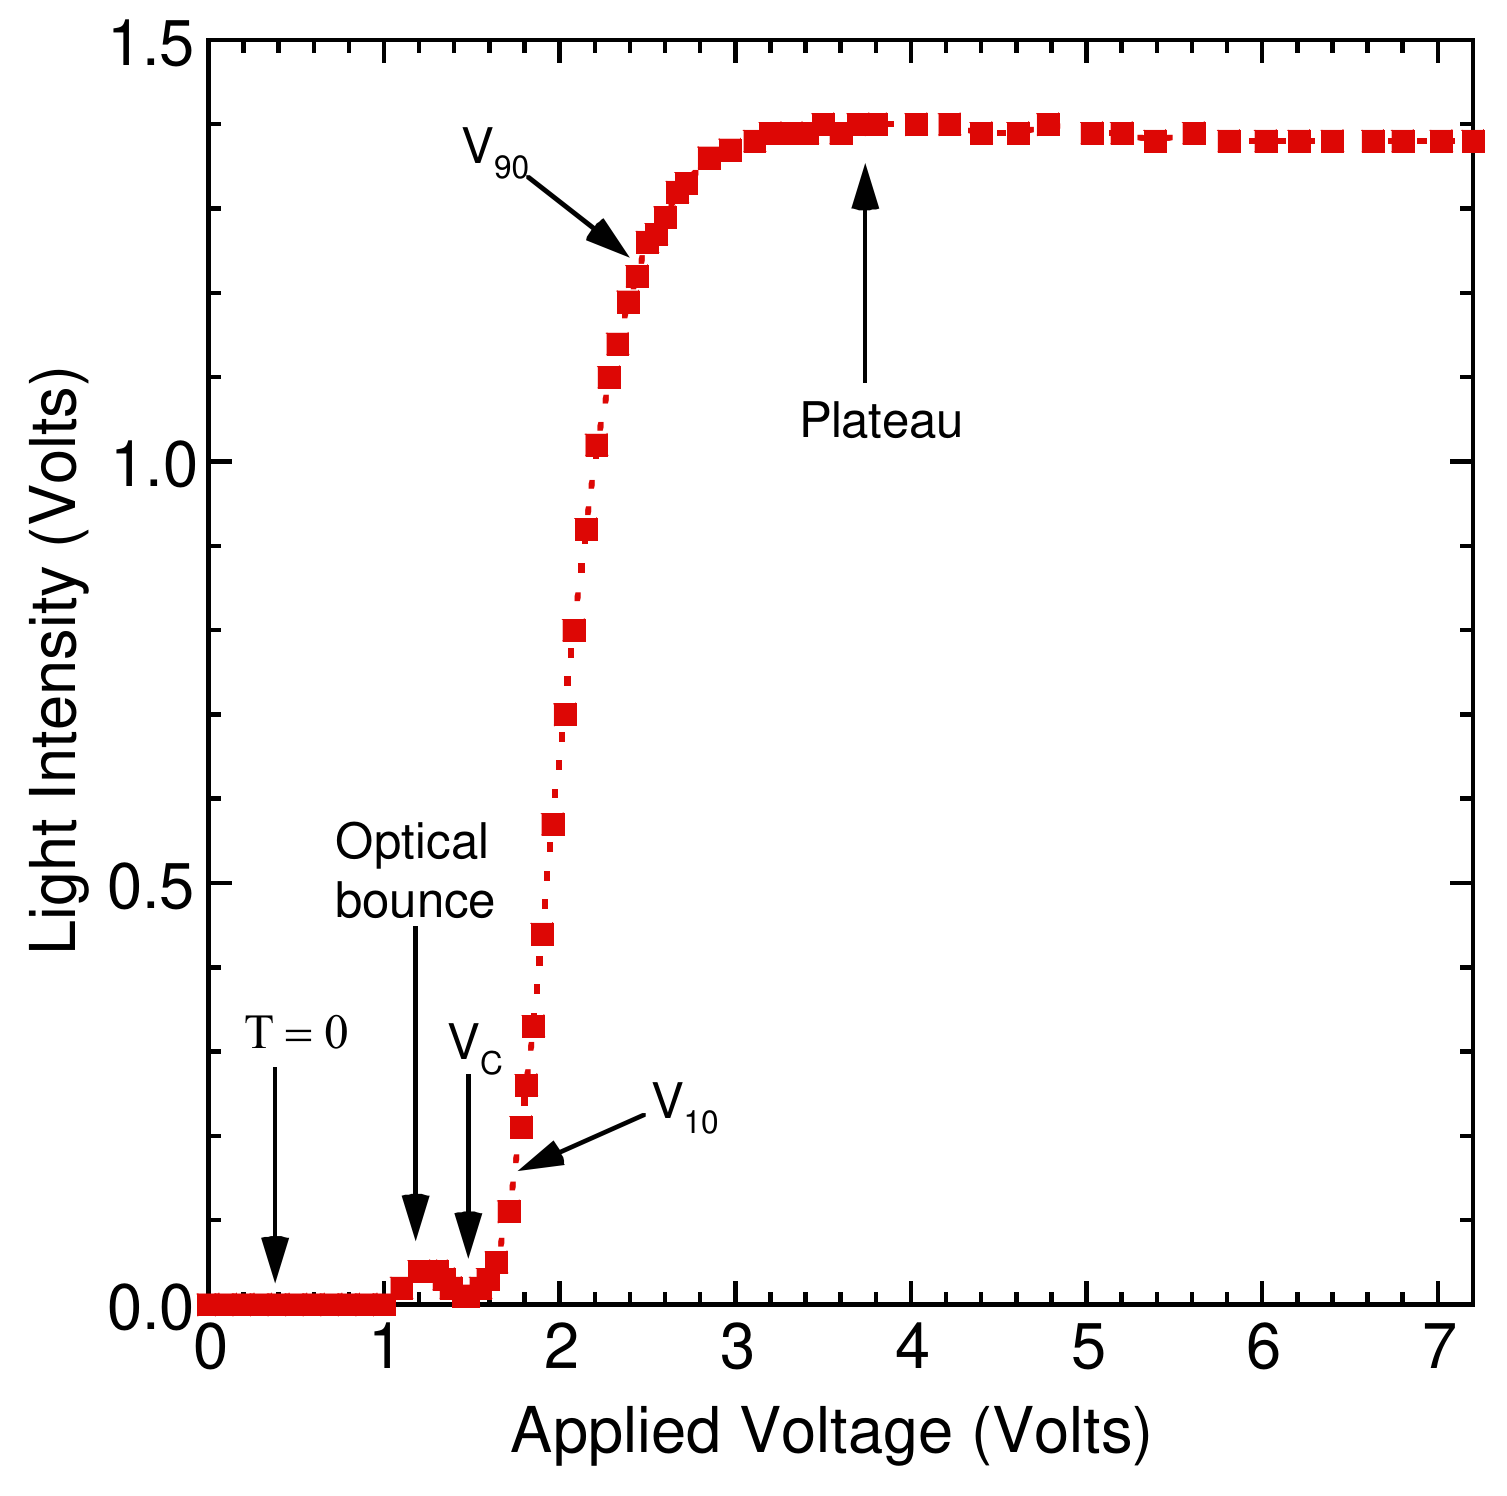
c. Correct measurement of the light intensity () as a function of the applied voltage () and adequate - curve plot.
- The intensity of the transmission light is smaller than 0.05 Volts in the normally black mode. (0.4 pts)
- There is a small optical bounce before the external applied voltage reaches the critical voltage. (0.8 pts)
- The intensity of the transmission light increases rapidly and abruptly when the external applied voltage exceeds the critical voltage. (0.4 pts)
- The intensity of the transmission light displays the plateau behavior as the external applied voltage exceeds 3.0 Volts. (0.4 pts)
d. Adequate value of γ with error.
- Find the maximum value of the light intensity in the region of the applied voltage between 3.0 and 7.2 Volts (0.6 pts)
- Determine the value of 90 % of the maximum light intensity. Obtain the value of the applied voltage by interpolation. (0.6 pts)
- Determine the value of 10 % of the maximum light intensity. Obtain the value of the applied voltage by interpolation. (0.6 pts)
- Correct γ ± Δγ value, (0.42 ~ 0.44) ± 0.02. (0.4+0.2 pts)
Question B-(2) (Total 2.5 points)
Determine the critical voltage of this NB TN LC cell. Show explicitly with graph how you determine the value .
a. Adequate value of with error, .
- Make the expanded scale plot and take more data points in the region of . (0.8 pts)
- Determine the value of when the intensity of the transmission light increases rapidly and abruptly. (0.7 pts)
- Correct value, (1.20 ~ 1.50) ± 0.01 Volts. (0.8+0.2 pts)
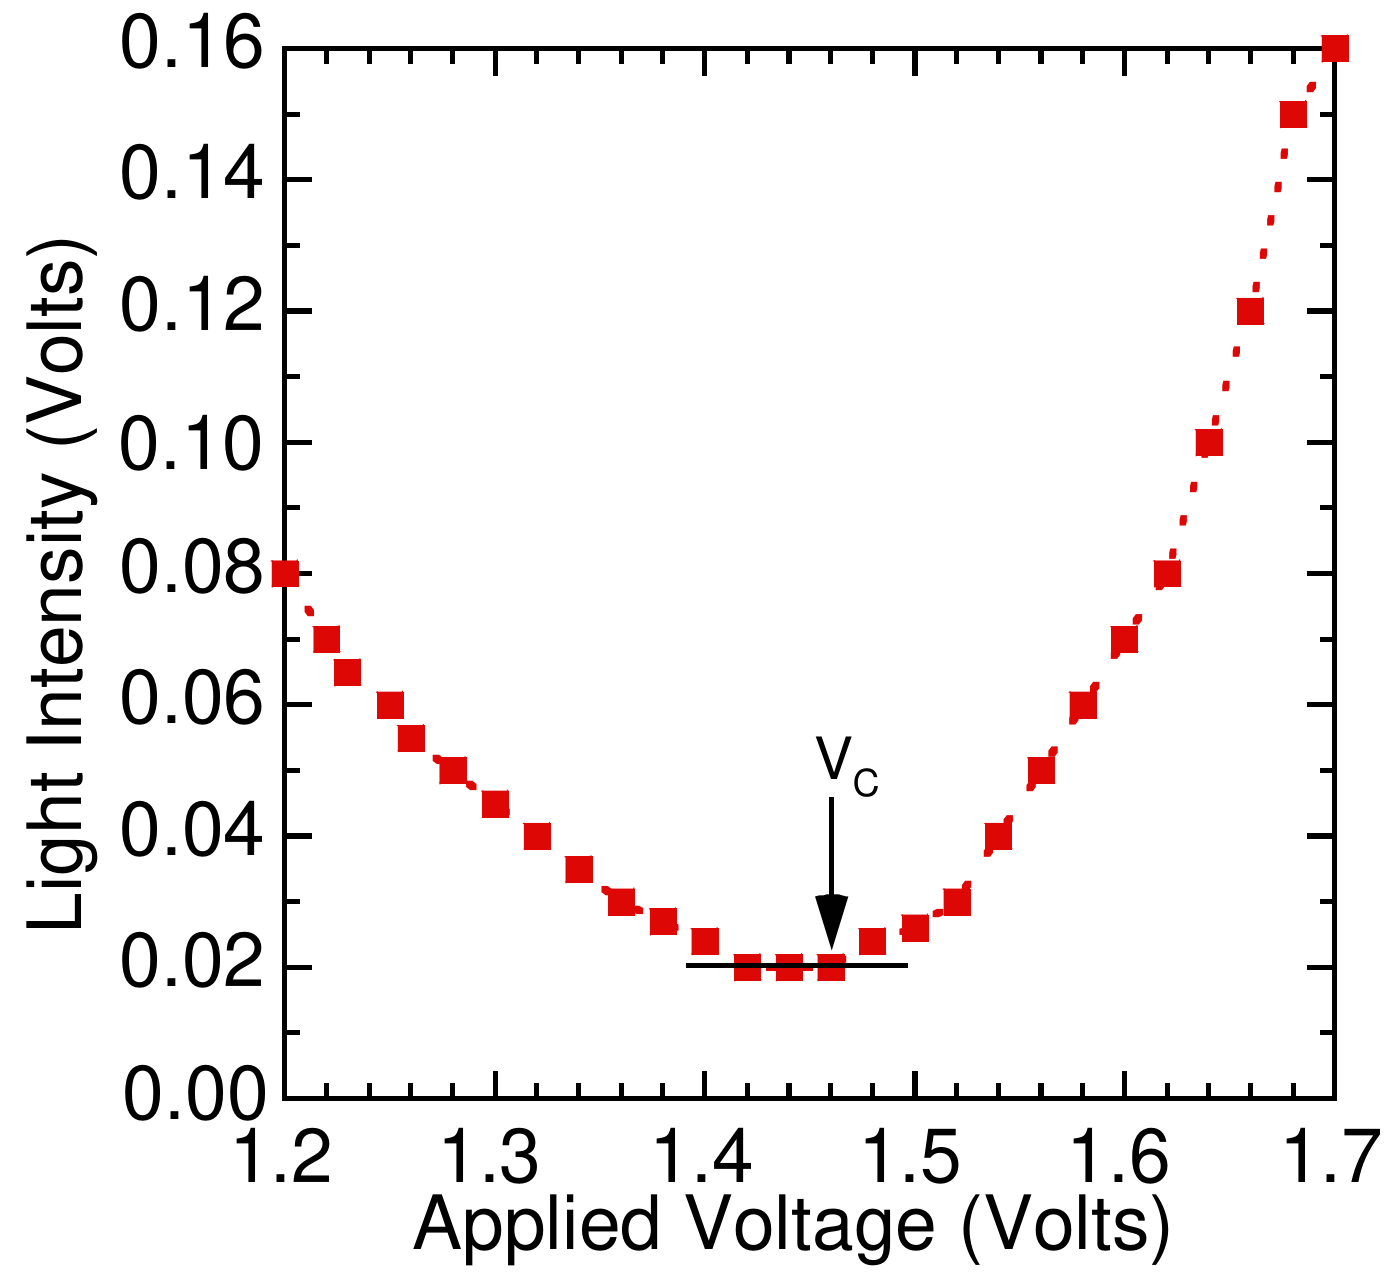
(The data shown in this graph do not correspond to the data shown on the previous page. This graph only shows how to obtain Vc.)
Marking Scheme
Part B: Optical Properties of Nematic Liquid Crystal
Electro-optical switching characteristic of TN LC cell
| No. | Contents | Sub Scores | Total Scores |
|---|---|---|---|
| B-(1) | Measure, tabulate, and plot the electro-optical switching curve ( vs. curve) of the NB TN LC, and find its switching slope , where is defined as . | 5.0 pts. | |
| a | Proper data table marked with variables and units. | 0.3 | |
| b | Properly choose the size of scales and units for abscissa and ordinate that bears the relation to the accuracy and range of the experiment. | 0.3 | |
| c | Correct measurement of the light intensity () as a function of the applied voltage () and adequate - curve plot. | ||
| ▪ The intensity of the transmission light reaches zero value in the normally black mode. | 0.4 | ||
| ▪ There is a small optical bounce before the external applied voltage reaches the critical voltage. | 0.8 | ||
| ▪ The intensity of the transmission light increases rapidly and abruptly when the external applied voltage exceeds the critical voltage. | 0.4 | ||
| ▪ The intensity of the transmission light displays the plateau behavior as the external applied voltage exceeds 3.0 Volts. | 0.4 | ||
| d | Adequate value of γ with error, γ ± Δγ. | ||
| ▪ Correctly analyzing the maximum light intensity. | 0.6 | ||
| ▪ Correctly analyzing the value of . | 0.6 | ||
| ▪ Correctly analyzing the value of . | 0.6 | ||
| ▪ Correct γ ± Δγ value, (0.42 ~ 0.44) ± 0.02. | 0.6 | ||
| B-(2) | Determine the critical voltage of this NB TN LC cell. Show explicitly with graph how you determine the value . | 2.5 pts. | |
| Adequate value of with error, . | |||
| ▪ Make the expanded scale plot and take more data points in the region of . | 0.8 | ||
| ▪ Correctly analyzing the value of . | 0.7 | ||
| ▪ Correct value, (1.2 ~ 1.5) ± 0.01 Volts. | 1.0 |
Оригинал в Архива: IPhO_2003_Experiment Question.pdf · официални решения: IPhO_2003_Experiment Solution.pdf