IPhO 2008, Експеримент — Задача 2. C. Task 2: Determining the efficiency of a solar cell under illumination of an incandescent lamp
39th International Physics Olympiad - Hanoi - Vietnam - 2008 · Experimental Problem · DIFFERENTIAL THERMOMETRIC METHOD
Условие
1. Aim of the experiment
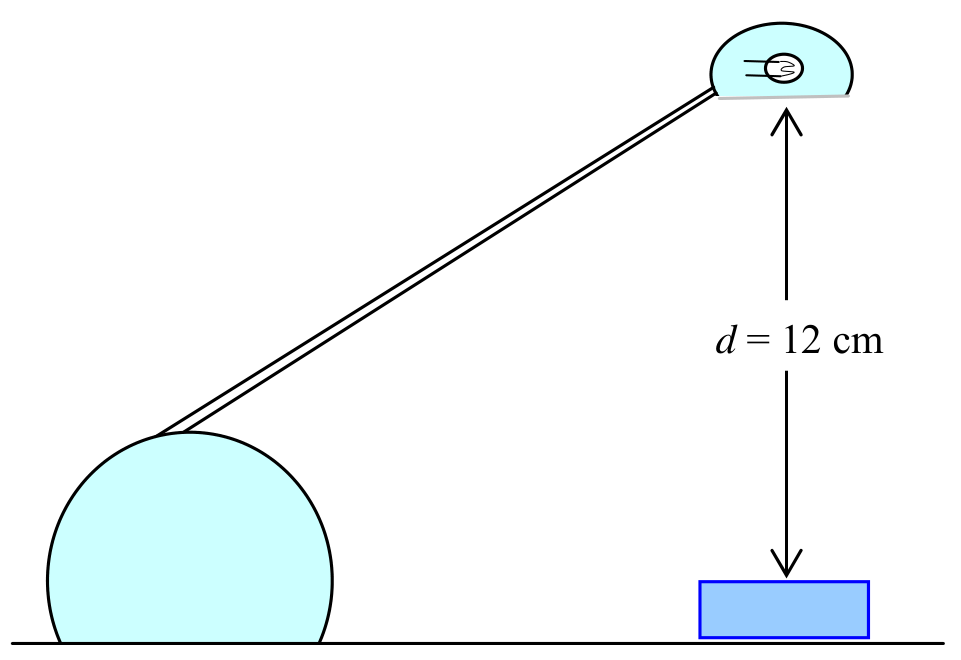
The aim of the experiment is to determine the efficiency of a solar cell under illumination of an incandescent lamp. Efficiency is defined as the ratio of the electrical power that the solar cell can supply to an external circuit, to the total radiant power received by the cell. The efficiency depends on the incident radiation spectrum. In this experiment the radiation incident to the cell is that of an incandescent halogen lamp. In order to determine the efficiency of the solar cell, we have to measure the irradiance at a point situated under the lamp, at a distance from the lamp along the vertical direction, and the maximum power of the solar cell when it is placed at this point. In this experiment, = 12 cm (Figure 6). Irradiance can be defined by:
in which is the radiant flux (radiant power), and is the area of the illuminated surface.
2. Apparatus and materials
- The light source is a 20W halogen lamp.
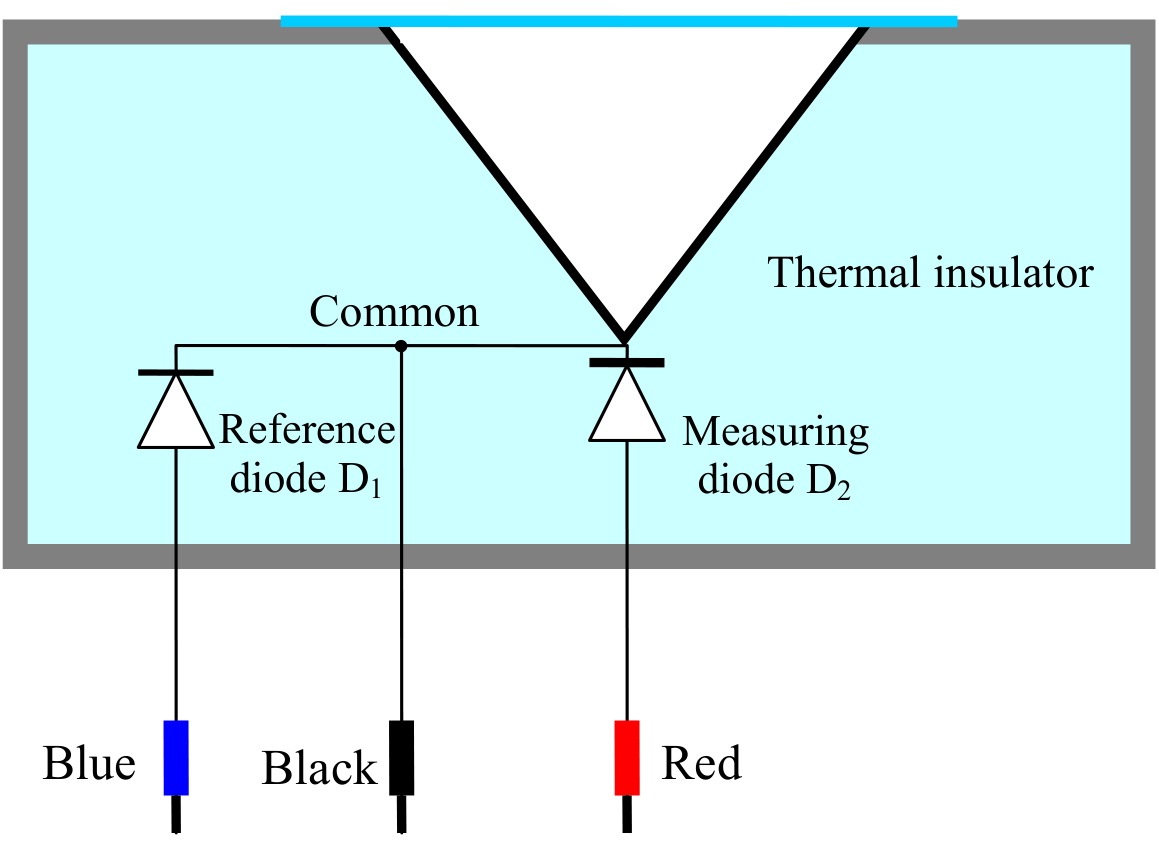
- The radiation detector is a hollow cone made of copper, the inner surface of it is blackened with soot (Figure 7). The cone is incompletely thermally isolated from the surrounding. In this experiment, the detector is considered an ideal black body. To measure temperature, we use silicon diodes. The measuring diode is fixed to the radiation detector (D in Figure 1 and Figure 7), so that its temperature equals that of the cone. The reference diode is placed on the inner side of the wall of the box containing the detector; its temperature equals that of the surrounding. The total heat capacity of the detector (the cone and the measuring diode) is . The detector is covered by a very thin polyethylene film; the radiation absorption and reflection of which can be neglected.
- A circuit box as shown in Figure 2.
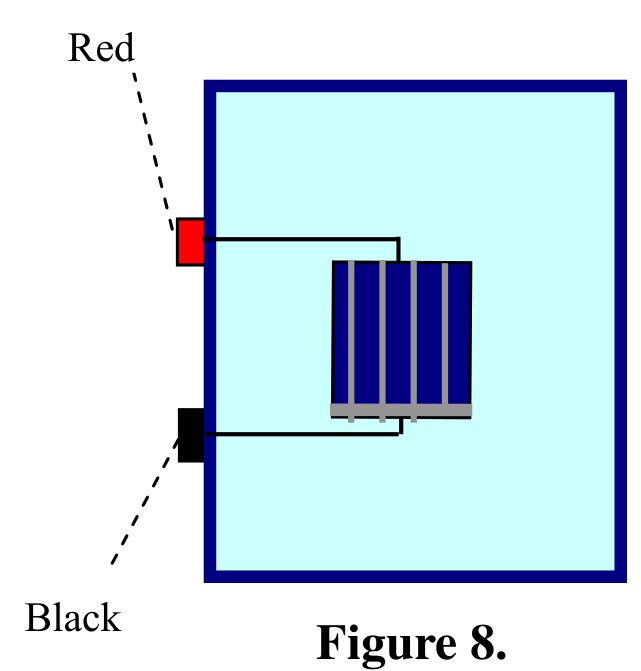
- A piece of solar cell fixed on a plastic box (Figure 8). The area of the cell includes some metal connection strips. For the efficiency calculation these strips are considered parts of the cell.
- Two digital multimeters. When used to measure the voltage, they have a very large internal resistance, which can be considered infinitely large. When we use them to measure the current, we cannot neglect their internal resistance. The voltage function of the multimeter has an error of ±2 on the last digit. The multimeters can also measure the room temperature.
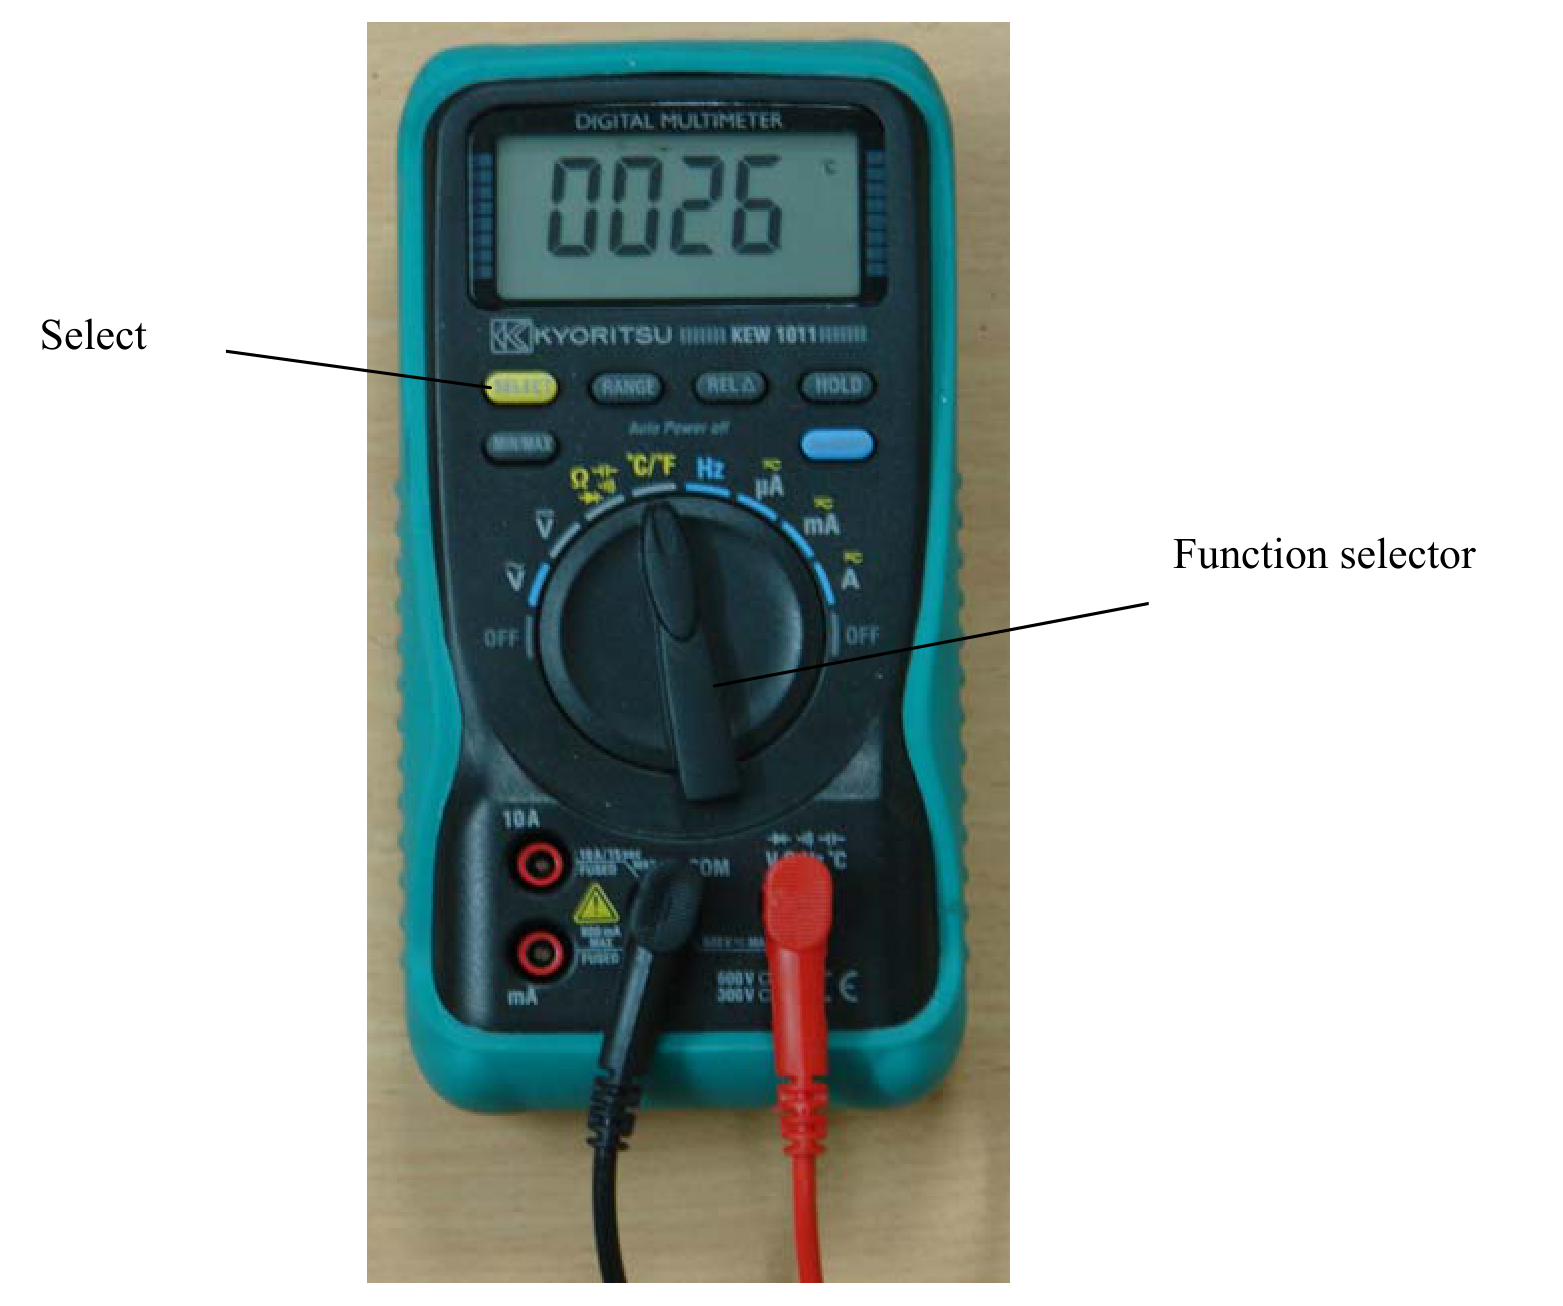
Note: to prevent the multimeter (see Figure 9) from going into the “Auto power off” function, turn the Function selector from OFF position to the desired function while pressing and holding the SELECT button.
- A 9 V battery
- A variable resistor.
- A stop watch
- A ruler with 1mm divisions
- Electrical leads.
- Graph papers.
3. Experiment
When the detector receives energy from radiation, it heats up. At the same time, the detector loses its heat by several mechanisms, such as thermal conduction, convection, radiation etc...Thus, the radiant energy received by detector in a time interval is equal to the sum of the energy needed to increase the detector temperature and the energy transferred from the detector to the surrounding:
where is the heat capacity of the detector and the diode, - the temperature increase and - the heat loss.
When the temperature difference between the detector and the surrounding is small, we can consider that the heat transferred from the detector to the surrounding in the time interval is approximately proportional to and , that is , with being a factor having the dimension of W/K. Hence, assuming that is constant and is small, we have:
or
The solution of this differential equation determines the variation of the temperature difference with time t, from the moment the detector begins to receive the light with a constant irradiation, assuming that at t=0,
When the radiation is switched off, the mentioned above differential equation becomes
and the temperature difference varies with the time according to the following formula:
where is the temperature difference at (the moment when the measurement starts).
1 Determine the room temperature .
2. Compose an electric circuit comprising the diode sensors, the circuit box and the multimeters to measure the temperature of the detector.
In order to eliminate errors due to the warming up period of the instruments and devices, it is strongly recommended that the complete measurement circuit be switched on for about 5 minutes before starting real experiments.
2.1. Place the detector under the light source, at a distance of = 12 cm to the lamp. The lamp is off. Follow the variation of for about 2 minutes with sampling intervals of 10 s and determine the value of in equation (3).
2.2. Switch the lamp on to illuminate the detector. Follow the variation of . Every 10-15 s, write down a value of in the table provided in the answer sheet. (Note: columns x and y of the table will be used later in section 4.). After 2 minutes, switch the lamp off.
2.3. Move the detector away from the lamp. Follow the variation of for about 2 minutes after that. Every 10-15 s, write down a value of in the table provided in the answer sheet. (Note: columns x and y of the table will be used later in section 3.).
Hints: As the detector has a thermal inertia, it is recommended not to use some data obtained immediately after the moment the detector begins to be illuminated or ceases to be illuminated.
3. Plot a graph in an x-y system of coordinates, with variables x and y chosen appropriately, in order to prove that after the lamp is switched off, equation (7) is satisfied.
3.1. Write down the expression for variables x and y.
3.2. Plot a graph of y versus x, called Graph 5.
3.3. From the graph, determine the value of .
4. Plot a graph in an x-y system of coordinates, with variables x and y chosen appropriately, in order to prove that when the detector is illuminated, equation (5) is satisfied.
4.1. Write down the expressions for variables x and y.
4.2. Plot a graph of y versus x, called Graph 6.
4.3. Determine the irradiance at the orifice of the detector.
5. Put the solar cell to the same place where the radiation detector was. Connect the solar cell to an appropriate electric circuit comprising the multimeters and a variable resistor which is used to change the load of the cell. Measure the current in the circuit and the voltage on the cell at different values of the resistor.
5.1. Draw a diagram of the circuit used in this experiment.
5.2. By rotating the knob of the variable resistor, you change the value of the load. Note the values of current and voltage at each position of the knob.
5.3. Plot a graph of the power of the cell, which supplies to the load, as a function of the current through the cell. This is Graph 7.
5.4. From the graph deduce the maximum power of the cell and estimate its error.
5.5. Write down the expression for the efficiency of the cell that corresponds to the obtained maximum power. Calculate its value and error.
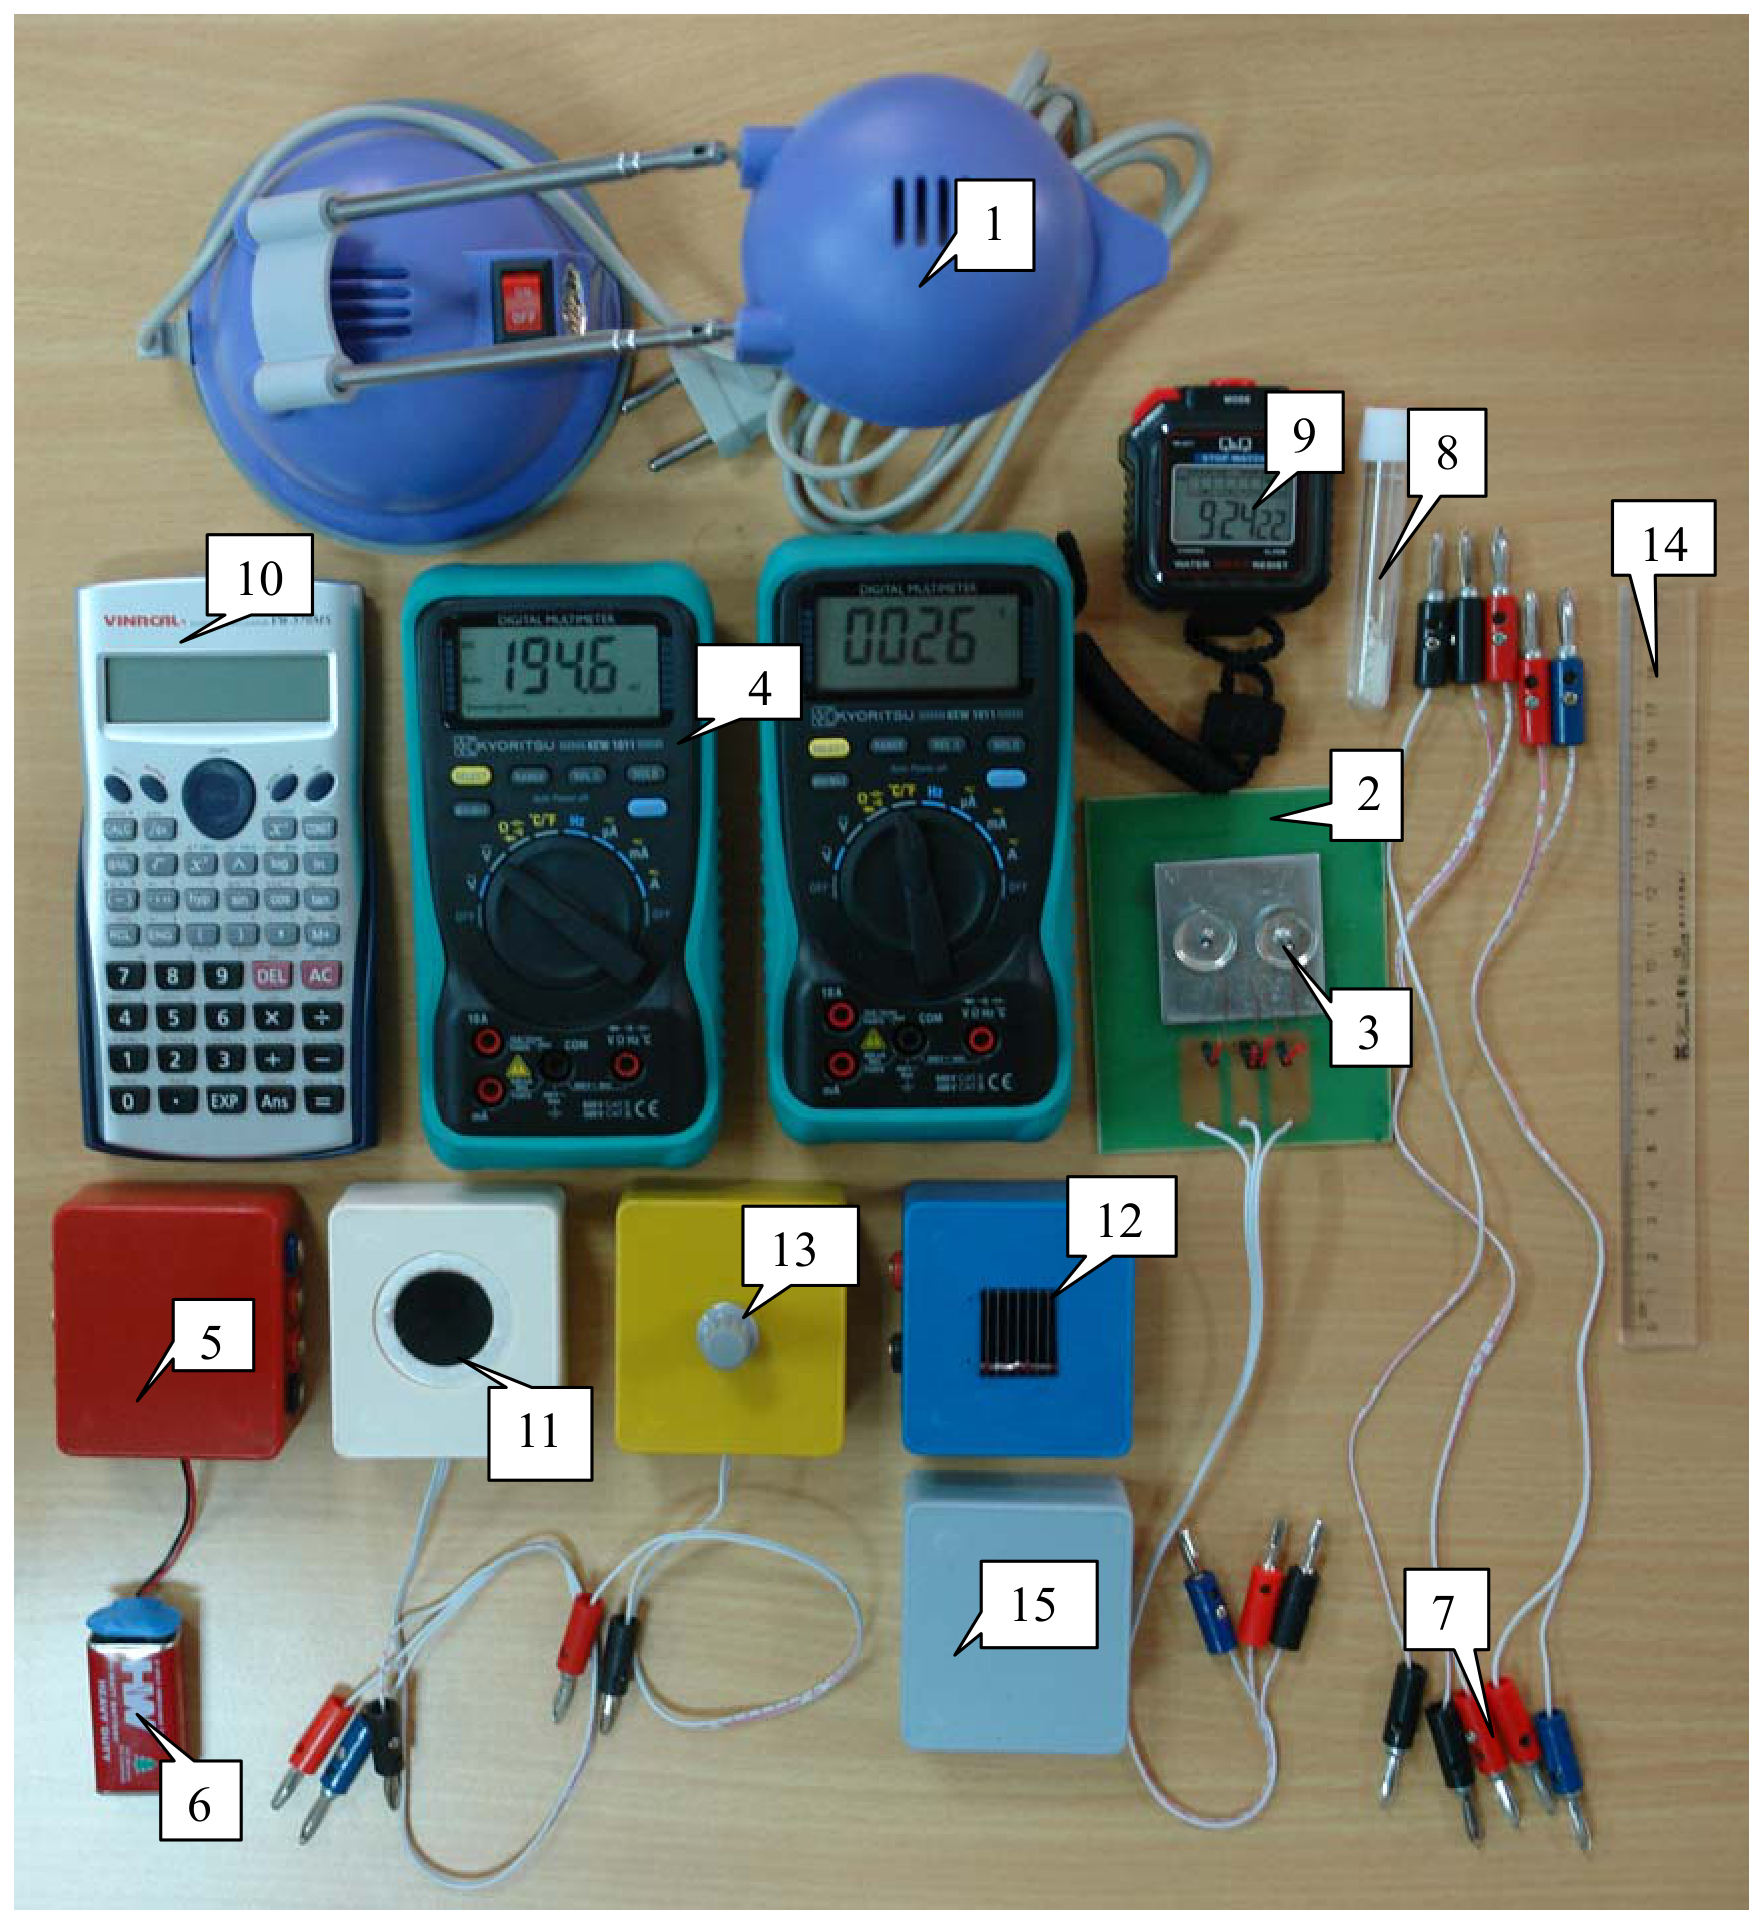
Contents of the experiment kit (see also Figure 10)
| 1 | Halogen lamp 220 V/ 20 W | 9 | Stop watch |
|---|---|---|---|
| 2 | Dish holder | 10 | Calculator |
| 3 | Dish | 11 | Radiation detector |
| 4 | Multimeter | 12 | Solar cell |
| 5 | Circuit box | 13 | Variable resistor |
| 6 | 9 V battery | 14 | Ruler |
| 7 | Electrical leads | 15 | Box used as a cover |
| 8 | Ampoule with substance to be measured |
Note: to prevent the multimeter (see Figure 9) from going into the “Auto power off” function, turn the Function selector from OFF position to the desired function while pressing and holding the SELECT button.
Отговори
5.8 %
Efficiency of the solar cell from the official solution: ηmax = (5.8±0.8)%.
5.5. 5.8 %
Official result: ηmax = (5.8±0.8)%.
Решение
1.
1.1.
2.
2.1. Measured data with the lamp off
| t (s) | ΔV(T) (mV) (±0.2mV) |
|---|---|
| 0 | 19.0 |
| 10 | 19.0 |
| 20 | 19.0 |
| 30 | 19.0 |
| 40 | 19.0 |
| 50 | 18.9 |
| 60 | 18.9 |
| 70 | 18.9 |
| 80 | 18.9 |
| 90 | 18.9 |
| 100 | 19.0 |
| 110 | 19.0 |
| 120 | 19.0 |
Values of ΔV(T) can be different from one experiment set to another. The acceptable values lie in between -40÷+40 mV.
2.2. Measured data with the lamp on
| t (s) | ΔV (mV) (±0.2mV) |
|---|---|
| 0 | 19.5 |
| 10 | 21.9 |
| 20 | 23.8 |
| 30 | 25.5 |
| 40 | 26.9 |
| 50 | 28.0 |
| 60 | 29.0 |
| 70 | 29.9 |
| 80 | 30.7 |
| 90 | 31.4 |
| 100 | 32.0 |
| 110 | 32.4 |
| 120 | 32.9 |
When illuminated (by the lamp) values of ΔV may change 10 ÷ 20 mV compared to the initial situation (lamp off).
2.3. Measured data after turning the lamp off
| t (s) | ΔV (mV) (±0.2mV) |
|---|---|
| 0 | 23.2 |
| 10 | 22.4 |
| 20 | 21.6 |
| 30 | 21.0 |
| 40 | 20.5 |
| 50 | 20.1 |
| 60 | 19.6 |
| 70 | 19.3 |
| 80 | 18.9 |
| 90 | 18.6 |
| 100 | 18.4 |
| 110 | 18.2 |
| 120 | 17.9 |
3. Plotting graph 5 and calculating k
3.1. ;
Note: other reasonable ways of writing expressions for x and y that also leads to a linear relationship using ln are also accepted.
3.2. Graph 5
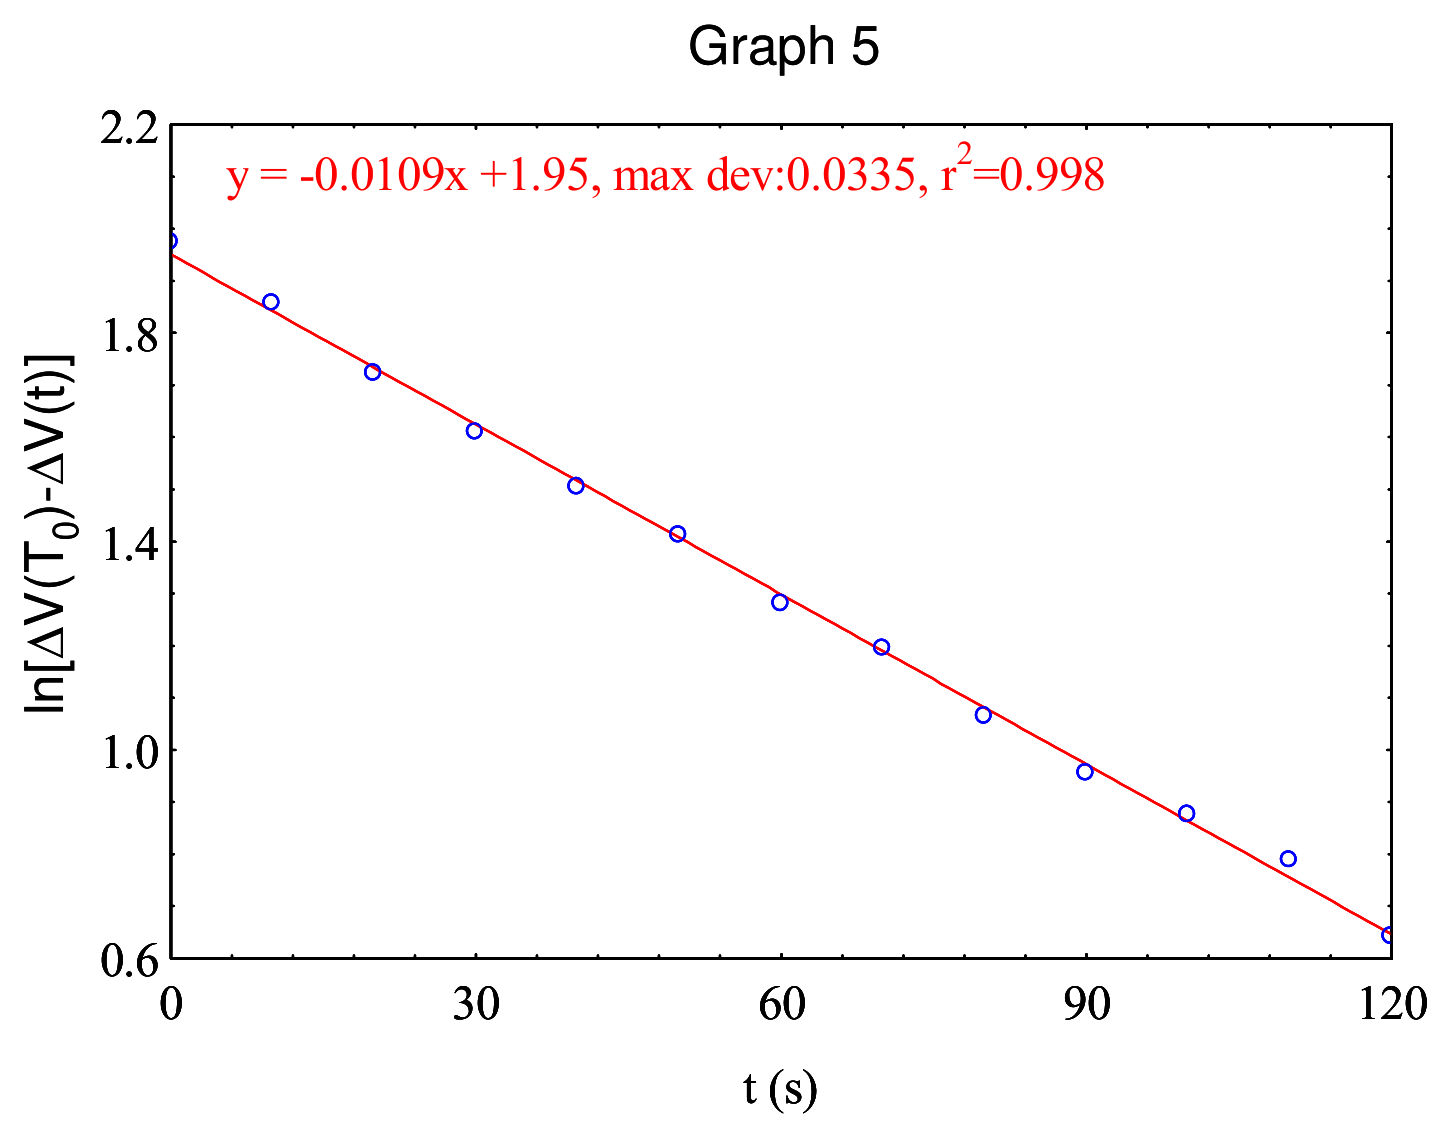
3.3. Calculating k: and , thus:
Note: Error of k will be calculated in 5.5. Students are not asked to give error of k in this step. The acceptable value of k lies in between depending on the experiment set.
4. Plotting Graph 6 and calculating E
4.1. ;
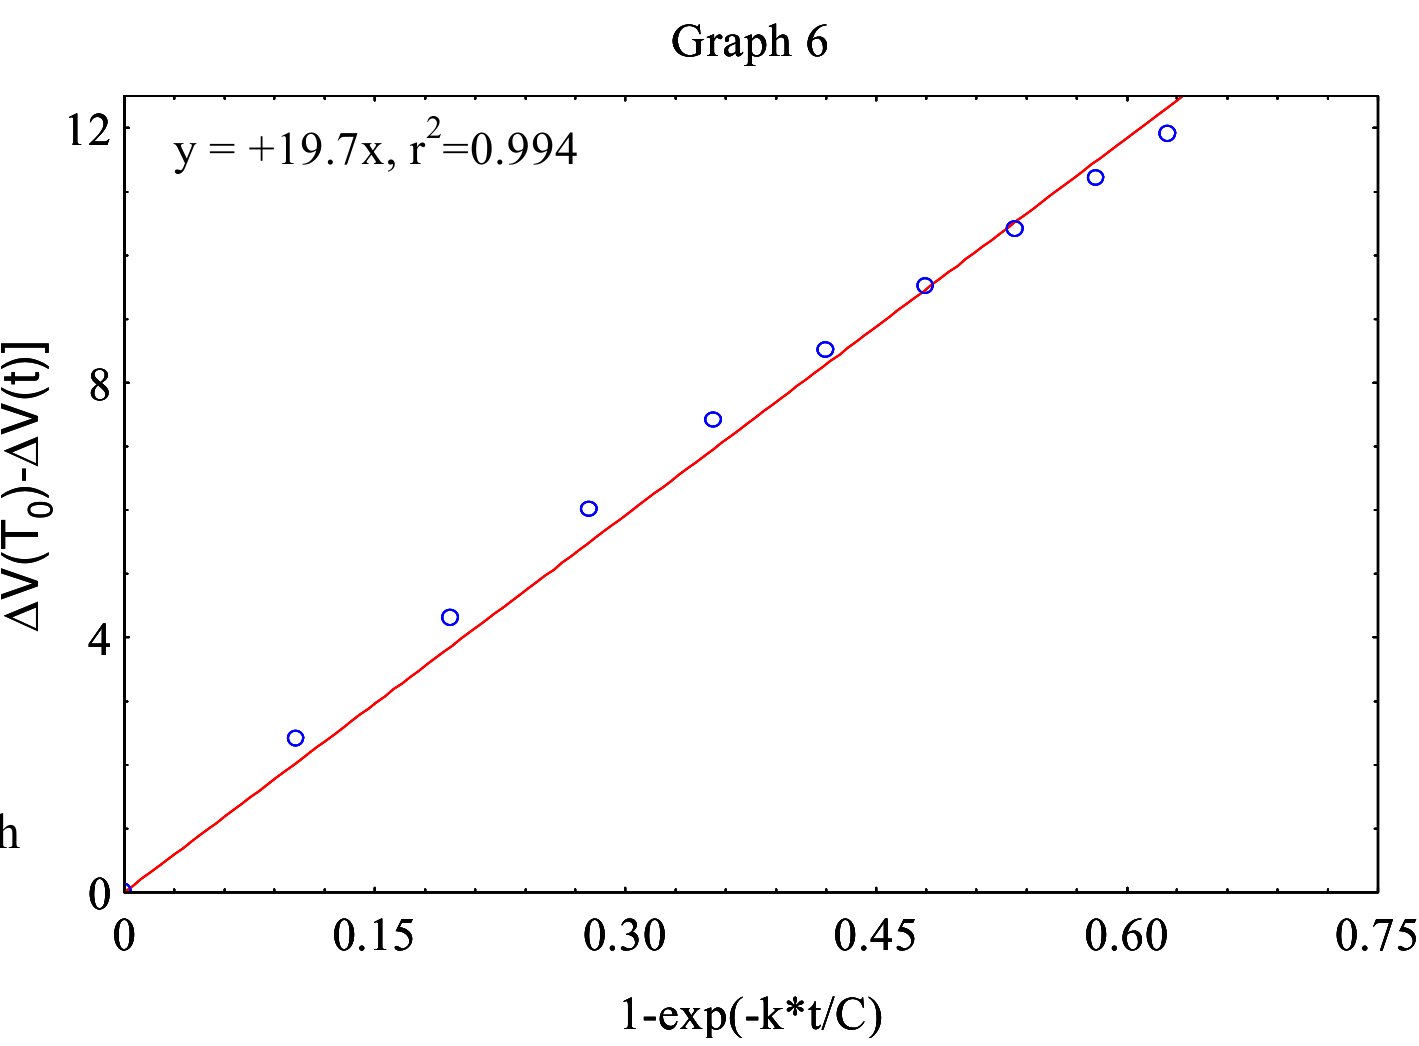
4.2.
Graph 6 should be substantially linear, with the slope in between 15÷25 mV, depending on the experiment set.
4.3. From the slope of Graph 6 and the area of the detector orifice we obtain E = 140 W/m. The area of the detector orifice is
Error of E will be calculated in 5.5. Students are not asked to give error of E in this step. The acceptable value of E lies in between 120 ÷ 160 W/m, depending on the experiment set.
5.
5.1. Circuit diagram:
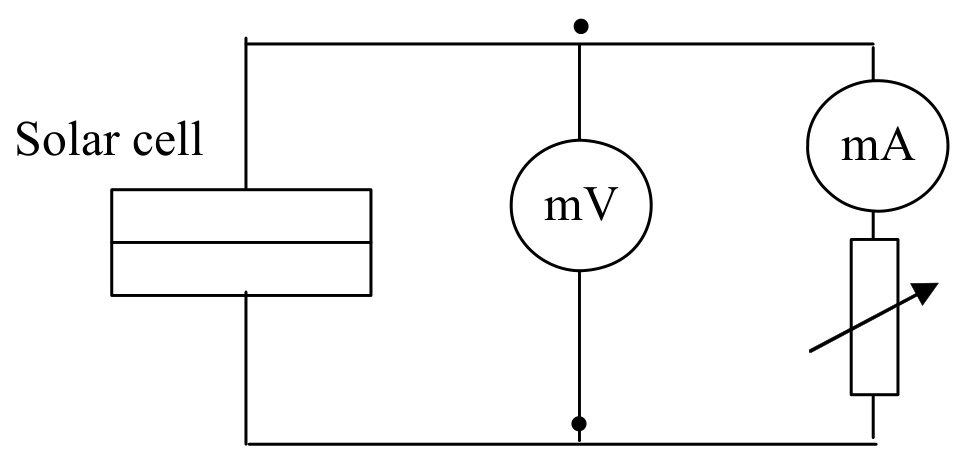
5.2. Measurements of V and I
| V (mV) (±0.3÷3mV) | I (mA) (±0.05÷0.1mA) | P (mW) |
|---|---|---|
| 18.6 ±0.3 | 11.7 | 0.21 |
| 33.5 | 11.7 | 0.39 |
| 150 | 11.5 | 1.72 |
| 157 | 11.6 | 1.82 |
| 182 ±1 | 11.4 | 2.08 |
| 267 | 11.2 | 3.00 |
| 402 ±2 | 9.23 | 3.70 |
| 448 | 6.70 | 3.02 |
| 459 | 5.91 | 2.74 |
| 468 | 5.07 | 2.37 |
| 473 ±3 | 4.63 | 2.20 |
| 480 | 3.81 | 1.86 |
| 485 | 3.24 | 1.57 |
| 487 | 3.12 | 1.54 |
| 489 | 3.13 | 1.55 |
5.3.
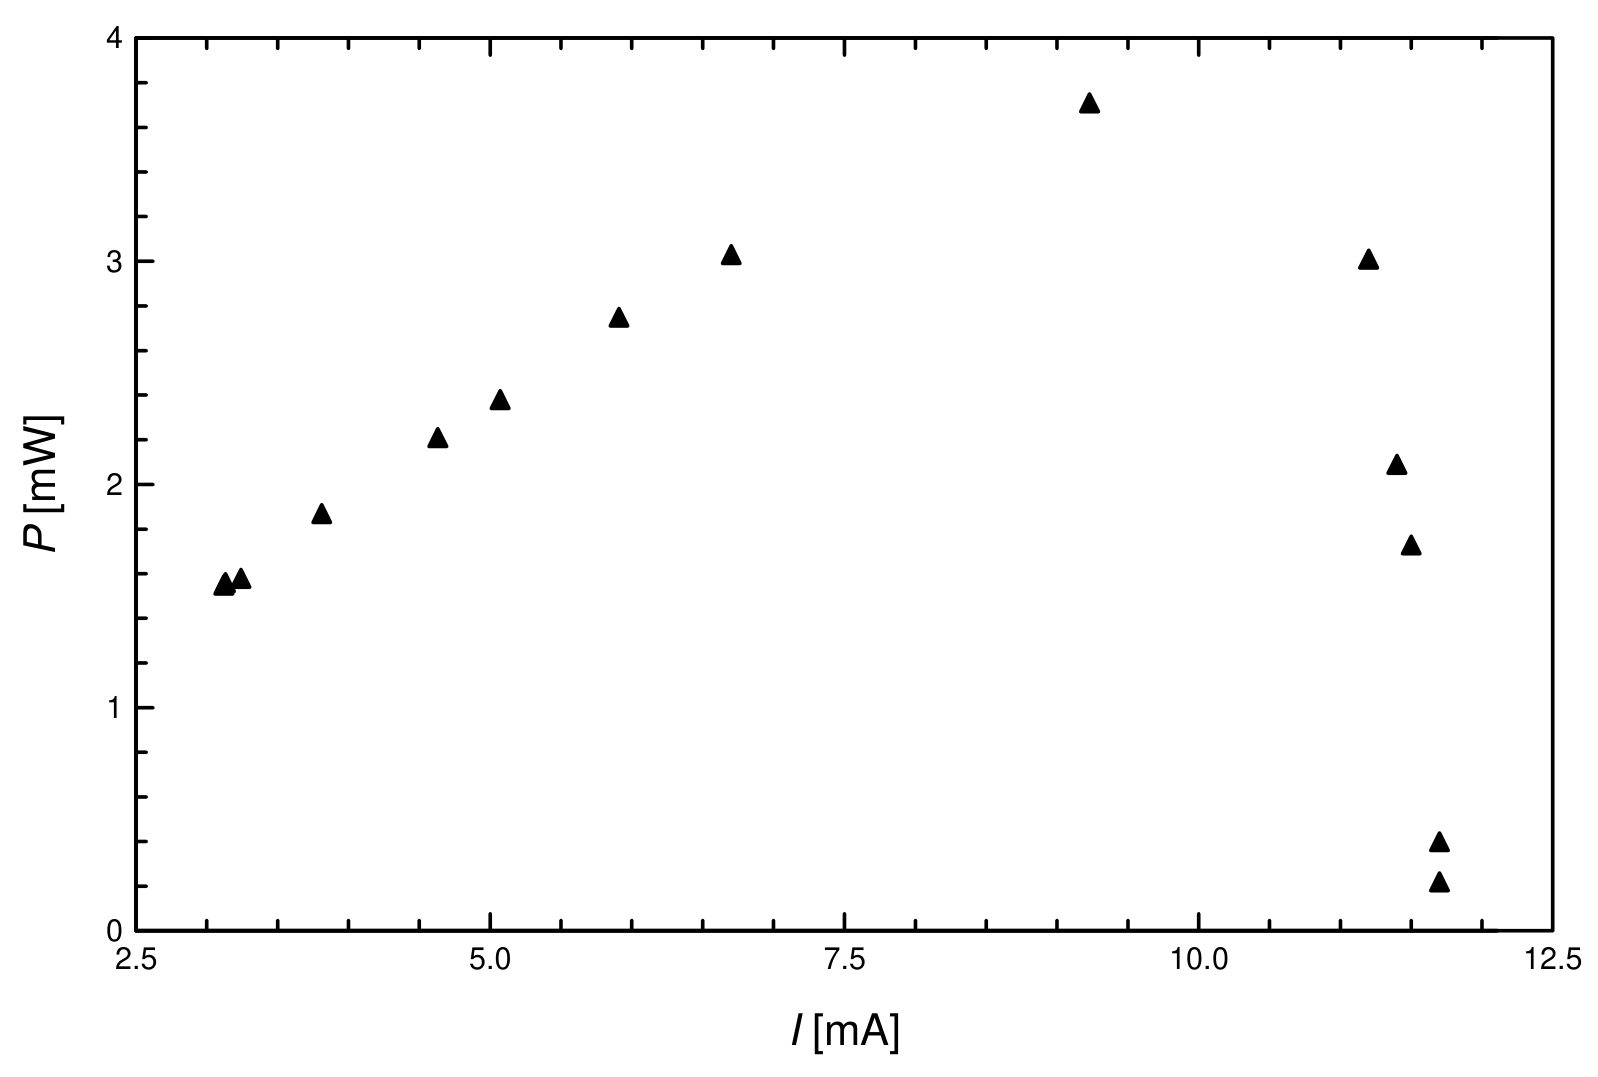
5.4.
The acceptable value of lies in between 3÷4.5 mW, depending on the experiment set.
5.5. Expression for the efficiency
Then
Error calculation:
, in which is the area of the solar cell.
is estimated from Graph 7, typical value ≈ 6 %
: error from the millimeter measurement (with the ruler), typical value ≈ 5 %
E is calculated from averaging the ratio (using Graph 6):
in which B is an intermediate variable, is the radius of the detector orifice.
Calculation of error of E:
k is calculated from the regression of:
We set then
From the regression, we can calculate the error of m:
We derive the expression for the error of :
Typical values for and other constituent errors:
; ; ; ; ;
; ; ;
Finally:
and
Note: if the student uses any other reasonable error method that leads to approximately the same result, it is also accepted.
Оригинал в Архива: exp.pdf · официални решения: exp_sol.pdf