IPhO 2009, Експеримент — Задача 2. BIREFRINGENCE OF MICA
EXPERIMENTAL PROBLEM 2 BIREFRINGENCE OF MICA
Условие
In this experiment you will measure the birefringence of mica (a crystal widely used in polarizing optical components).
MATERIAL
In addition to items 1), 2) and 3), you should use,
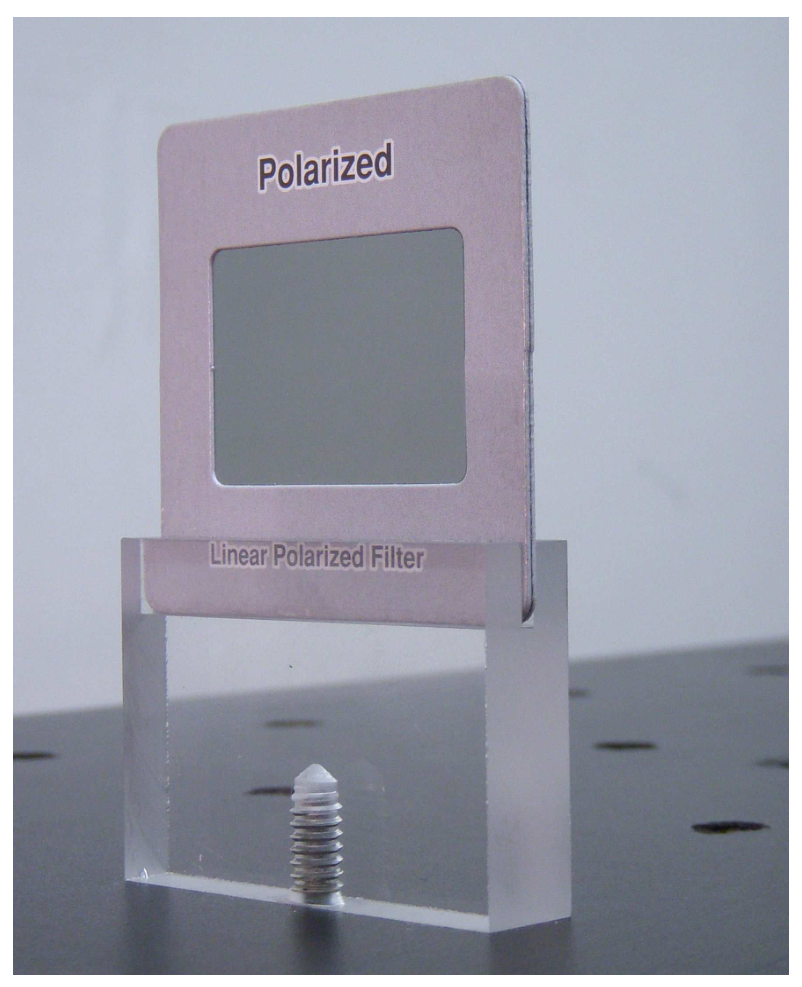
- Two polarizing films mounted in slide holders, each with an additional acrylic support (LABEL J). See photograph for mounting instructions.
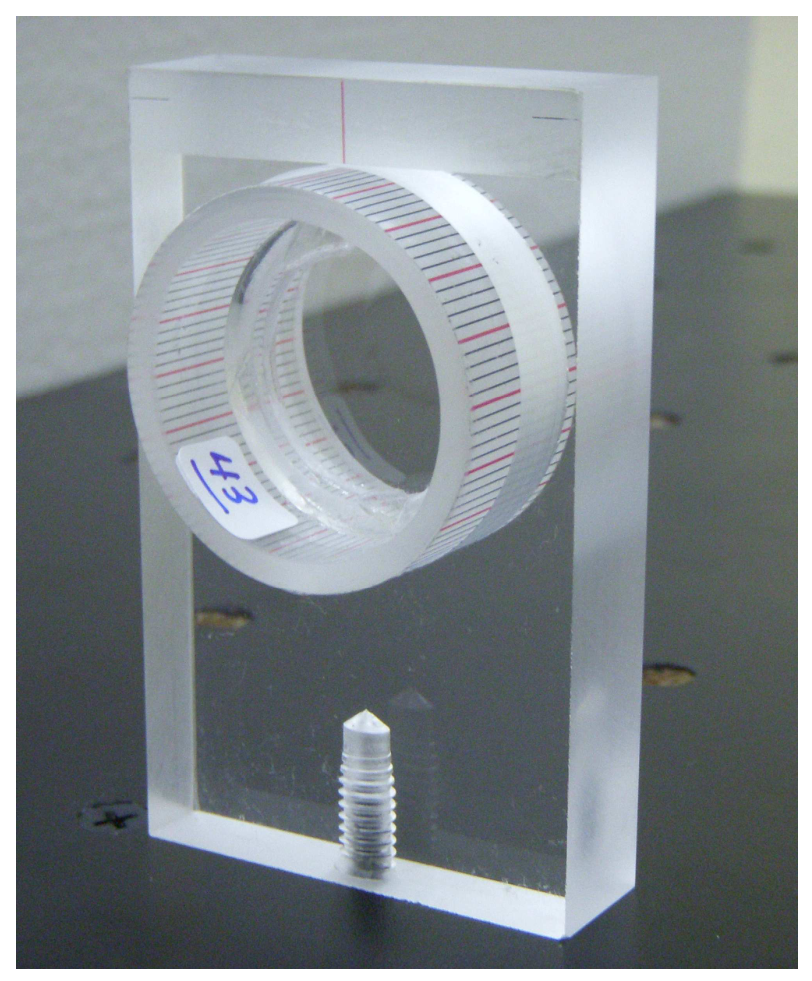
- A thin mica plate mounted in a plastic cylinder with a scale with no numbers; acrylic support for the cylinder (LABEL K). See photograph for mounting instructions.
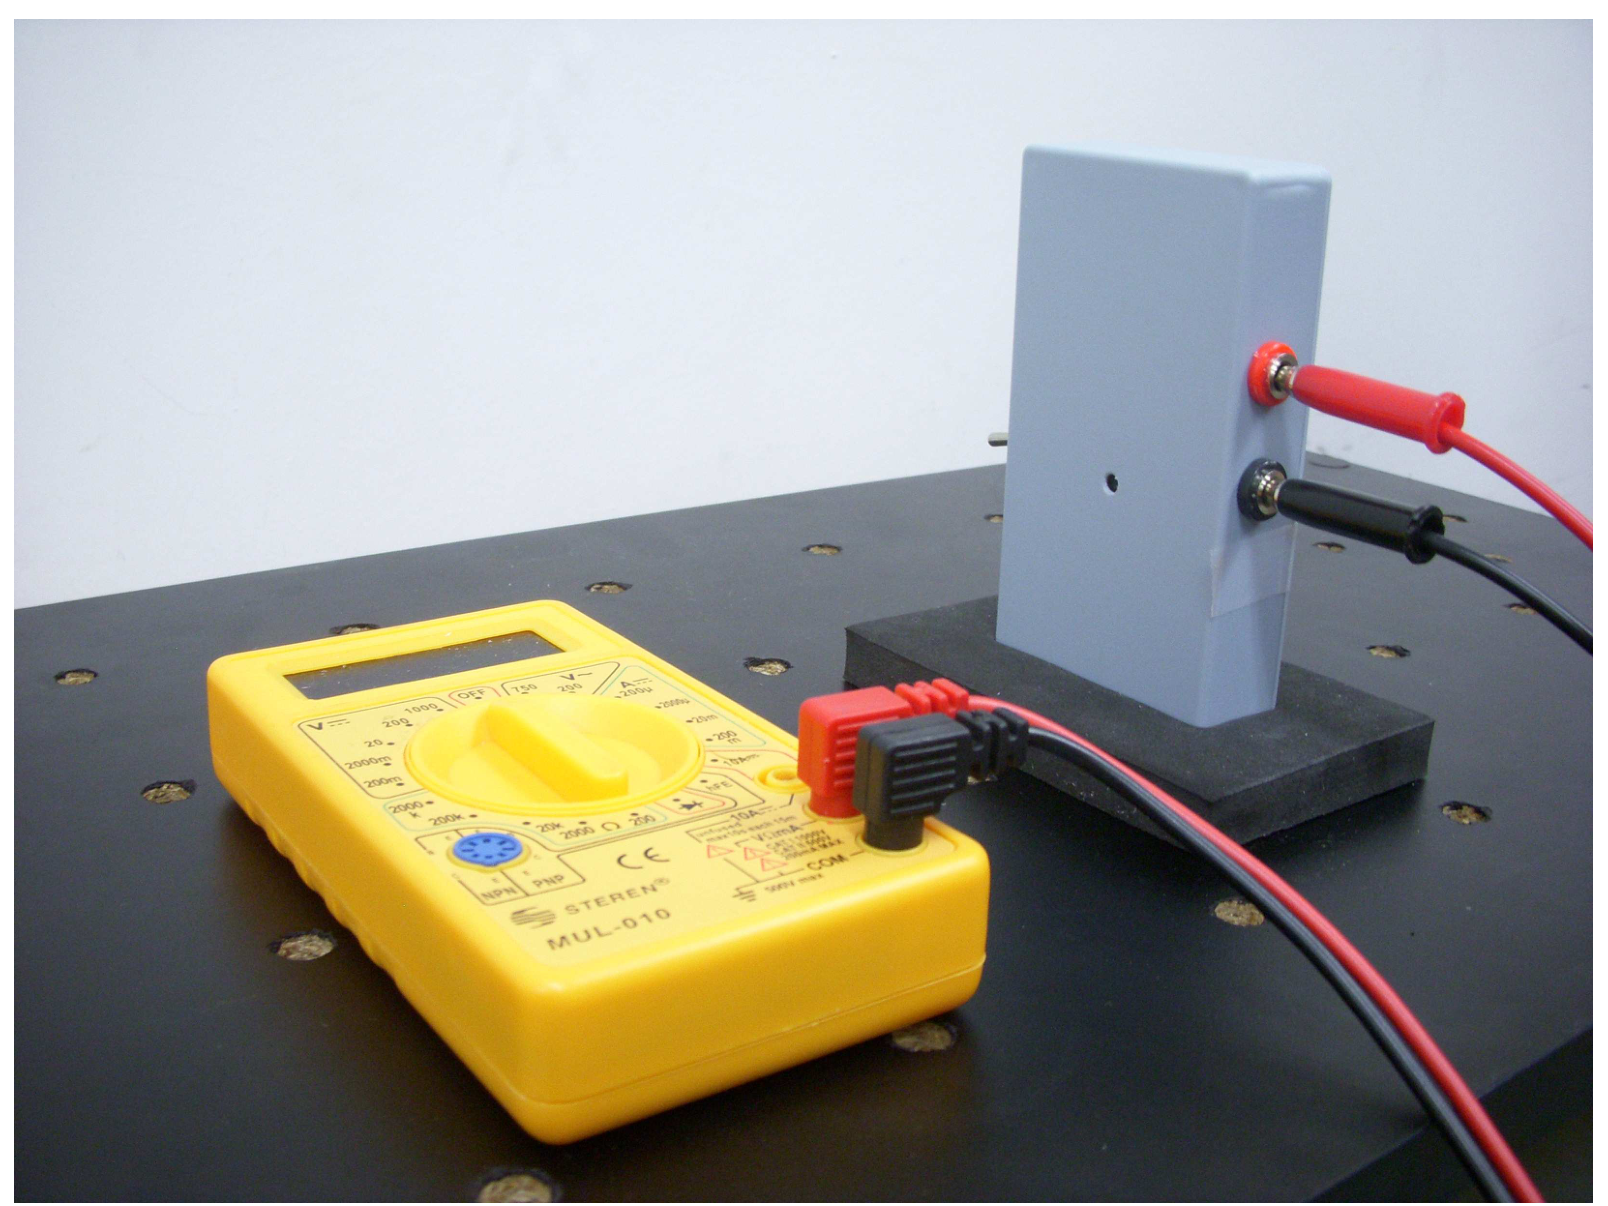
- Photodetector equipment. A photodetector in a plastic box, connectors and foam support. A multimeter to measure the voltage of the photodetector (LABEL L). See photograph for mounting and connecting instructions.
- Calculator.
- White index cards, masking tape, stickers, scissors, triangle squares set.
- Pencils, paper, graph paper.
DESCRIPTION OF THE PHENOMENON
Light is a transverse electromagnetic wave, with its electric field lying on a plane perpendicular to the propagation direction and oscillating in time as the light wave travels.
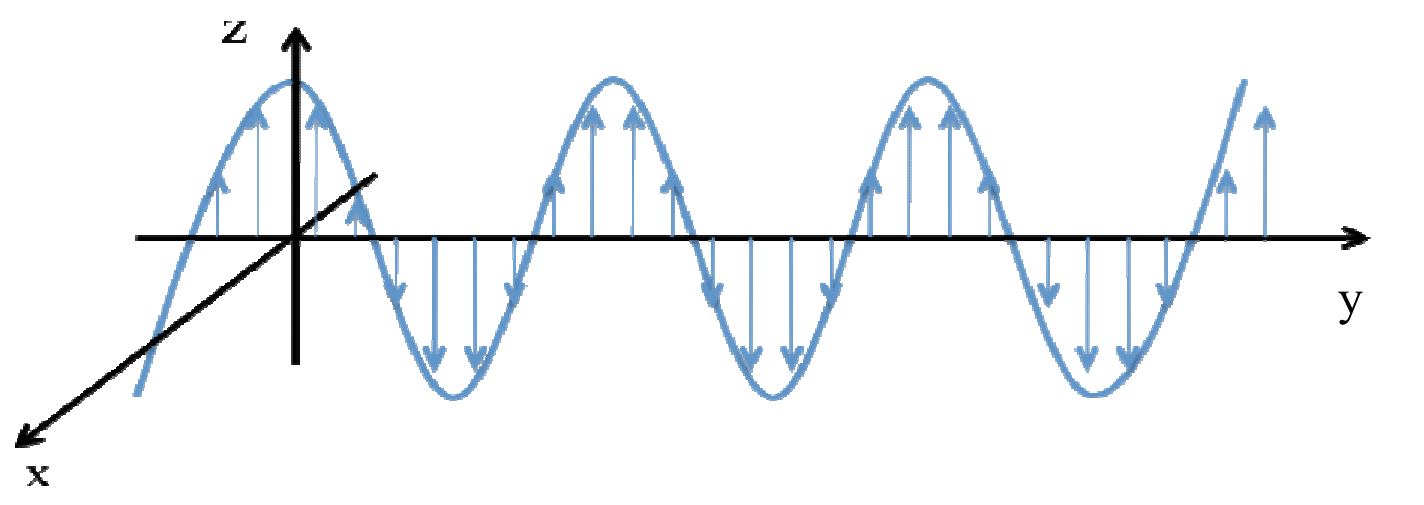
If the direction of the electric field remains in time oscillating along a single line, the wave is said to be linearly polarized, or simply, polarized. See Figure 2.1.
A polarizing film (or simply, a polarizer) is a material with a privileged axis parallel to its surface, such that, transmitted light emerges polarized along the axis of the polarizer. Call (+) the privileged axis and (-) the perpendicular one.
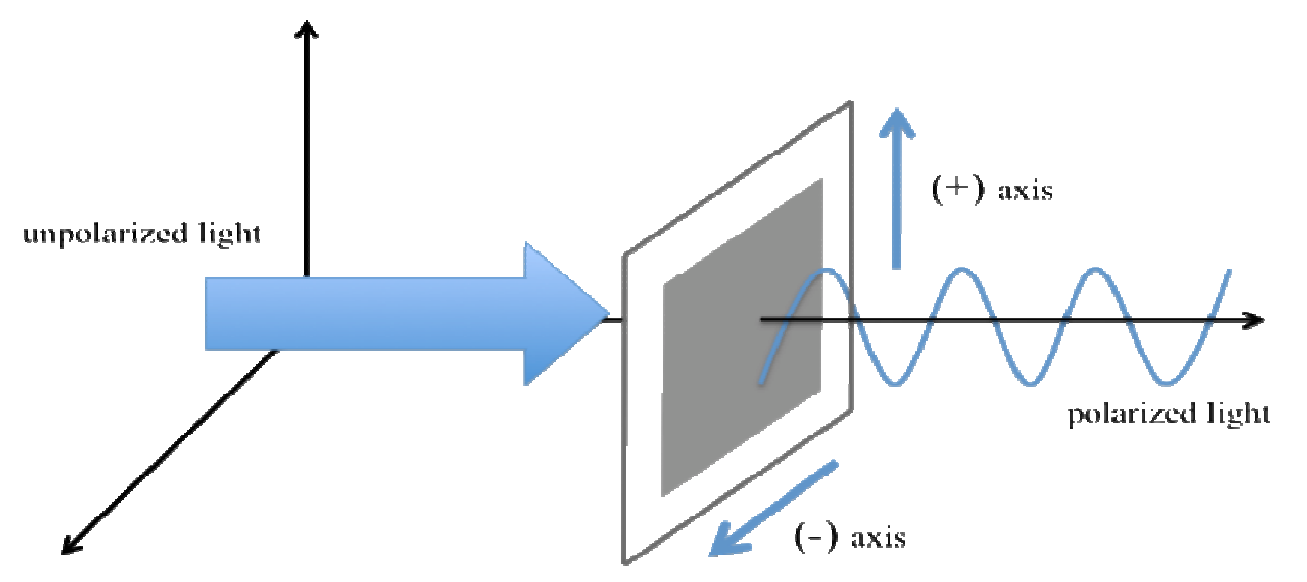
Common transparent materials (such as window glass), transmit light with the same polarization as the incident one, because its index of refraction does not depend on the direction and/or polarization of the incident wave. Many crystals, including mica, however, are sensitive to the direction of the electric field of the wave. For propagation perpendicular to its surface, the mica sheet has two characteristic orthogonal axes, which we will call Axis 1 and Axis 2. This leads to the phenomenon called birefringence.
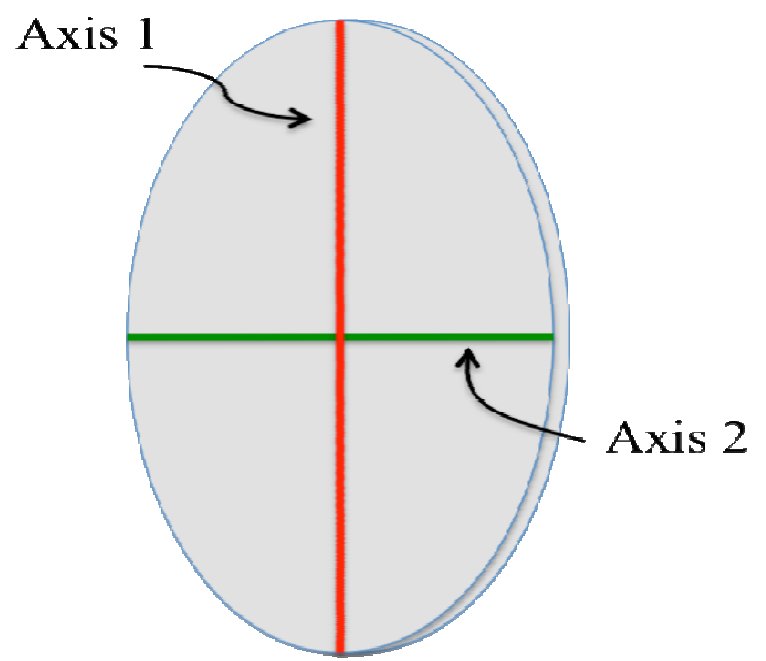
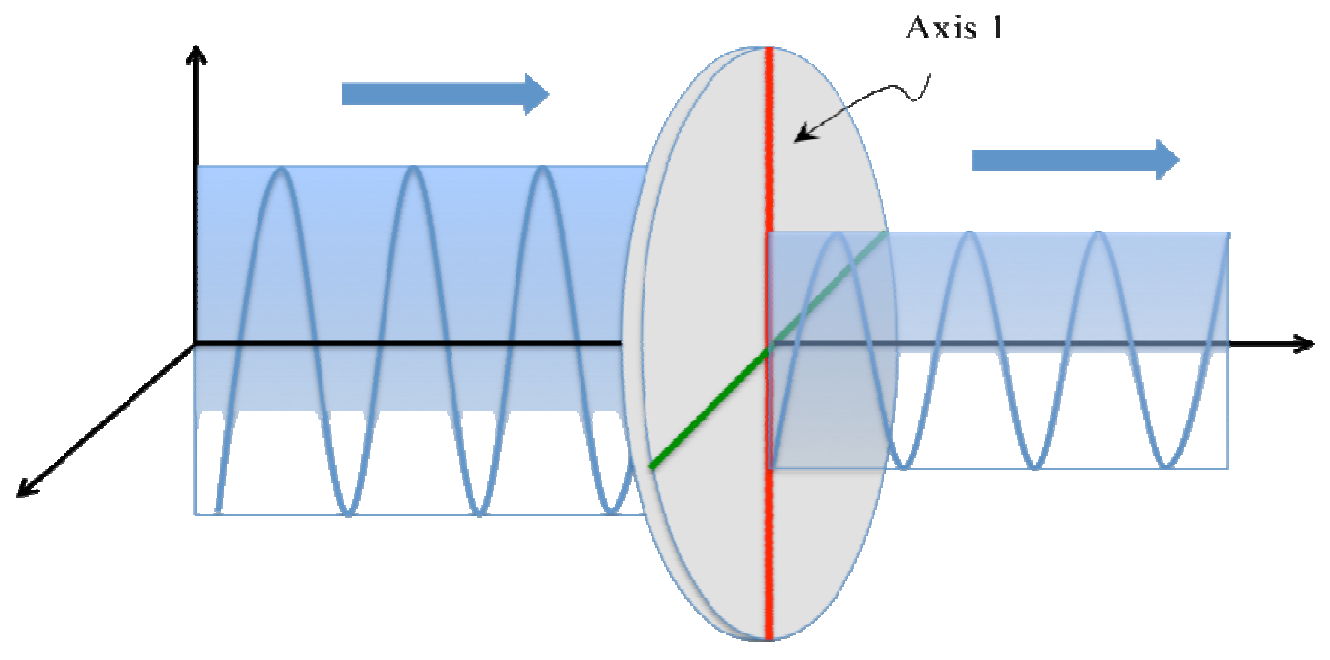
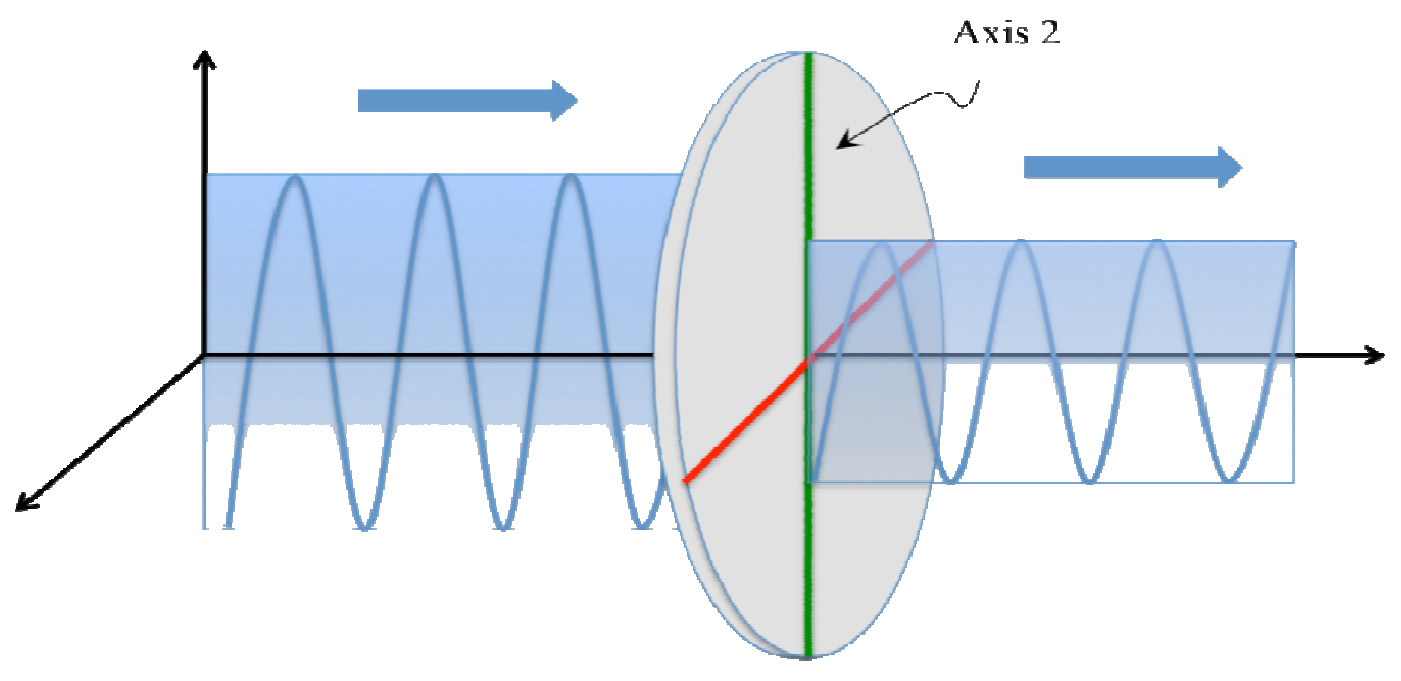
Let us analyze two simple cases to exemplify the birefringence. Assume that a wave polarized in the vertical direction is normally incident on one of the surfaces of the thin slab of mica.
Case 1) Axis 1 or Axis 2 is parallel to the polarization of the incident wave. The transmitted wave passes without changing its polarization state, but the propagation is characterized as if the material had either an index of refraction or . See Figs. 2.4 and 2.5.
Case 2) Axis 1 makes an angle with the direction of polarization of the incident wave. The transmitted light has a more complicated polarization state. This wave, however, can be seen as the superposition of two waves with different phases, one that has polarization parallel to the polarization of the incident wave (i.e. "vertical") and another that has polarization perpendicular to the polarization of the incident wave (i.e. "horizontal").
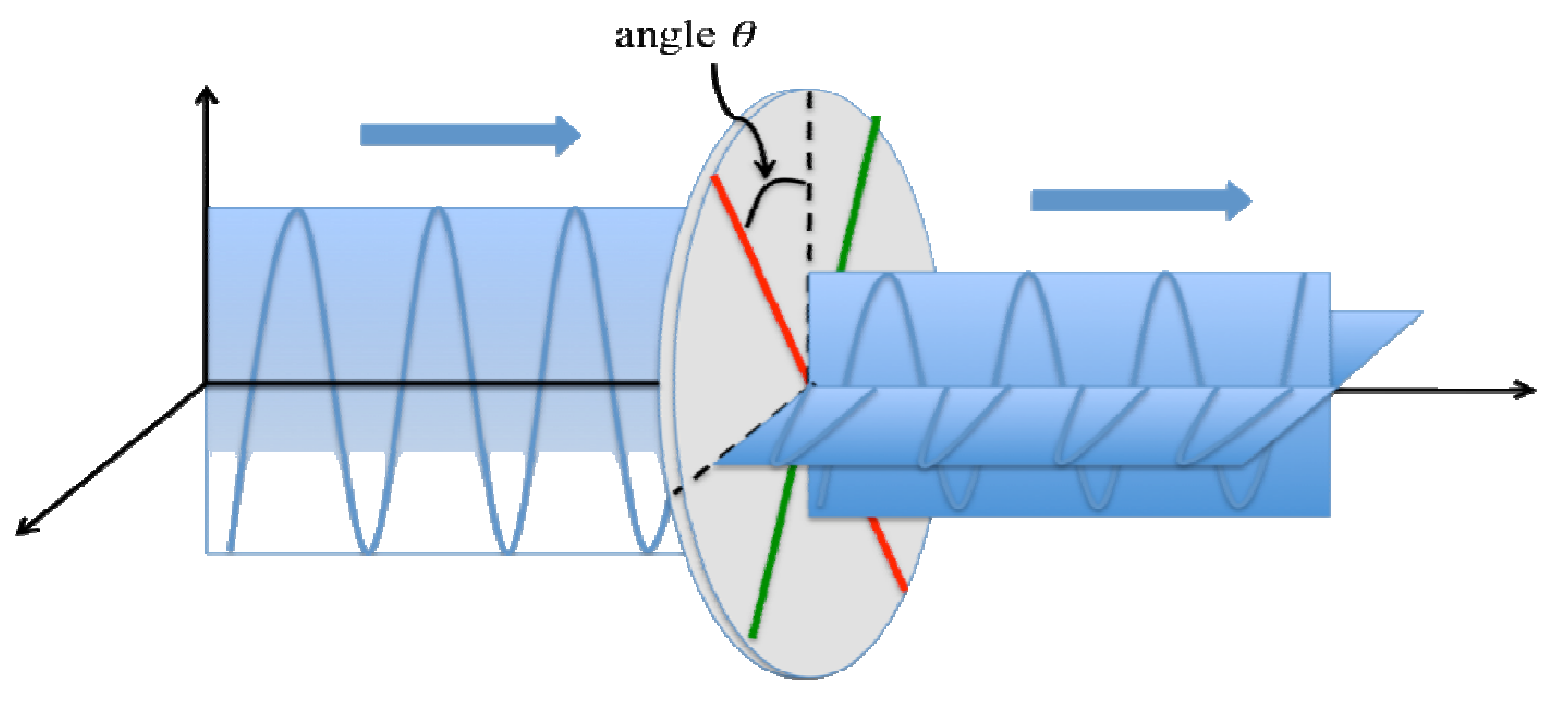
Call the intensity of the wave transmitted parallel to the polarization of the incident wave, and the intensity of the wave transmitted perpendicular to polarization of the incident wave. These intensities depend on the angle , on the wavelength of the light source, on the thickness of the thin plate, and on the absolute value of the difference of the refractive indices, . This last quantity is called the birefringence of the material. The measurement of this quantity is the goal of this problem. Together with polarizers, birefringent materials are useful for the control of light polarization states.
We point out here that the photodetector measures the intensity of the light incident on it, independent of its polarization.
The dependence of and on the angle is complicated due to other effects not considered, such as the absorption of the incident radiation by the mica. One can obtain, however, approximated but very simple expressions for the normalized intensities and , defined as,
and
It can be shown that the normalized intensities are (approximately) given by,
and
where is the difference of phases of the parallel and perpendicular transmitted waves. This quantity is given by,
where is the thickness of the thin plate of mica, the wavelength of the incident radiation and the birefringence.
EXPERIMENTAL SETUP (1 т.)
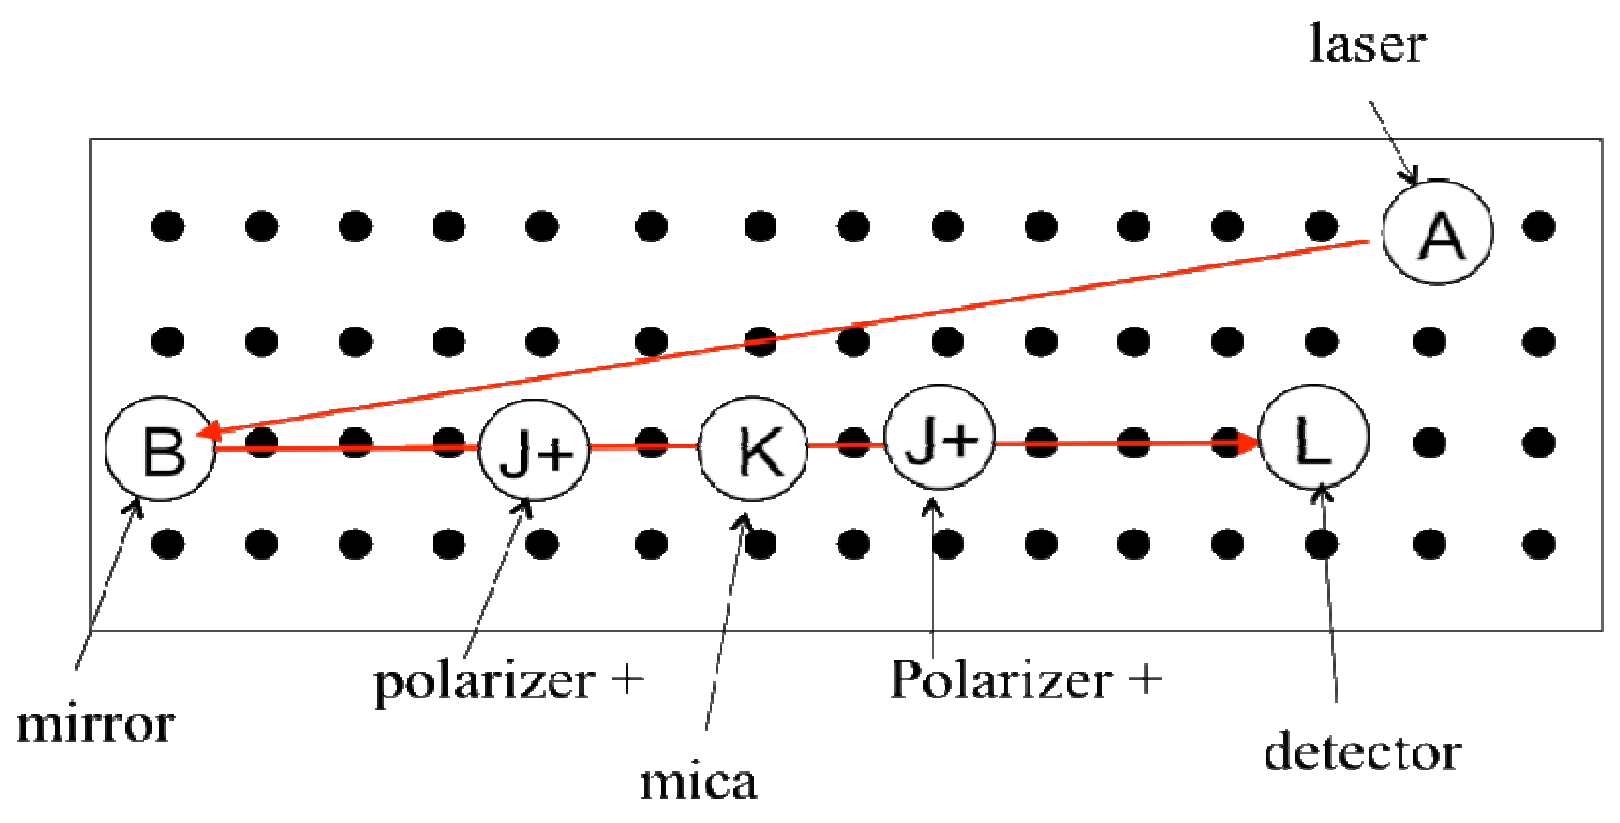
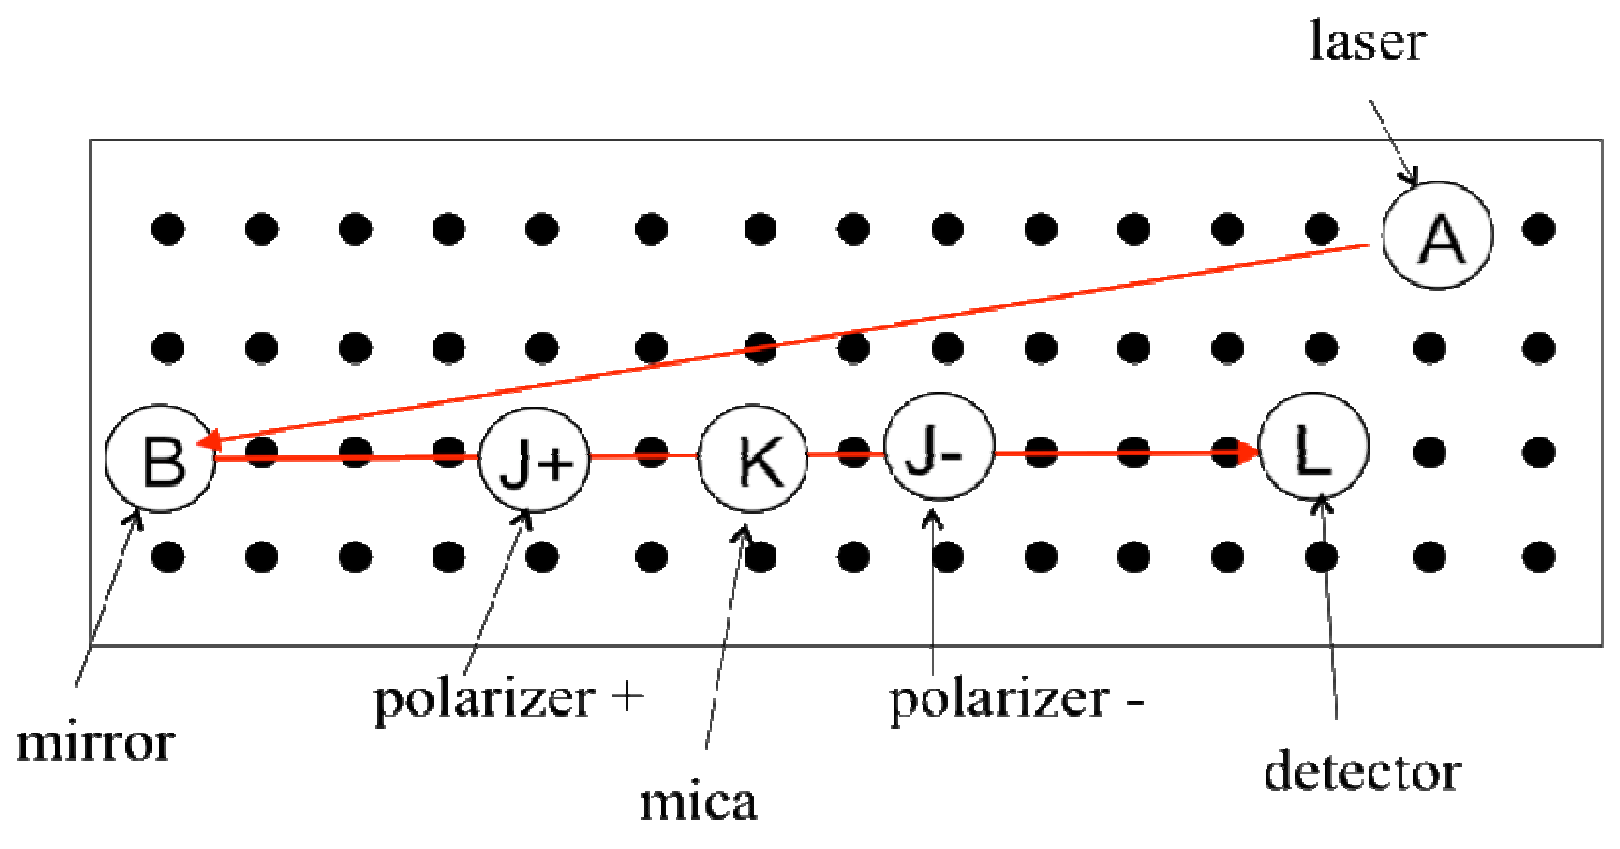
Task 2.1 Experimental setup for measuring intensities. Design an experimental setup for measuring the intensities and of the transmitted wave, as a function of the angle of any of the optical axes, as shown in Fig. 2.6. Do this by writing the LABELS of the different devices on the drawing of the optical table. Use the convention (+) and (-) for the direction of the polarizers. You can make additional simple drawings to help clarify your design.
Task 2.1 a) Setup for (0.5 points). [0,5 т.]
Task 2.1 b) Setup for (0.5 points). [0,5 т.]
Laser beam alignment. Align the laser beam in such a way that it is parallel to the table and is incident on the center of the cylinder holding the mica. You may align by using one the white index cards to follow the path. Small adjustments can be made with the movable mirror.
Photodetector and the multimeter. The photodetector produces a voltage as light impinges on it. Measure this voltage with the multimeter provided. The voltage produced is linearly proportional to the intensity of the light. Thus, report the intensities as the voltage produced by the photodetector. Without any laser beam incident on the photodetector, you can measure the background light intensity of the detector. This should be less than 1 mV. Do not correct for this background when you perform the intensity measurements.
WARNING: The laser beam is partially polarized but it is not known in which direction. Thus, to obtain polarized light with good intensity readings, place a polarizer with either its (+) or (–) axes vertically in such a way that you obtain the maximum transmitted intensity in the absence of any other optical device.
MEASURING INTENSITIES (4,25 т.)
Task 2.2 The scale for angle settings. The cylinder holding the mica has a regular graduation for settings of the angles. Write down the value in degrees of the smallest interval (i.e. between two black consecutive lines). (0.25 points). [0,25 т.]
Finding (approximately) the zero of and/or the location of the mica axes. To facilitate the analysis, it is very important that you find the appropriate zero of the angles. We suggest that, first, you identify the location of one of the mica axes, and call it Axis 1. It is almost sure that this position will not coincide with a graduation line on the cylinder. Thus, consider the nearest graduation line in the mica cylinder as the provisional origin for the angles. Call the angles measured from such an origin. Below you will be asked to provide a more accurate location of the zero of .
Task 2.3 Measuring and . Measure the intensities and for as many angles as you consider necessary. Report your measurements in Table I. Try to make the measurements for and for the same setting of the cylinder with the mica, that is, for a fixed angle . (3.0 points). [3 т.]
Task 2.4 Finding an appropriate zero for . The location of Axis 1 defines the zero of the angle . As mentioned above, it is mostly sure that the location of Axis 1 does not coincide with a graduation line on the mica cylinder. To find the zero of the angles, you may proceed either graphically or numerically. Recognize that the relationship near a maximum or a minimum may be approximated by a parabola where:
and the minimum or maximum of the parabola is given by,
Either of the above choices gives rise to a shift of all your values of given in Table I of Task 2.3, such that they can now be written as angles from the appropriate zero, . Write down the value of the shift in degrees. (1.0 points). [1 т.]
DATA ANALYSIS. (4,75 т.)
Task 2.5 Choosing the appropriate variables. Choose or to make an analysis to find the difference of phases . Identify the variables that you will use. (0.5 point). [0,5 т.]
Task 2.6 Data analysis and the phase difference.
- Use Table II to write down the values of the variables needed for their analysis. Make sure that you use the corrected values for the angles . Include uncertainties. Use graph paper to plot your variables. (1.0 points).
- Perform an analysis of the data needed to obtain the phase difference . Report your results including uncertainties. Write down any equations or formulas used in the analysis. Plot your results. (1.75 points).
- Calculate the value of the phase difference in radians, including its uncertainty. Find the value of the phase difference in the interval . (0.5 points). [3,25 т.]
Task 2.7 Calculating the birefringence . You may note that if you add to the phase difference , with N any integer, or if you change the sign of the phase, the values of the intensities are unchanged. However, the value of the birefringence would change. Thus, to use the value found in Task 2.6 to correctly calculate the birefringence, you must consider the following:
or
where the value of the thickness of the slab of mica you used is written on the cylinder holding it. This number is given in micrometers (1 micrometer = m). Assign as the uncertainty for . For the laser wavelength, you may use the value you found in Problem 1 or the average value between m and m, the reported range for red in the visible spectrum. Write down the values of and as well as the birefringence with its uncertainty. Include the formulas that you used to calculate the uncertainties. (1.0 points). [1 т.]
Отговори
MEASURING INTENSITIES, Task 2.2 3.6 degrees
MEASURING INTENSITIES, Task 2.4 -0.7 degrees
Sample result of the official solution (numerical analysis); the graphical analysis in the official solution gives -1.0 degrees. The value depends on the student's setting.
DATA ANALYSIS., Task 2.6 2.54 rad
Official sample result ; depends on the individual mica plate.
DATA ANALYSIS., Task 2.7 0.00394
Official sample result (graphical analysis: ); the solution states the birefringence is between 0.003 and 0.005, nominal value 0.004.
Решение
Answer Form
Experimental Problem No. 2
Birefringence of mica
Task 2.1 a) Experimental setup for . (0.5 points)
Task 2.1 b) Experimental setup for . (0.5 points)
2.1 — 1.0
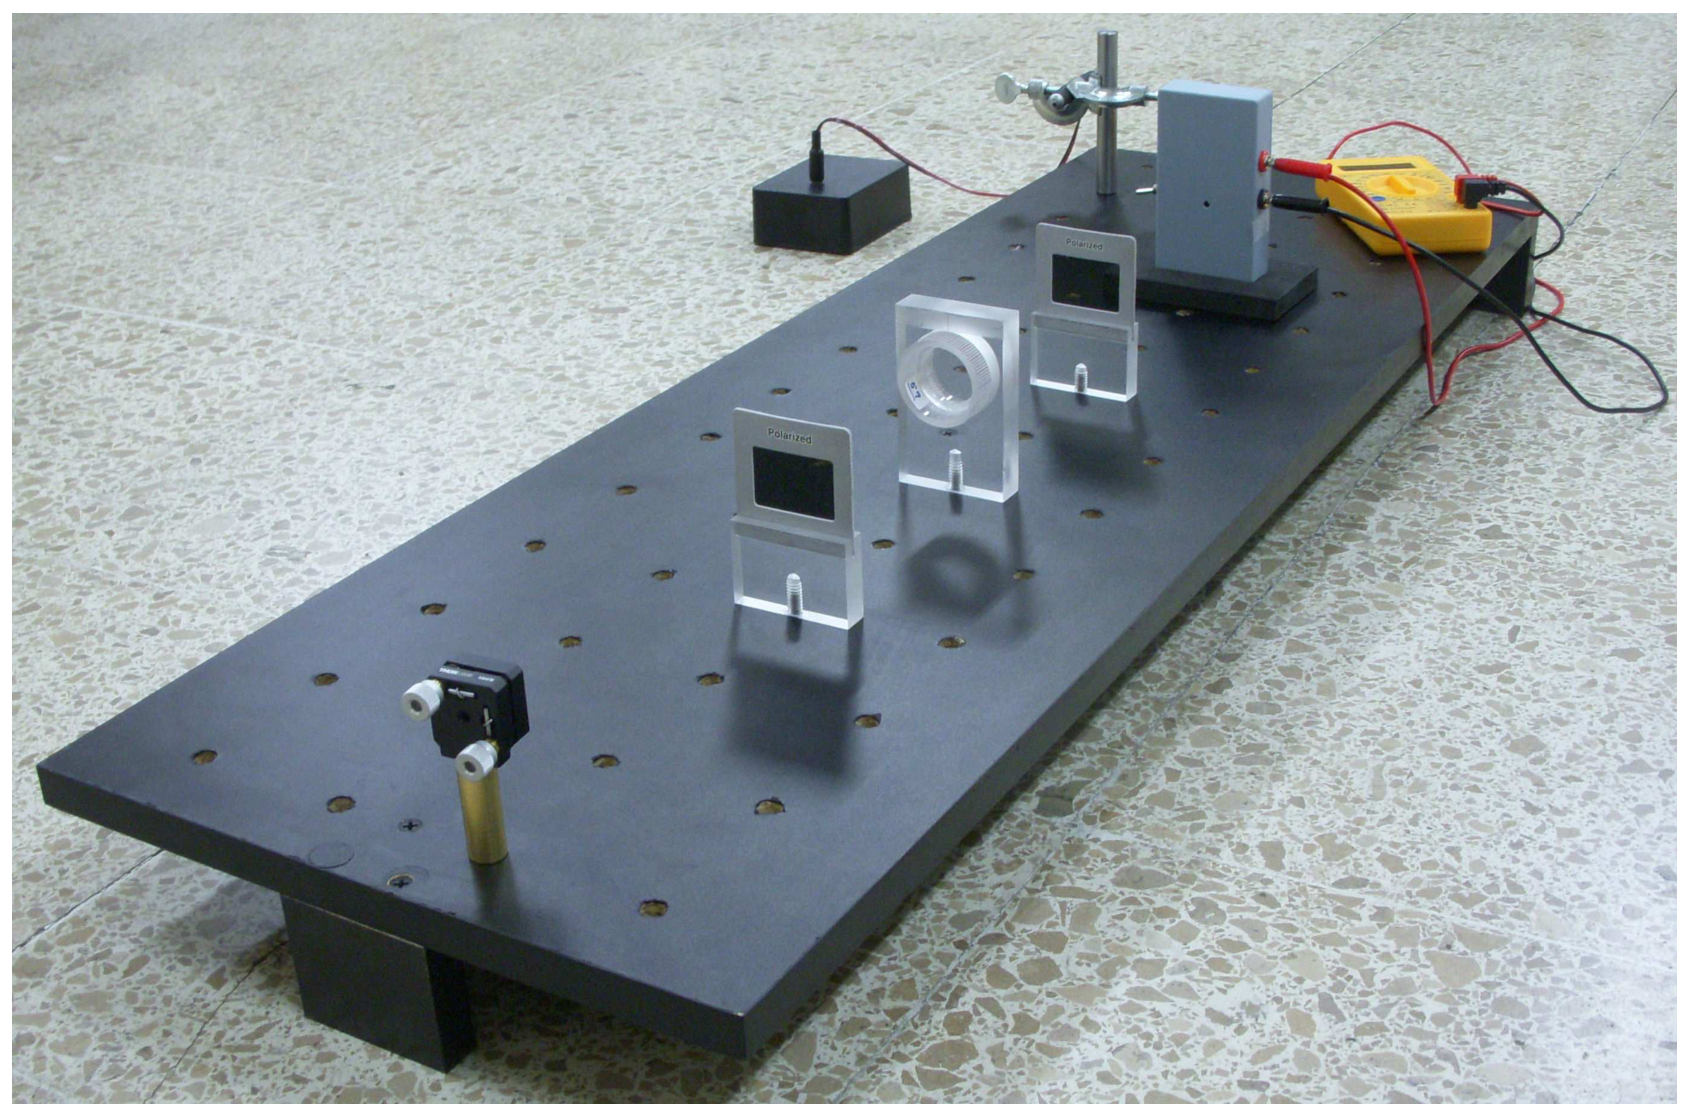
Experimental setup for measurement of mica birefringence
Task 2.2 The scale for angles.
2.2 — 0.25
The angle between two consecutive black lines is
degrees because there are 100 lines.
Tasks 2.3 Measuring and .Use additional sheets if necessary.
TABLE I (3 points)
| (degrees) | ||
|---|---|---|
| -3.6 | 46.4 | 1.1 |
| 0 | 48.1 | 0.2 |
| 3.6 | 47.0 | 0.6 |
| 7.2 | 46.0 | 2.0 |
| 10.8 | 42.3 | 4.9 |
| 14.4 | 38.2 | 9.0 |
| 18.0 | 33.9 | 12.5 |
| 21.6 | 27.7 | 17.9 |
| 25.2 | 23.4 | 22.0 |
| 28.8 | 17.8 | 27.0 |
| 32.4 | 12.5 | 31.7 |
| 36.0 | 8.8 | 34.8 |
| 39.6 | 5.2 | 38.0 |
| 43.2 | 3.6 | 39.4 |
| 46.8 | 3.2 | 39.6 |
| 50.4 | 4.5 | 38.7 |
| 54.0 | 6.9 | 36.6 |
| 57.6 | 10.3 | 33.6 |
| 61.2 | 14.7 | 29.4 |
| 64.8 | 20.1 | 24.7 |
| 68.4 | 25.4 | 19.7 |
| 72.0 | 30.5 | 14.7 |
| 75.6 | 36.6 | 10.2 |
| 79.2 | 40.7 | 6.1 |
| 82.8 | 44.3 | 3.2 |
| 86.4 | 46.9 | 1.0 |
| 90.0 | 47.8 | 0.2 |
| 93.6 | 47.0 | 0.4 |
| 97.2 | 45.7 | 2.0 |
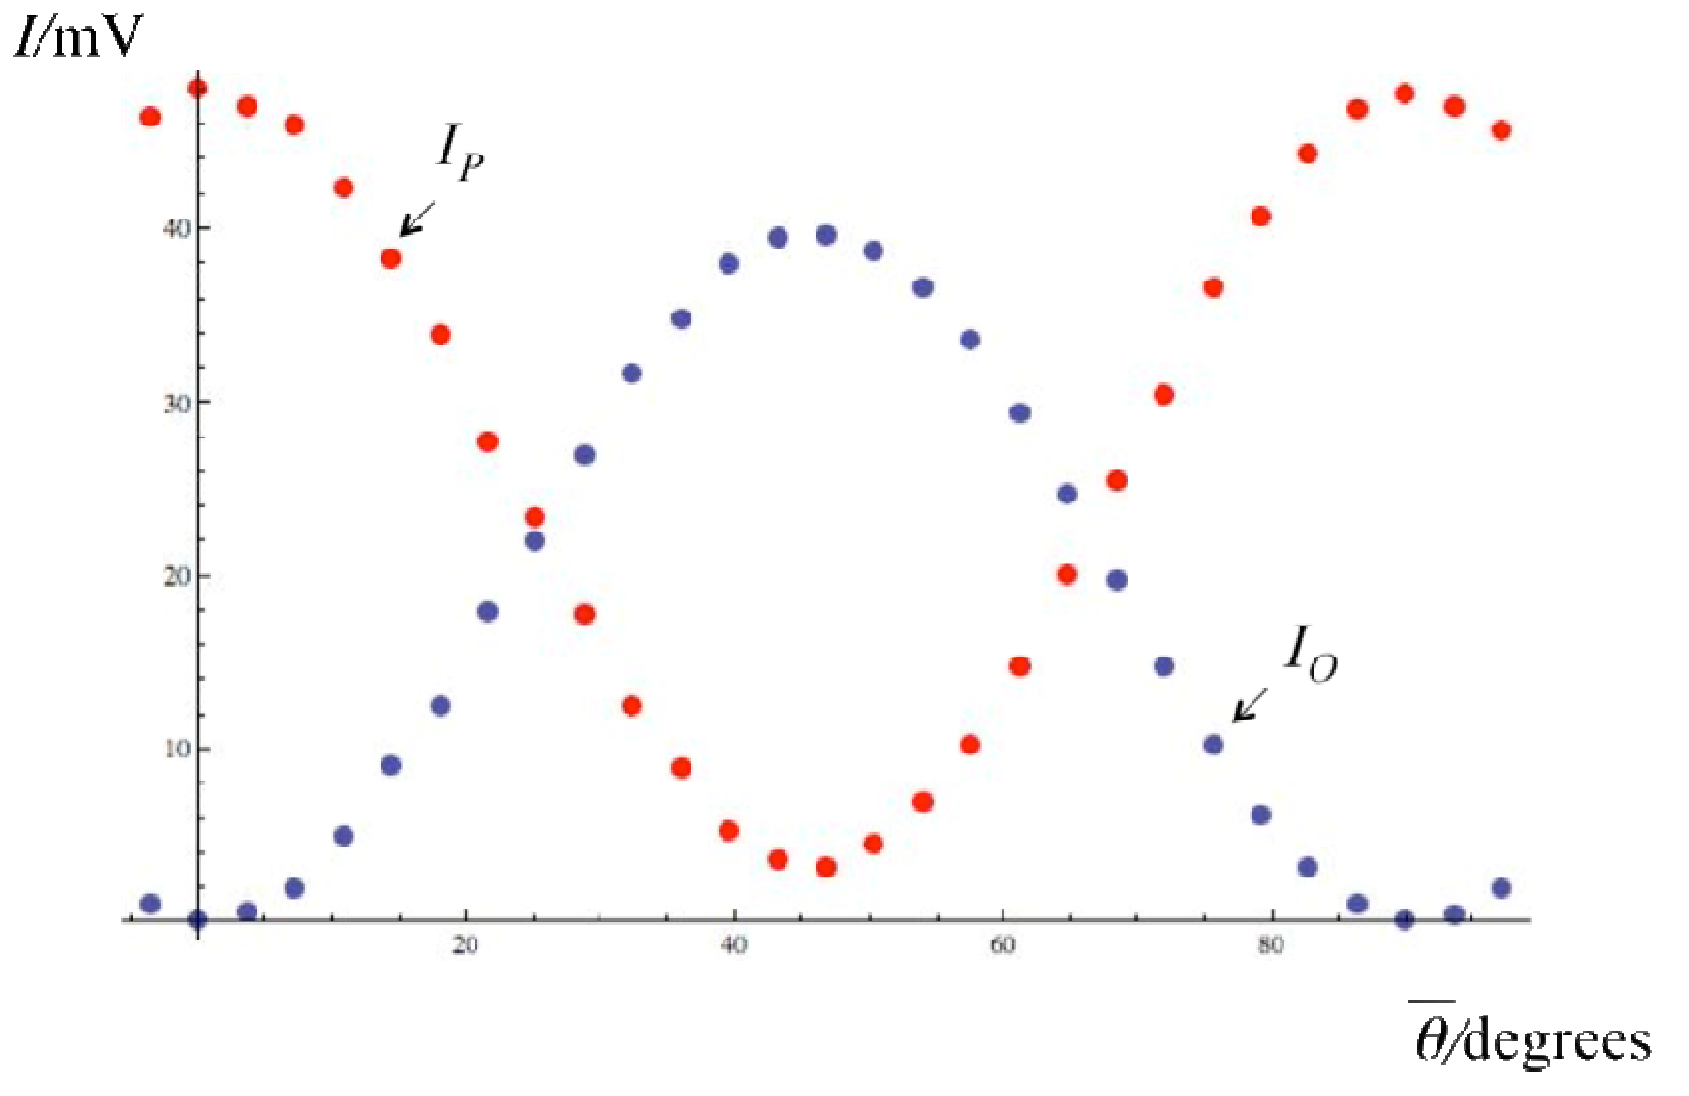
Parallel and perpendicular intensities vs angle .
GRAPH NOT REQUIRED!
Task 2.4 Finding an appropriate zero for .
2.4 — 1.0
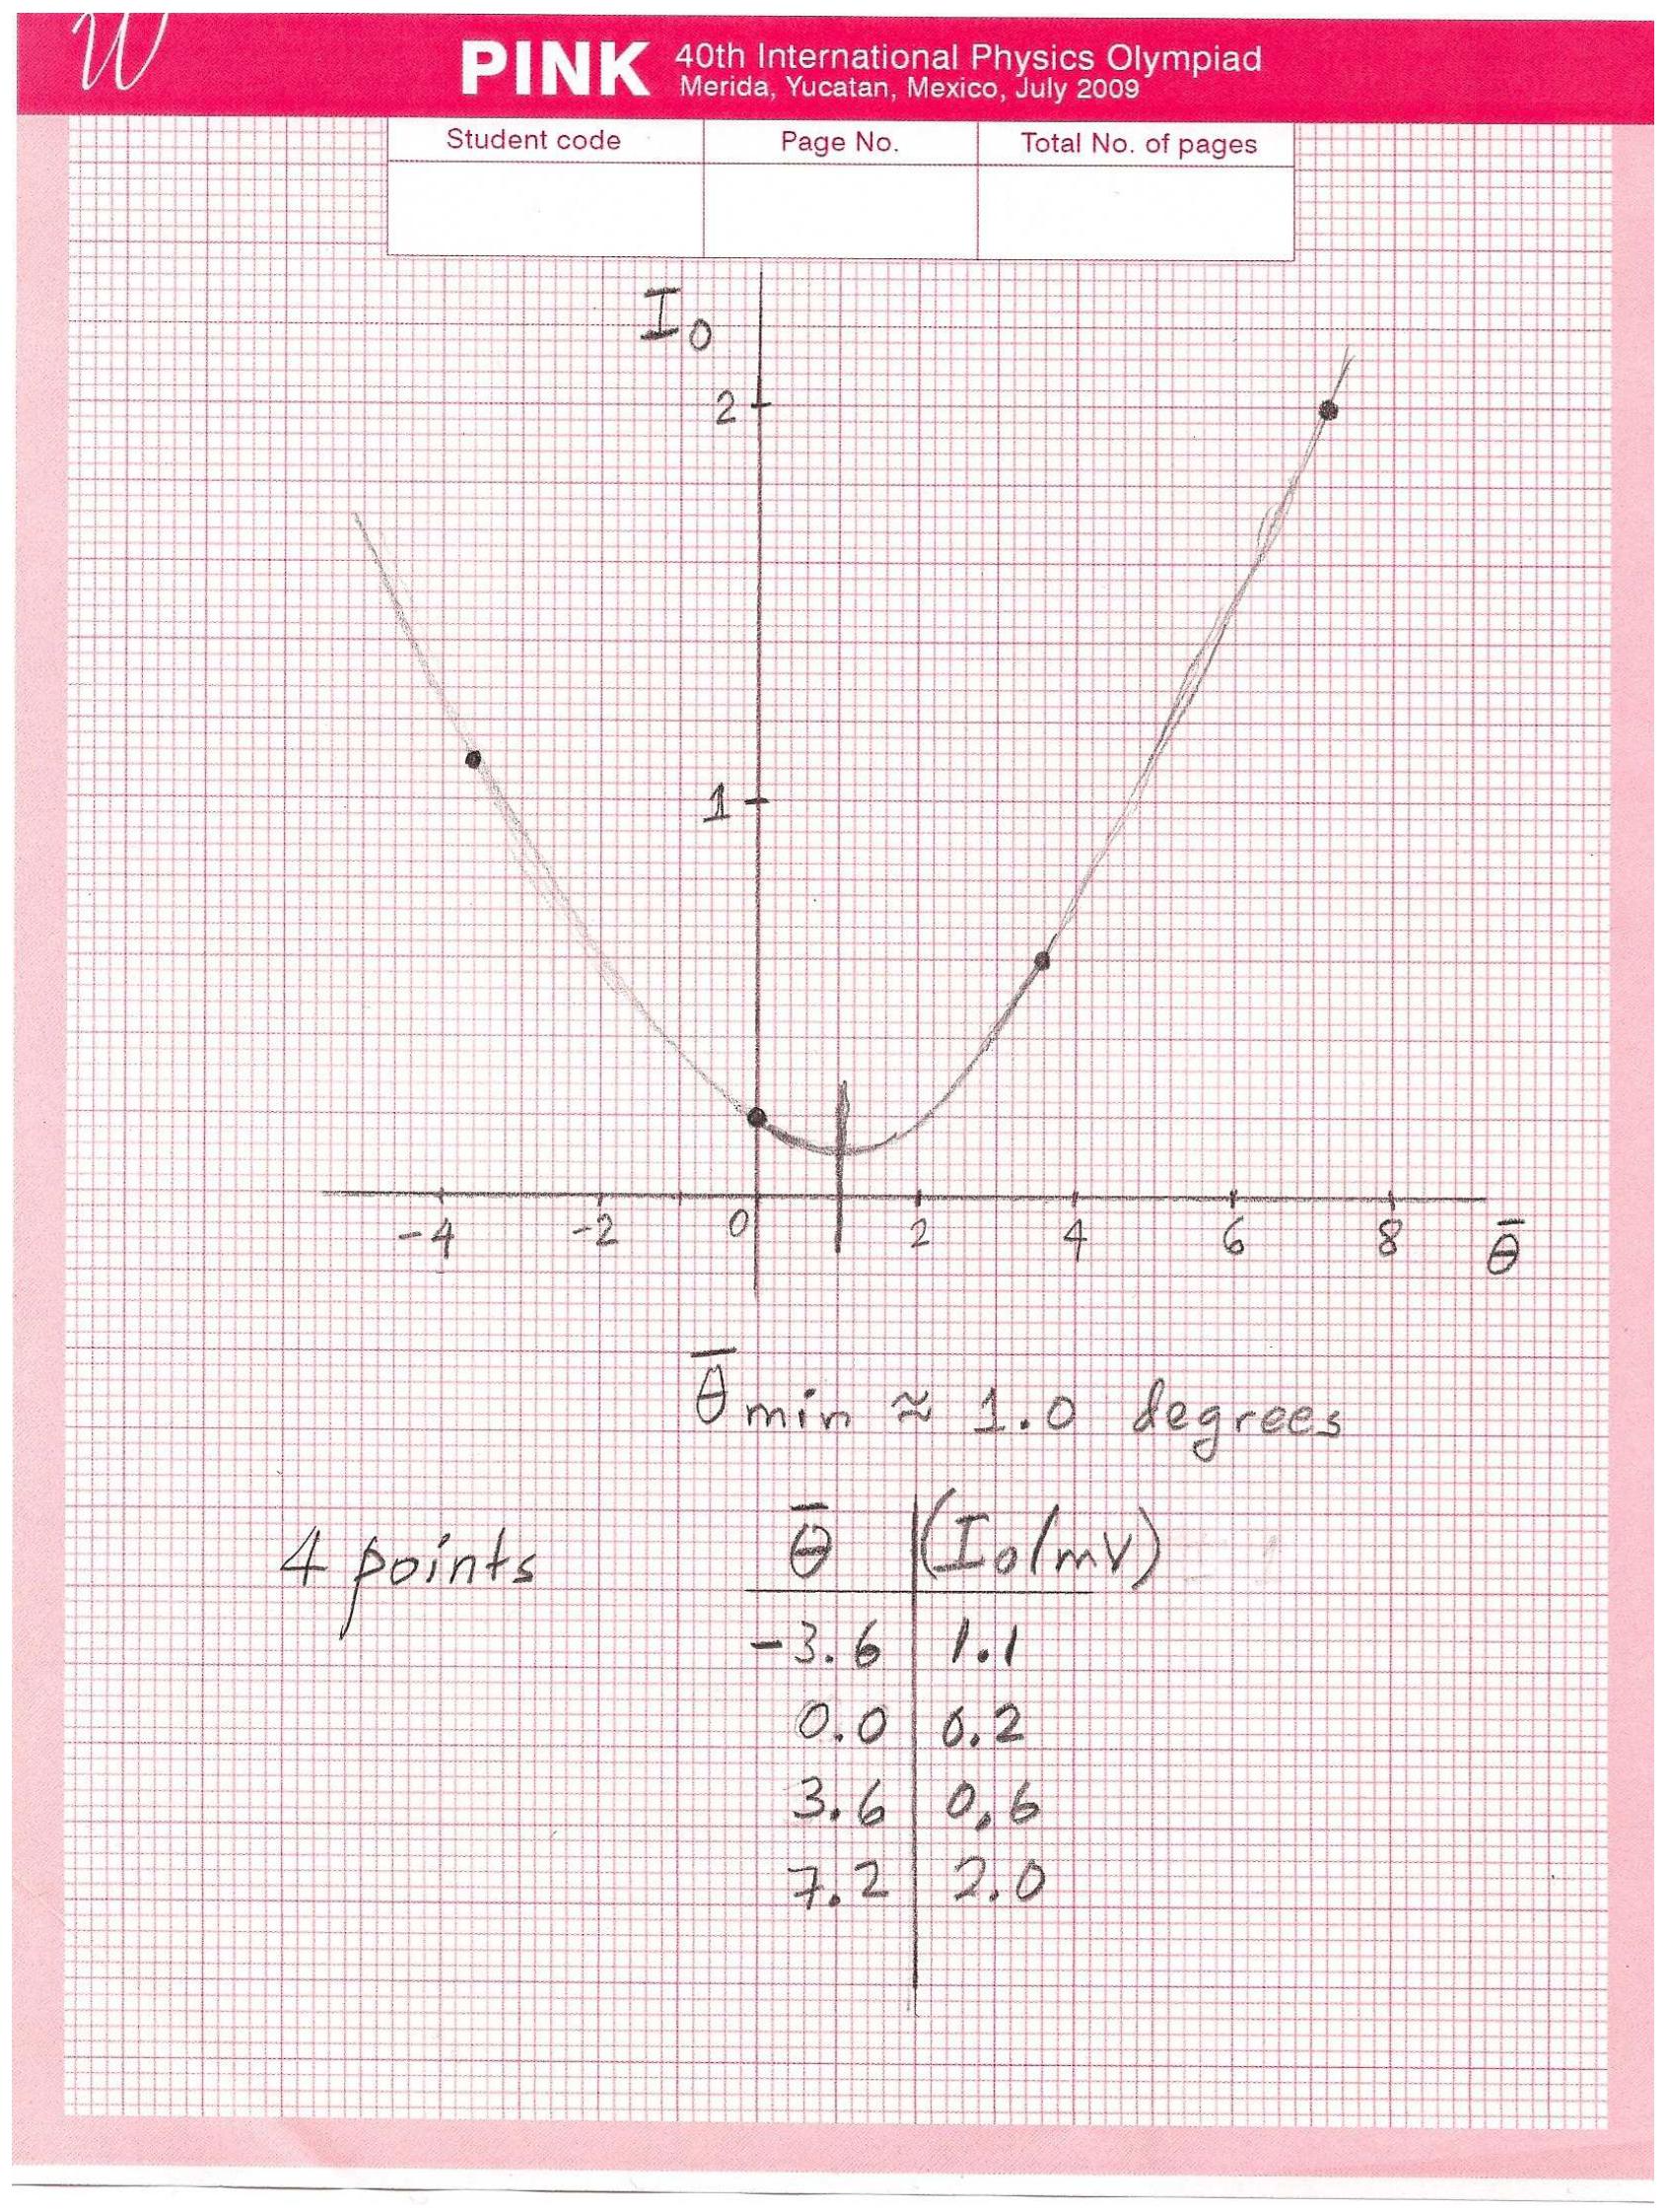
a) Graphical analysis
The value for the shift is degrees.
Add the graph paper with the analysis of this Task.
b) Numerical analysis
From Table I choose the first three points of and :
(intensities in millivolts)
We want to fit . This gives three equations:
second in first
in third
The minimum of the parabola is at:
Therefore, degrees.
Task 2.5 Choosing the appropriate variables.
2.5 — 0.5
Equation (2.4) for the perpendicular intensity is
This can be cast as a straight line , with
from which the phase may be obtained.
NOTE: This is not the only way to obtain the phase difference. One may, for instance, analyze the 4 maxima of either or .
Task 2.6 Statistical analysis and the phase difference.
2.6 — 1.0
To perform the statistical analysis, we shall then use
Since for , we use only 12 pairs of data points to cover this range, as given in Table II.
x may be left without uncertainty since it is a setting. The uncertainty in y may be calculated as
approximately the same for all values.
TABLE II
| (degrees) | ||
|---|---|---|
| 2.9 | 0.010 | 0.013 |
| 6.5 | 0.051 | 0.042 |
| 10.1 | 0.119 | 0.104 |
| 13.7 | 0.212 | 0.191 |
| 17.3 | 0.322 | 0.269 |
| 20.9 | 0.444 | 0.392 |
| 24.5 | 0.569 | 0.484 |
| 28.1 | 0.690 | 0.603 |
| 31.7 | 0.799 | 0.717 |
| 35.3 | 0.890 | 0.798 |
| 38.9 | 0.955 | 0.880 |
| 42.5 | 0.992 | 0.916 |
2.6 — 1.75
We now perform a least square analysis for the variables y vs x in Table II. The slope and y-intercept are:
The formulas for this analysis are:
where
with N the number of data points.
The uncertainty is calculated as
with N = 12 in this example.
Include the accompanying plot or plots.
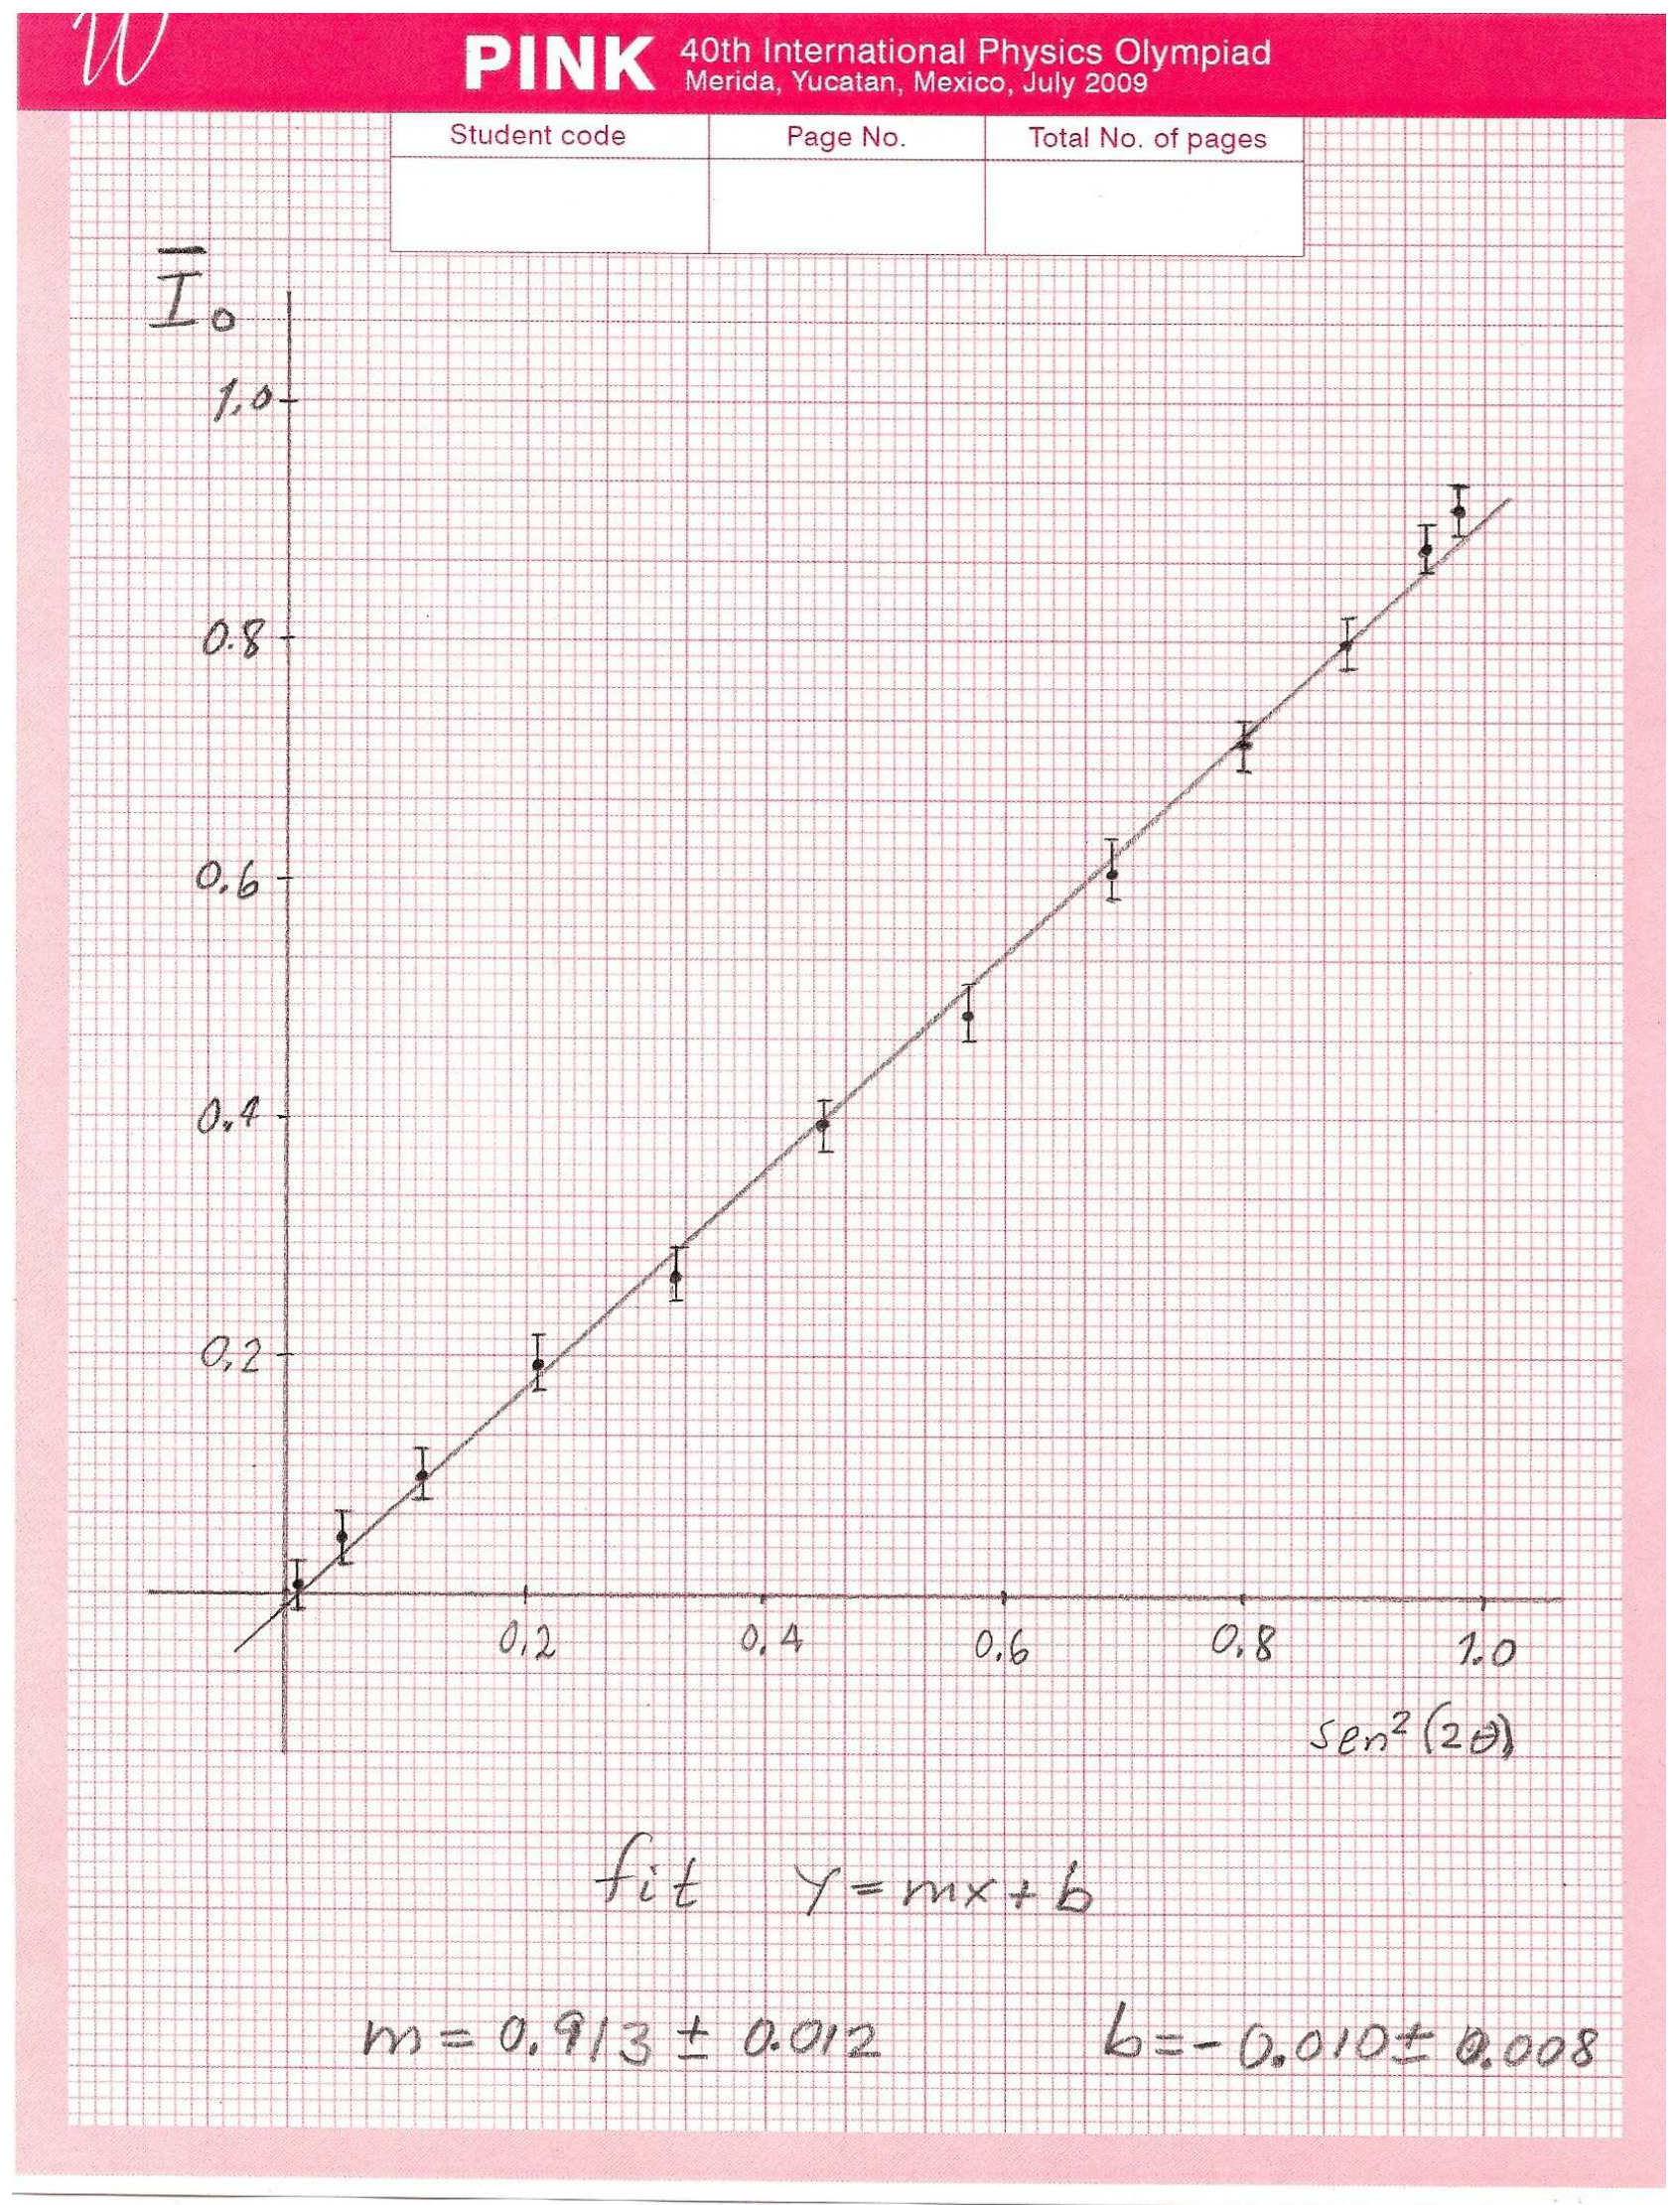
2.6 — 0.5
Calculate the value of the phase in radians in the interval .
From the slope , one finds
Write down the formulas for the calculation of the uncertainty.
We see that,
Task 2.7 Calculating the birefringence .
2.7 — 1.0
Write down the width of the slab of mica you used,
Write down the wavelength you use,
Calculate the birefringence
The birefringence is between 0.003 and 0.005. Nominal value 0.004
Write down the formulas you used for the calculation of the uncertainty of the birefringence.
Since the width micrometers, we use
The error is
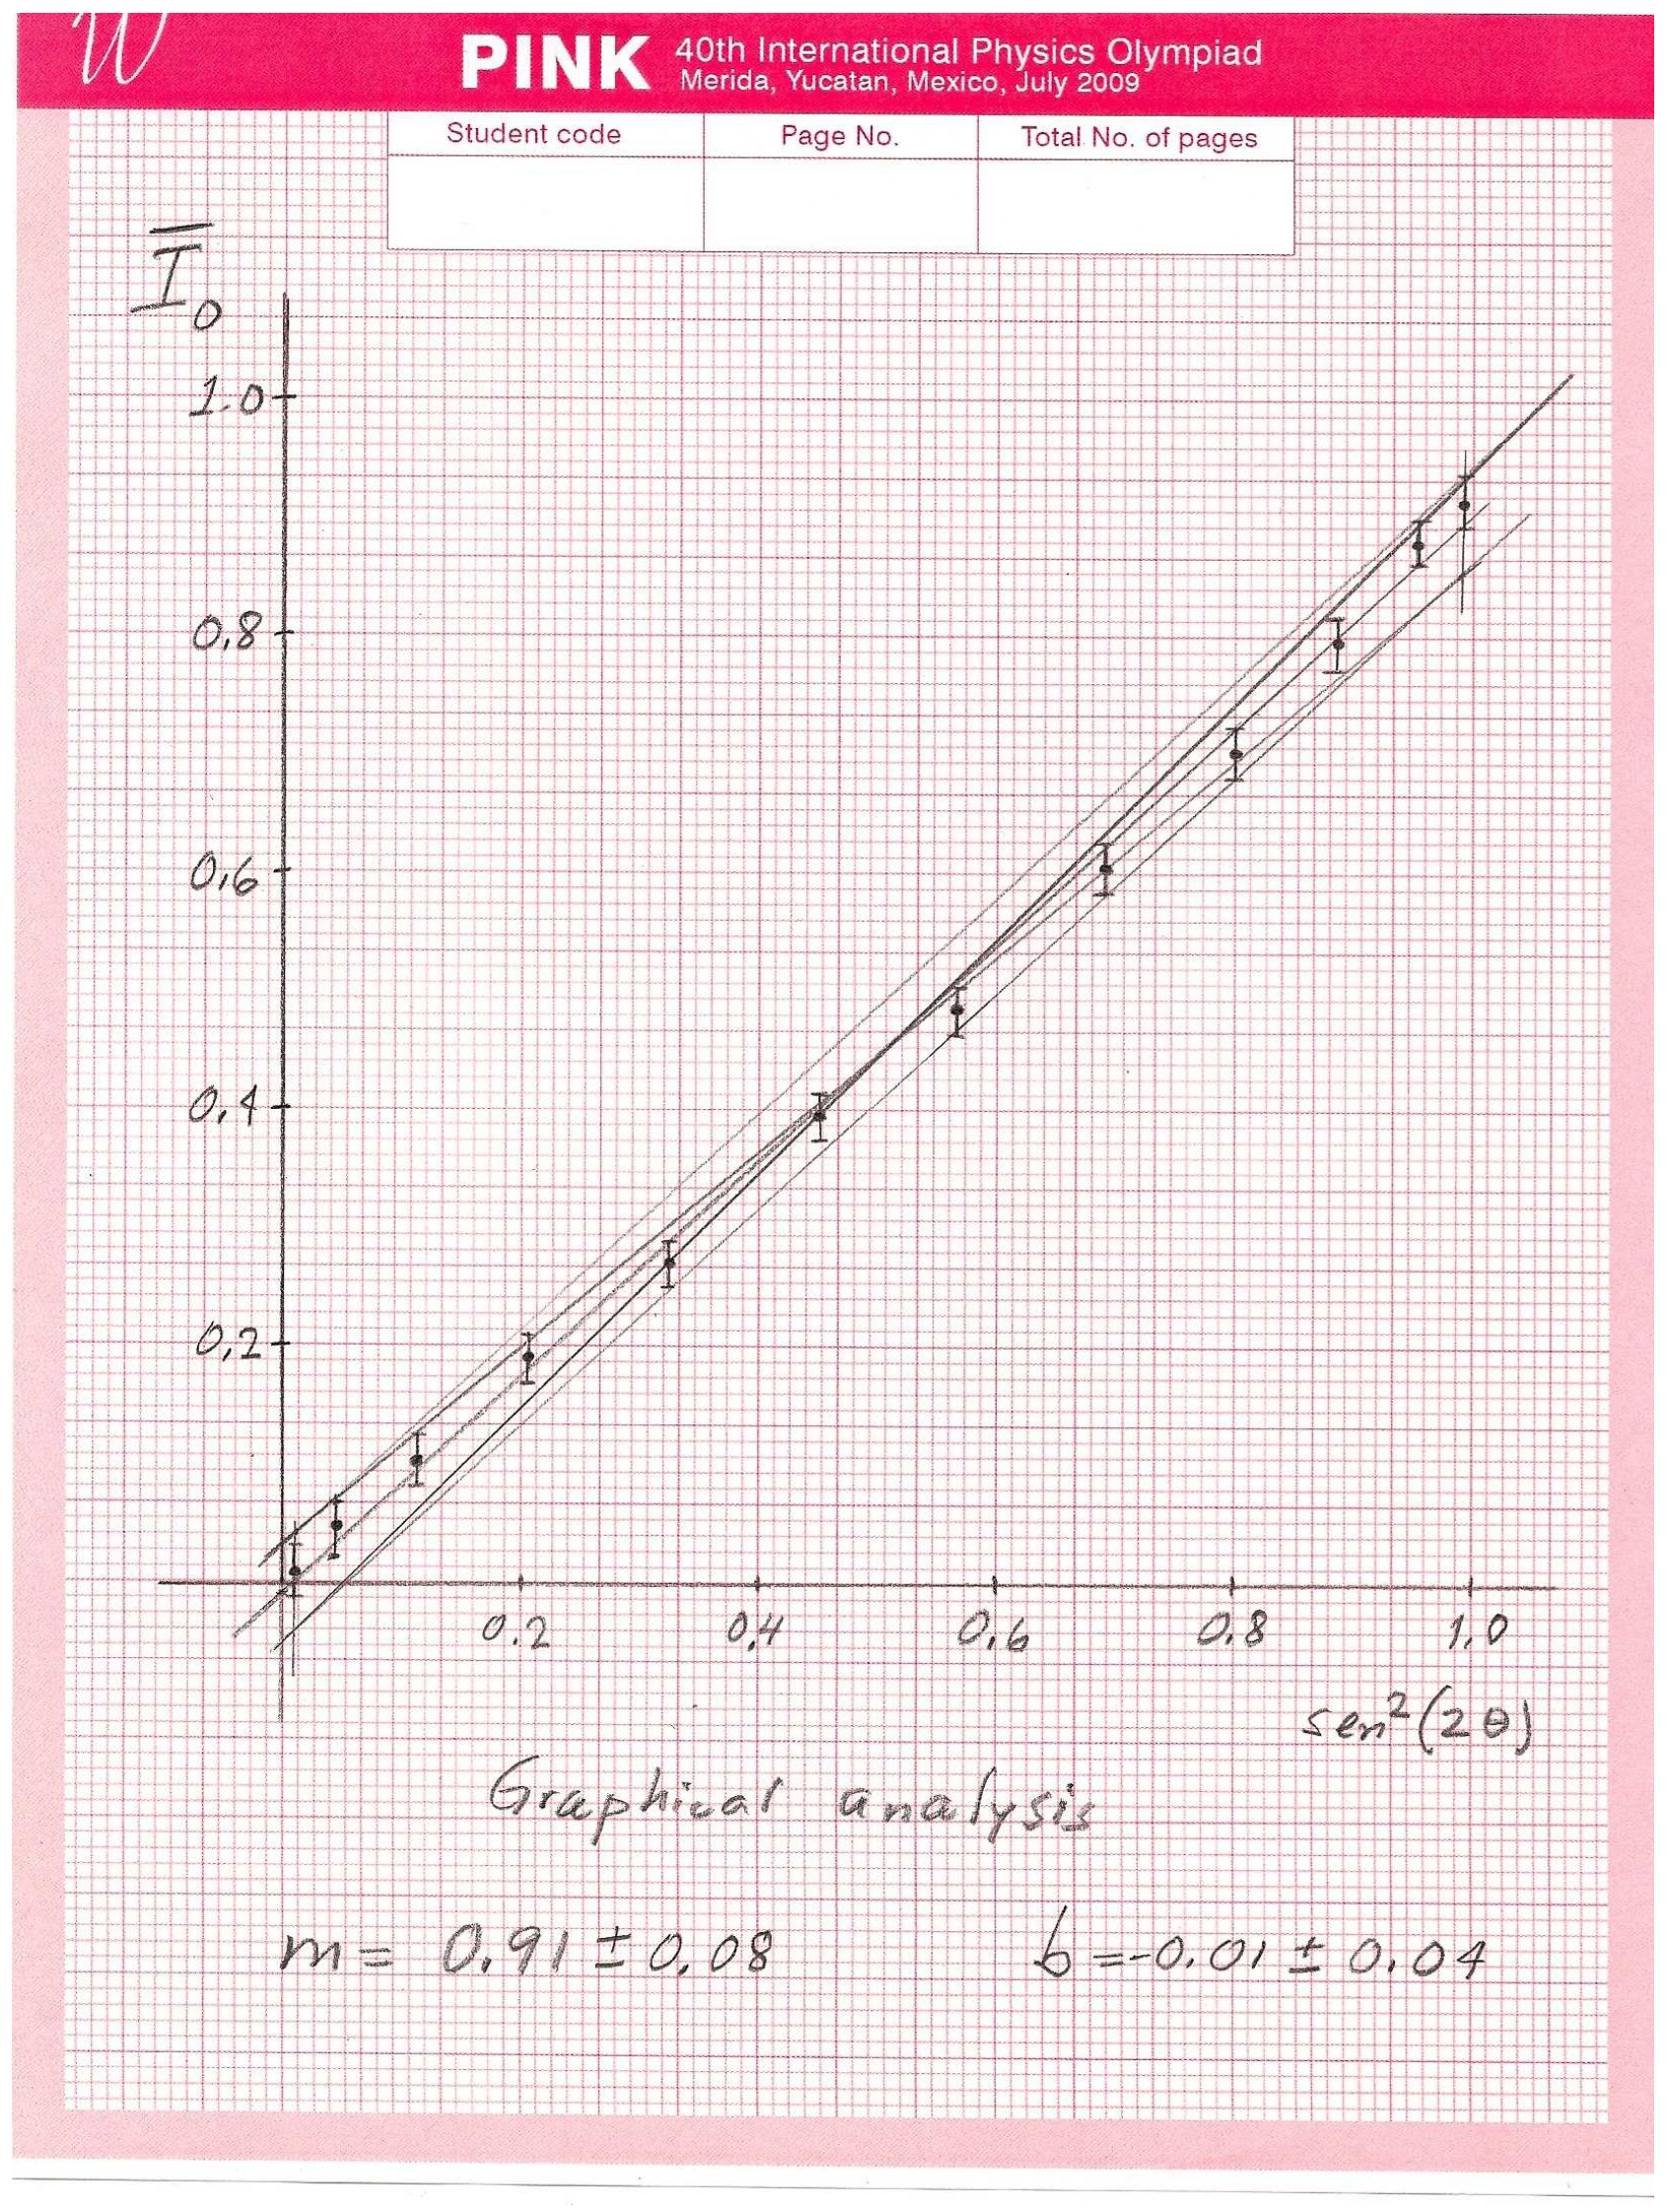
Since the data may appear somewhat disperse and/or the errors in the intensities may be large, a graphical analysis may be performed.
In the accompanying plot, it is exemplified a simple graphical analysis: first the main slope is found, then, using the largest deviations one can find two extreme slopes.
The final result is,
The calculation of the birefringence and its uncertainty follows as before. One now finds,
A larger (more realistic) error.
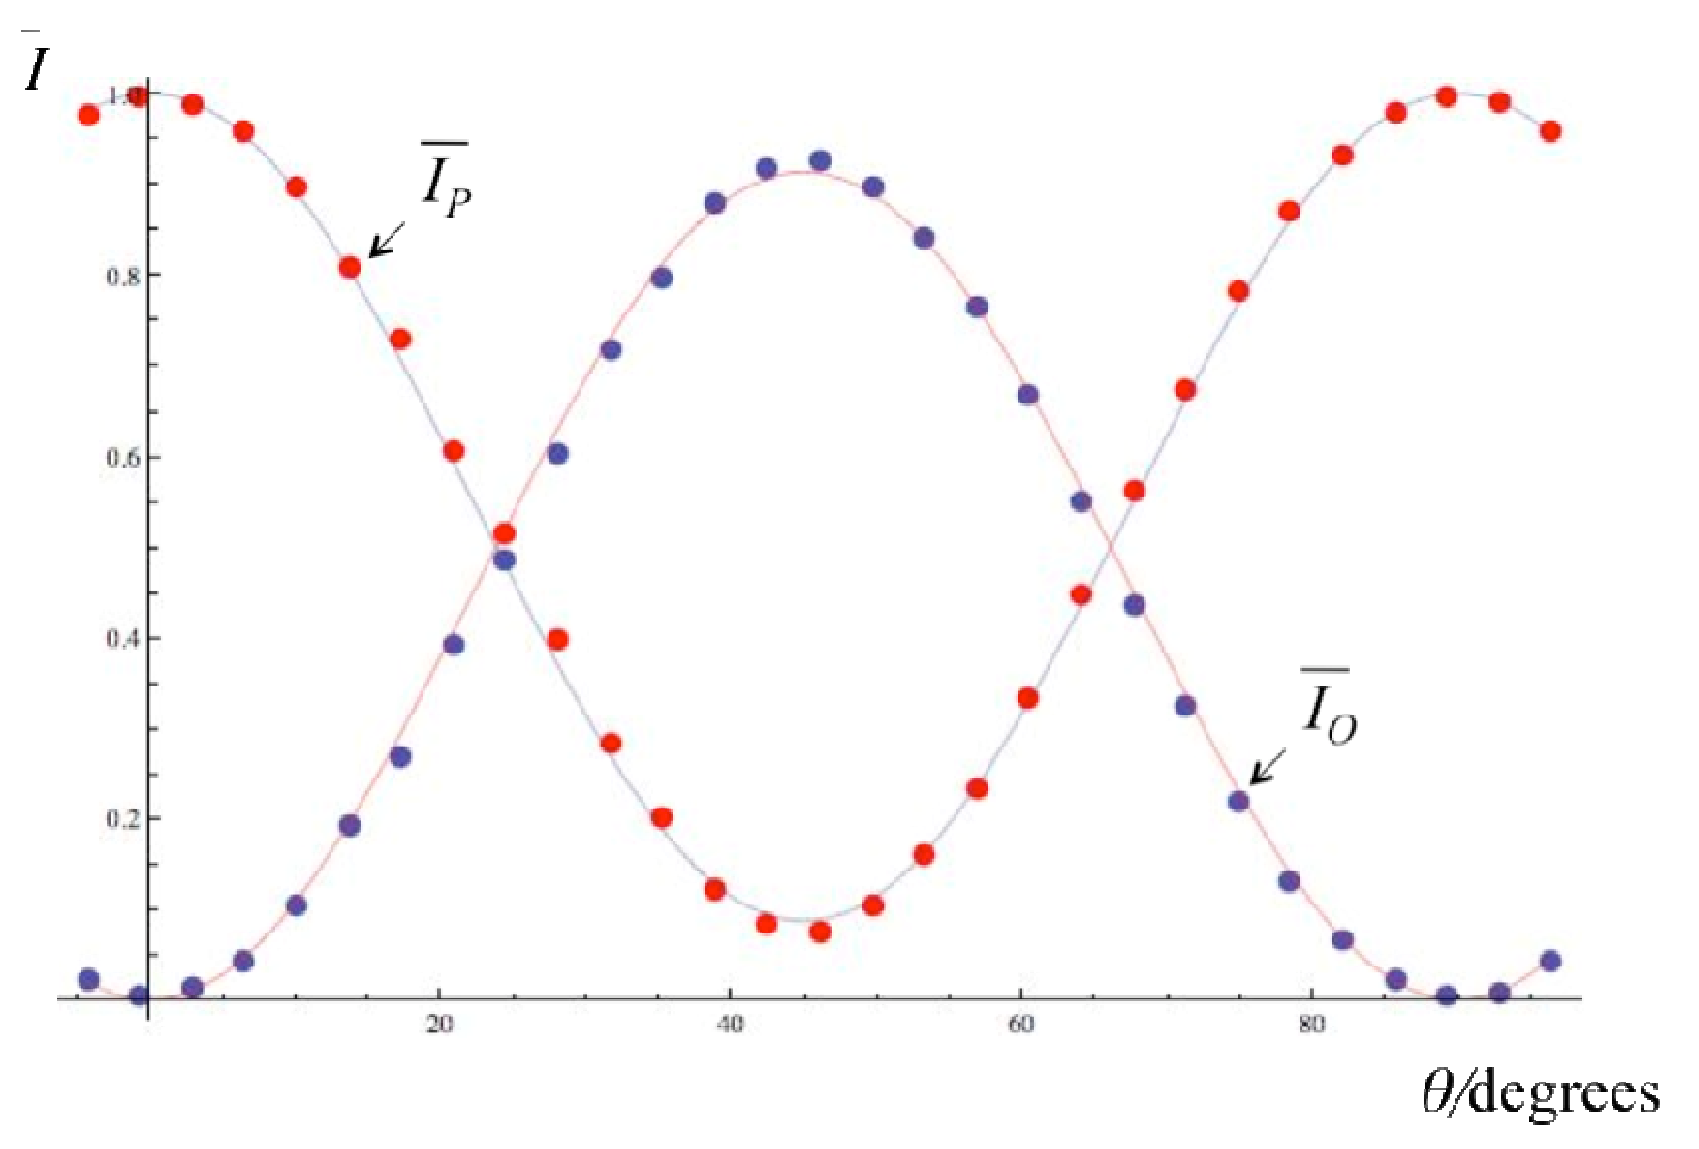
Comparison of experimental data (normalized intensities and ) with fitting (equations (2.3) and (2.4)) using the calculated value of the phase difference .
GRAPH NOT REQUIRED!
Оригинал в Архива: exp2.pdf · официални решения: exp2_sol.pdf