IPhO 2011, Експеримент — Задача 2. Mechanical Blackbox: a cylinder with a ball inside
Experimental Competition: 14 July 2011 — Problem 2 · 14 юли 2011 г.
Условие
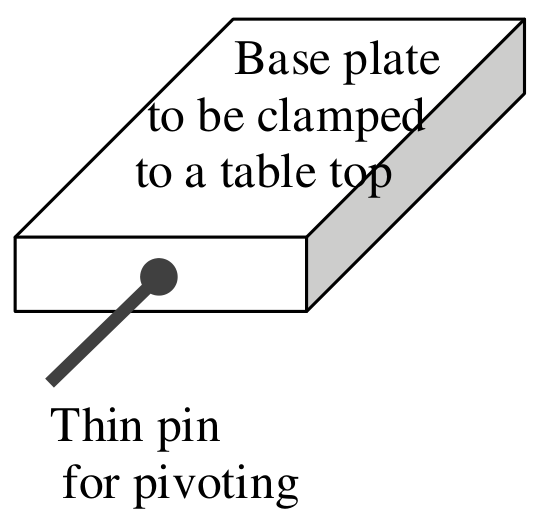
A small massive particle (ball) of mass is fixed at distance below the top of a long hollow cylinder of mass . A series of holes are drilled perpendicularly to the central axis of the cylinder. These holes are for pivoting so that the cylinder will hang in a vertical plane.
Students are required to perform necessary nondestructive measurements to determine the numerical values of the following with their error estimates:
i. position of centre of mass of cylinder with ball inside.
Also provide a schematic drawing of the experimental set-up for measuring the centre of mass. [1 т.]
ii. distance [3,5 т.]
iii. ratio . [3,5 т.]
iv. the acceleration due to gravity, . [2 т.]
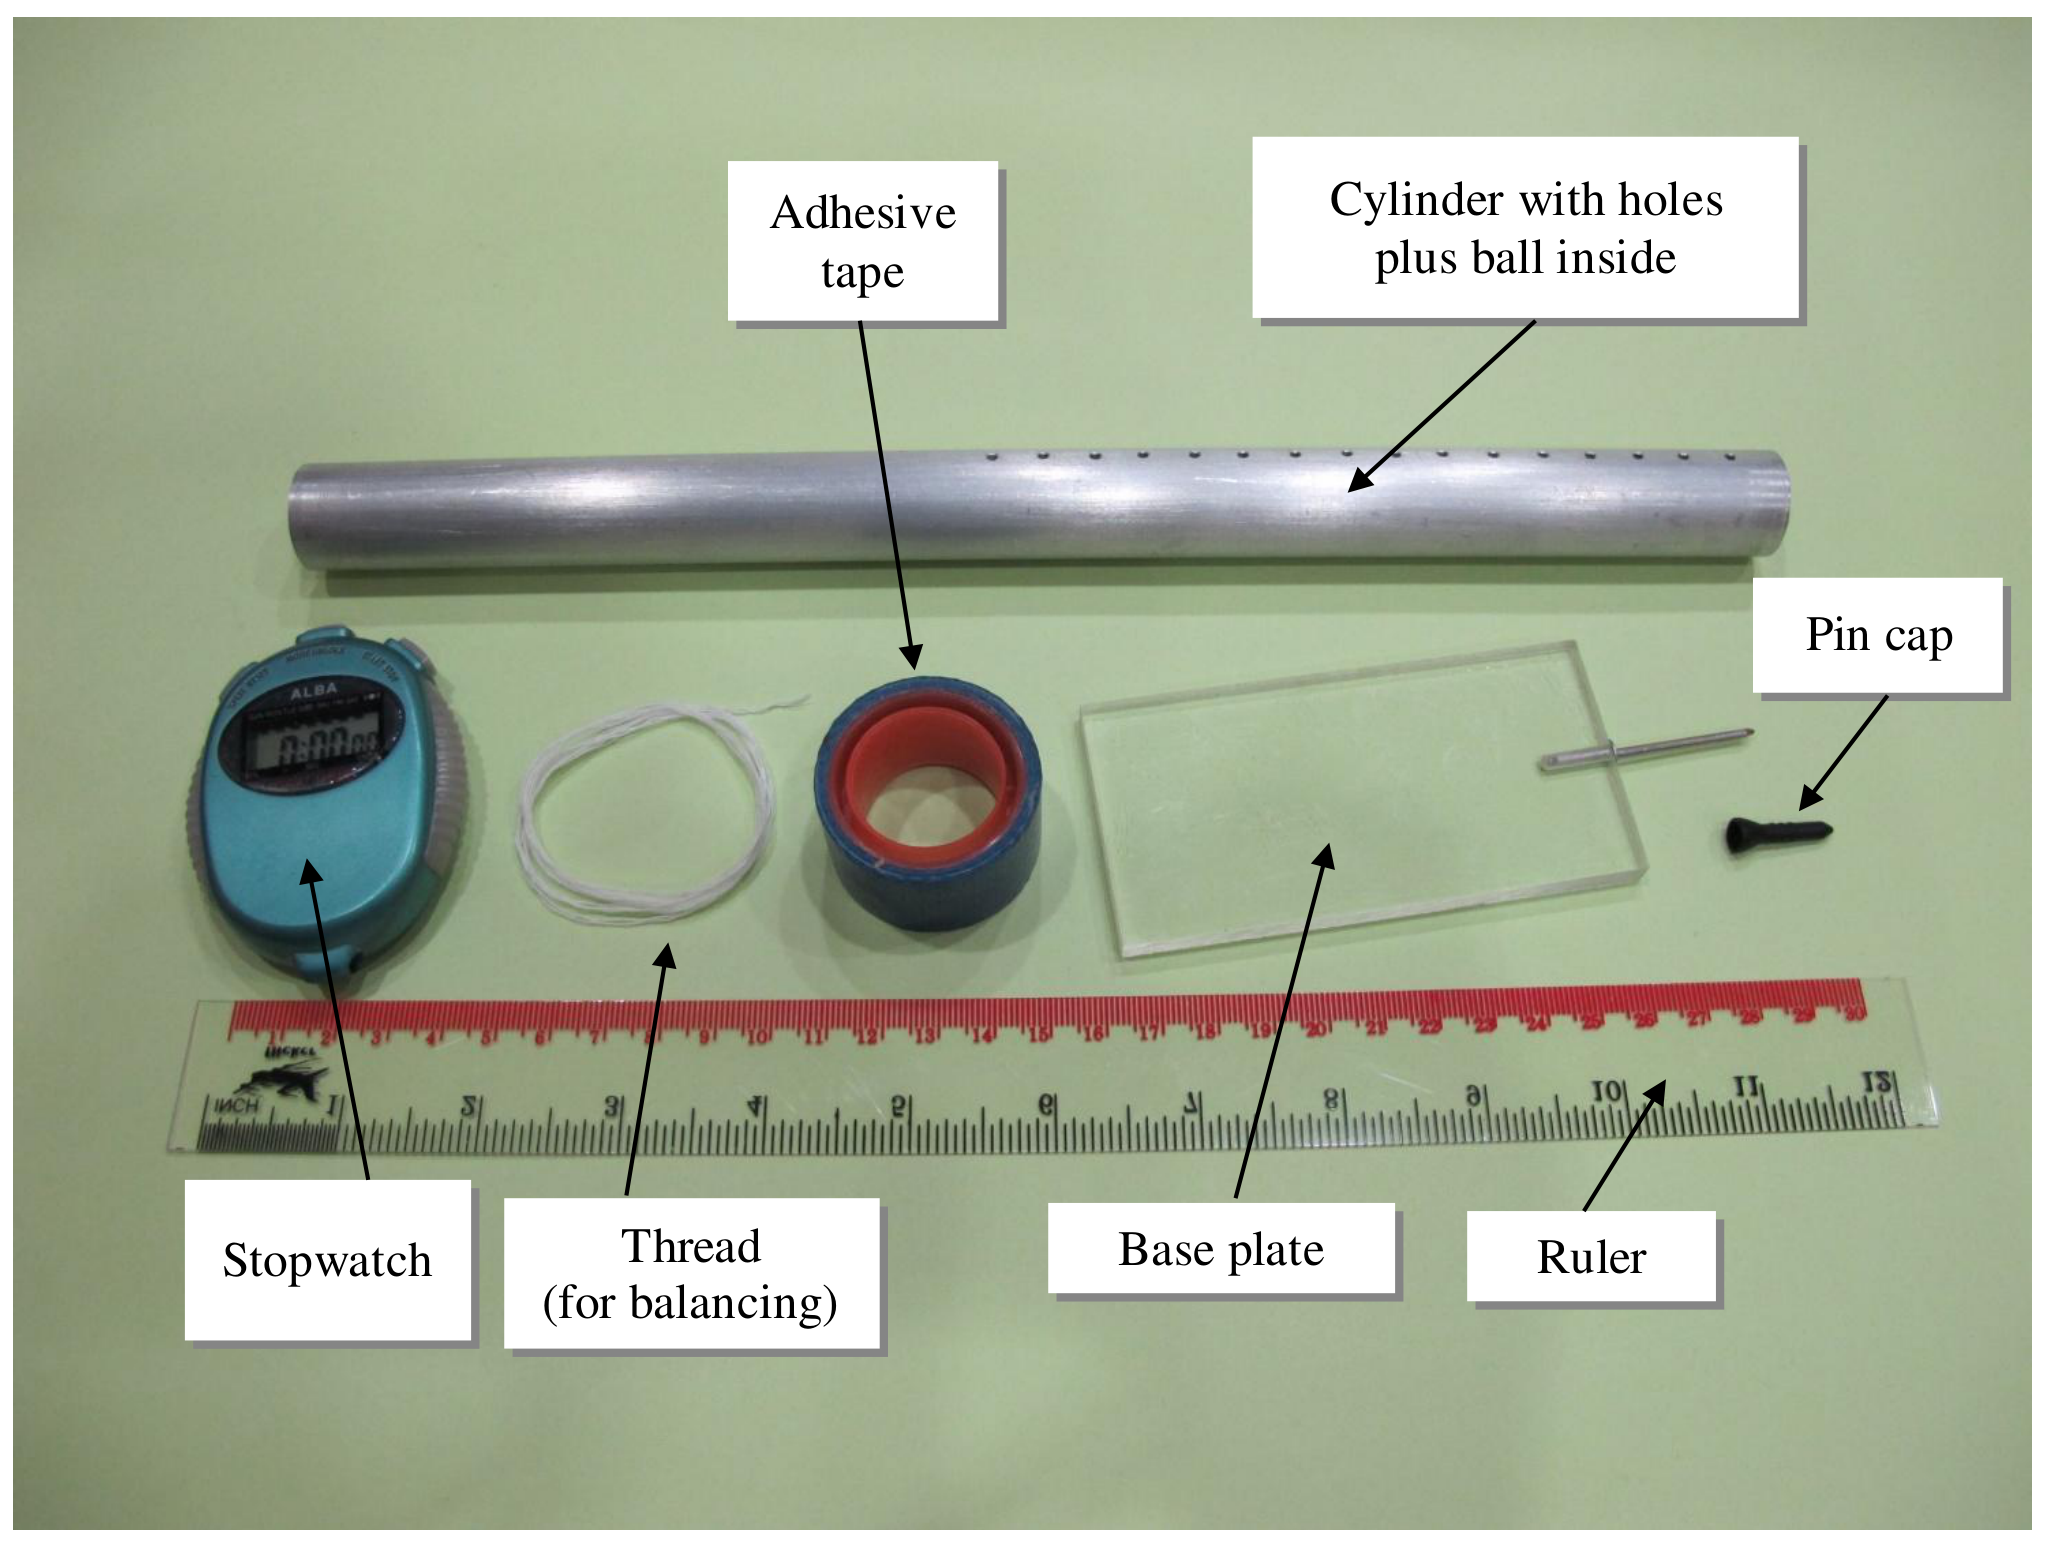
Equipment: a cylinder with holes plus a ball inside, a base plate with a thin pin, a pin cap, a ruler, a stopwatch, thread, a pencil and adhesive tape.
is the distance from the top of the cylinder to the centre of mass.
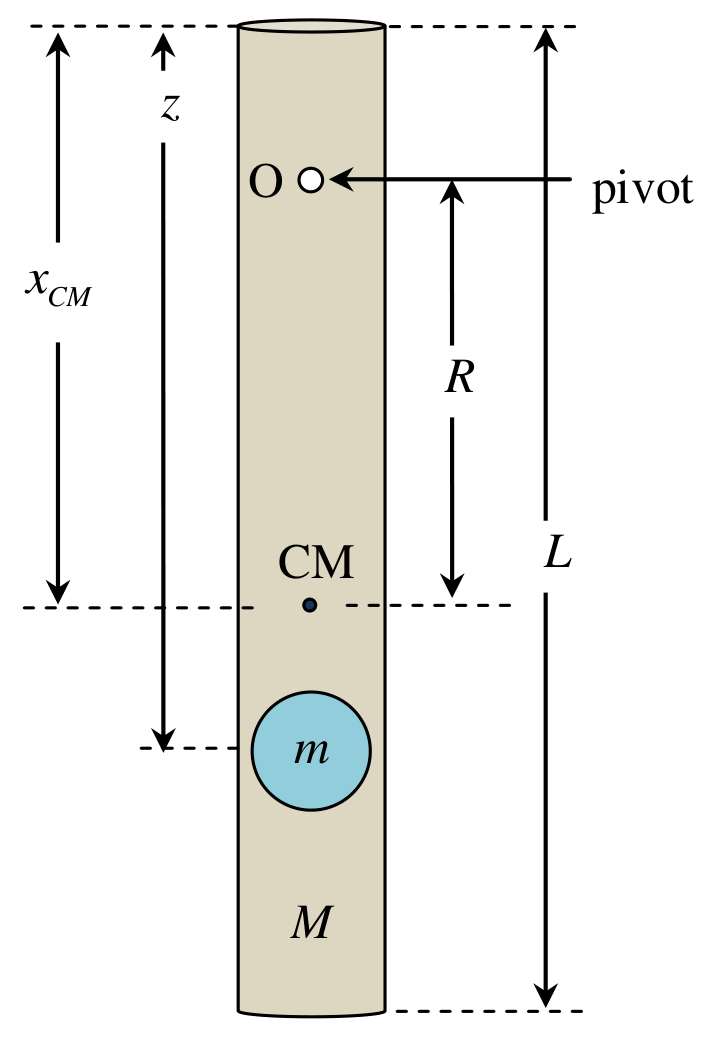
is the distance from the pivoting point to the centre of mass.
Caution: The thin pin is sharp. When it is not in use, it should be protected with a pin cap for safety.
Useful information:
- For such a physical pendulum, , where is the moment of inertia of the cylinder with a ball about the centre of mass and is the angular displacement.
- For a long hollow cylinder of length and mass , the moment of inertia about the centre of mass with the rotational axis perpendicular to the cylinder can be approximated by .
- The parallel axis theorem: , where is the distance from the rotation point to the centre of mass, and is the total mass of the object.
- The ball can be treated as a point mass and it is located on the central axis of the cylinder.
- Assume that the cylinder is uniform and the mass of the end-caps is negligible.
Отговори
i. 17.8 cm
Official sample result (from top), with ; the value depends on the individual apparatus.
ii. 25.3 cm
Official sample result, method (a): (the error estimation on the same page gives ); method (b): . The value depends on the individual apparatus.
iii. 2.7
Official sample result, method (a): , ; method (b): . The value depends on the individual apparatus.
iv. 961 cm/s²
Official sample result, method (a): ; method (b): .
Решение
Solution: 2 . Mechanical Blackbox: a cylinder with a ball inside
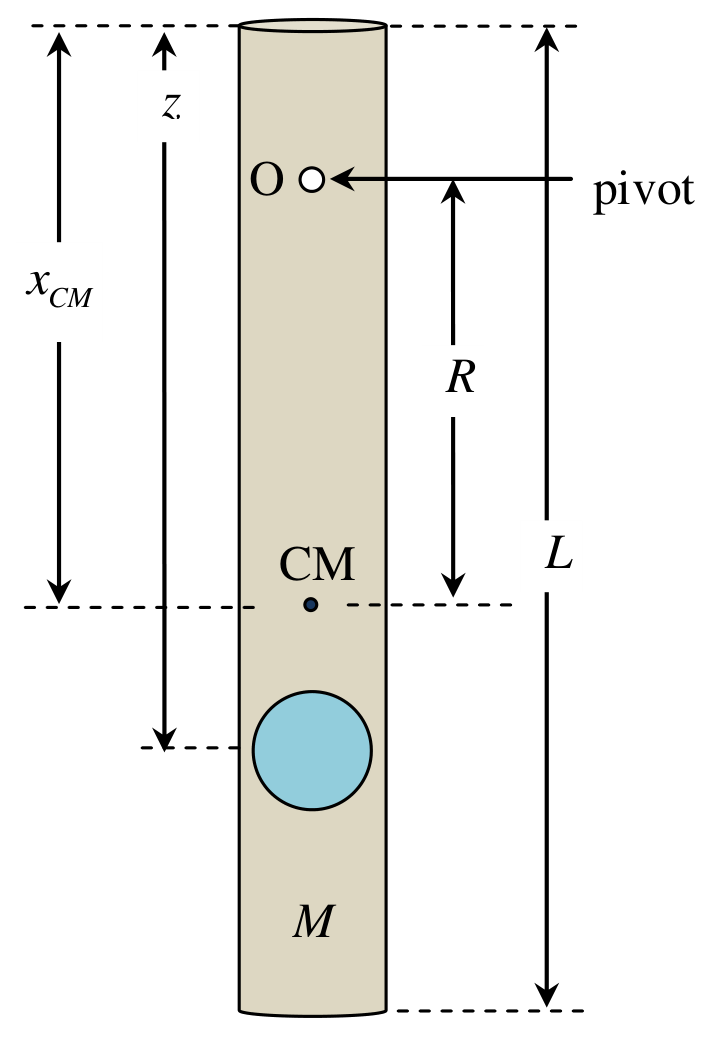
In order to be able to calculate the required values in i, ii, iii, we need to know:
a. the position of the centre of mass of the tubing plus particle (object) which depends on
b. the moment of inertia of the above.
The position of the CM may be found by balancing. The can be calculated from the period of oscillation of the tubing plus object.
Analytical steps to select parameters for plotting
I.
is readily obtainable with a ruler.
is determined by balancing the tubing and object.
II. For small-amplitude oscillation about any point O the period is given by considering the equation:
where
Note that
Method (a): (linear graph method)
The equation (5) may be put in the form:
Hence the plot of v.s. will yield the straight line whose
The value of is from equation (7):
Method (b): minimum point curve method
The equation (5) implies that has a minimum value at
Hence can be obtained from the graph v.s. .
And therefore
This equation (12) together with equation (1) will allow us to calculate the required values and .
At the value equation (5) becomes
from which can be calculated.
Results
| (cm) | time (s) for 20 cycles | (s) | (cm) | (cm) | (scm) | ||
|---|---|---|---|---|---|---|---|
| 1.1 | 18.59 | 18.78 | 18.59 | 0.933 | 16.7 | 278.9 | 14.53 |
| 2.1 | 18.44 | 18.25 | 18.53 | 0.920 | 15.7 | 246.5 | 13.29 |
| 3.1 | 18.10 | 18.09 | 18.15 | 0.906 | 14.7 | 216.1 | 12.06 |
| 4.1 | 17.88 | 17.78 | 17.81 | 0.891 | 13.7 | 187.7 | 10.88 |
| 5.1 | 17.69 | 17.50 | 17.65 | 0.881 | 12.7 | 161.3 | 9.85 |
| 6.1 | 17.47 | 17.38 | 17.28 | 0.869 | 11.7 | 136.9 | 8.83 |
| 7.1 | 17.06 | 17.06 | 17.22 | 0.856 | 10.7 | 114.5 | 7.83 |
| 8.1 | 17.06 | 17.00 | 17.06 | 0.852 | 9.7 | 94.1 | 7.04 |
| 9.1 | 16.97 | 16.91 | 16.96 | 0.847 | 8.7 | 75.7 | 6.25 |
| 10.1 | 17.00 | 17.03 | 17.06 | 0.852 | 7.7 | 59.3 | 5.58 |
| 11.1 | 17.22 | 17.37 | 17.38 | 0.866 | 6.7 | 44.9 | 5.03 |
| 12.1 | 17.78 | 17.72 | 17.75 | 0.888 | 5.7 | 32.5 | 4.49 |
| 13.1 | 18.57 | 18.59 | 18.47 | 0.927 | 4.7 | 22.1 | 4.04 |
| 14.1 | 19.78 | 19.90 | 19.75 | 0.991 | 3.7 | 13.7 | 3.69 |
| 15.1 | 11.16 | 11.13 | 11.13 | 1.114 | 2.7 | 7.3 | 3.34 |
| 16.1 | 13.25 | 13.40 | 13.50 | 1.338 | 1.7 | 2.9 | 3.04 |
Notes: at , times for 10 cycles.
Method (a)
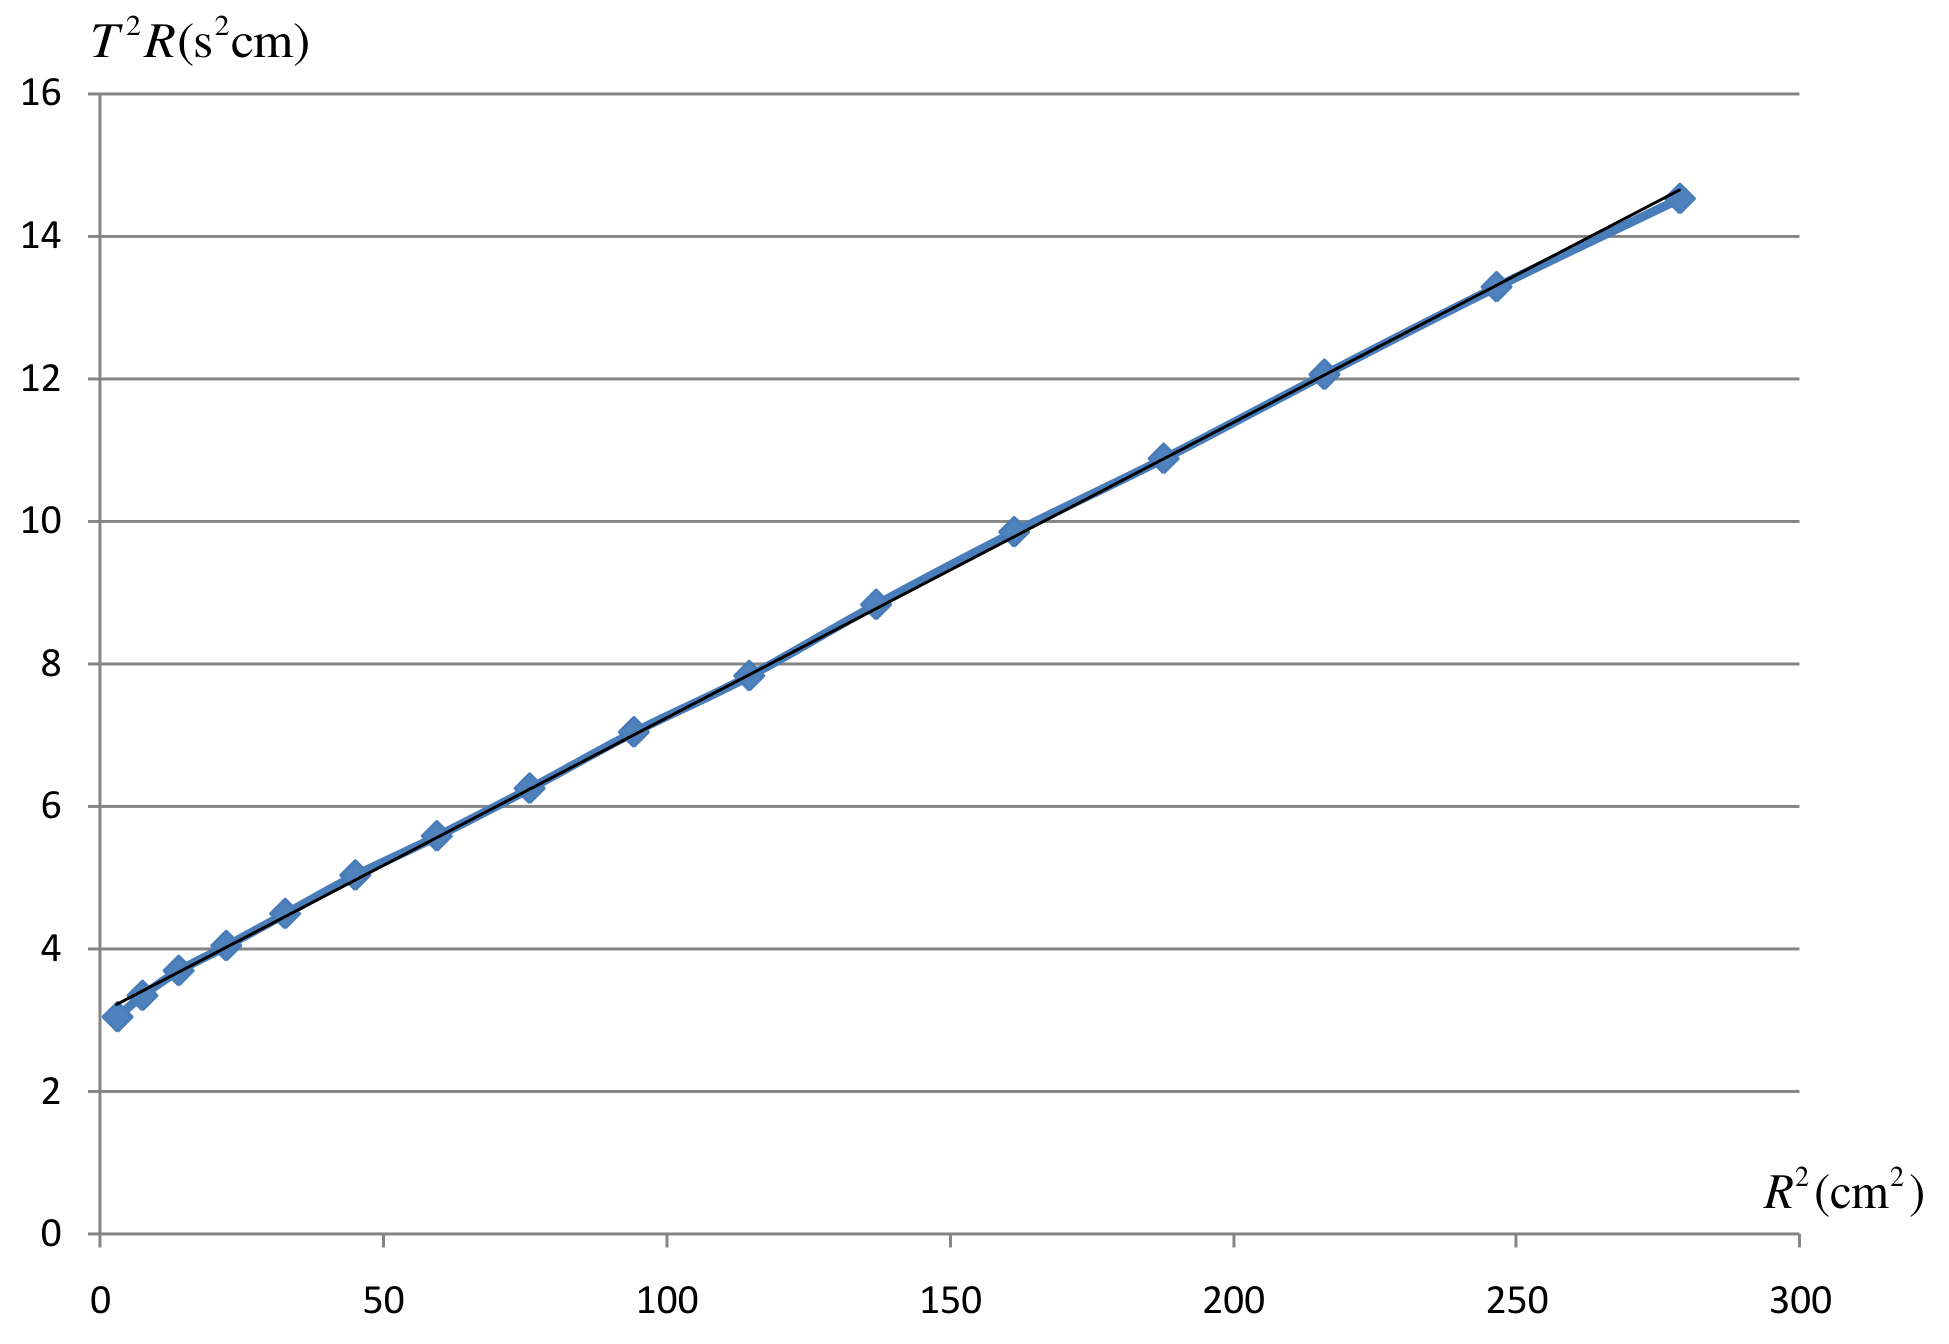
Calculation from straight line graph: slope , y-intercept
From equation (4):
Then
The centre of mass position gives:
From equations (14) and (15):
And
Error Estimation
Find error for :
From (10),
i) Find error for :
First, find error for .
Since error from contributes most ( while ), we estimate error propagation from only to simplify the analysis by substituting the min and max values into equation (4).
Now, we use . The corresponding quadratic equation is The corresponding solution is
If we use , the corresponding quadratic equation is
The corresponding solution is
So
Note that . So, we still ignore the error propagation due to
The error can be estimated from
ii) Find error for :
We know that
Method (b)
Calculation from T-R plot:
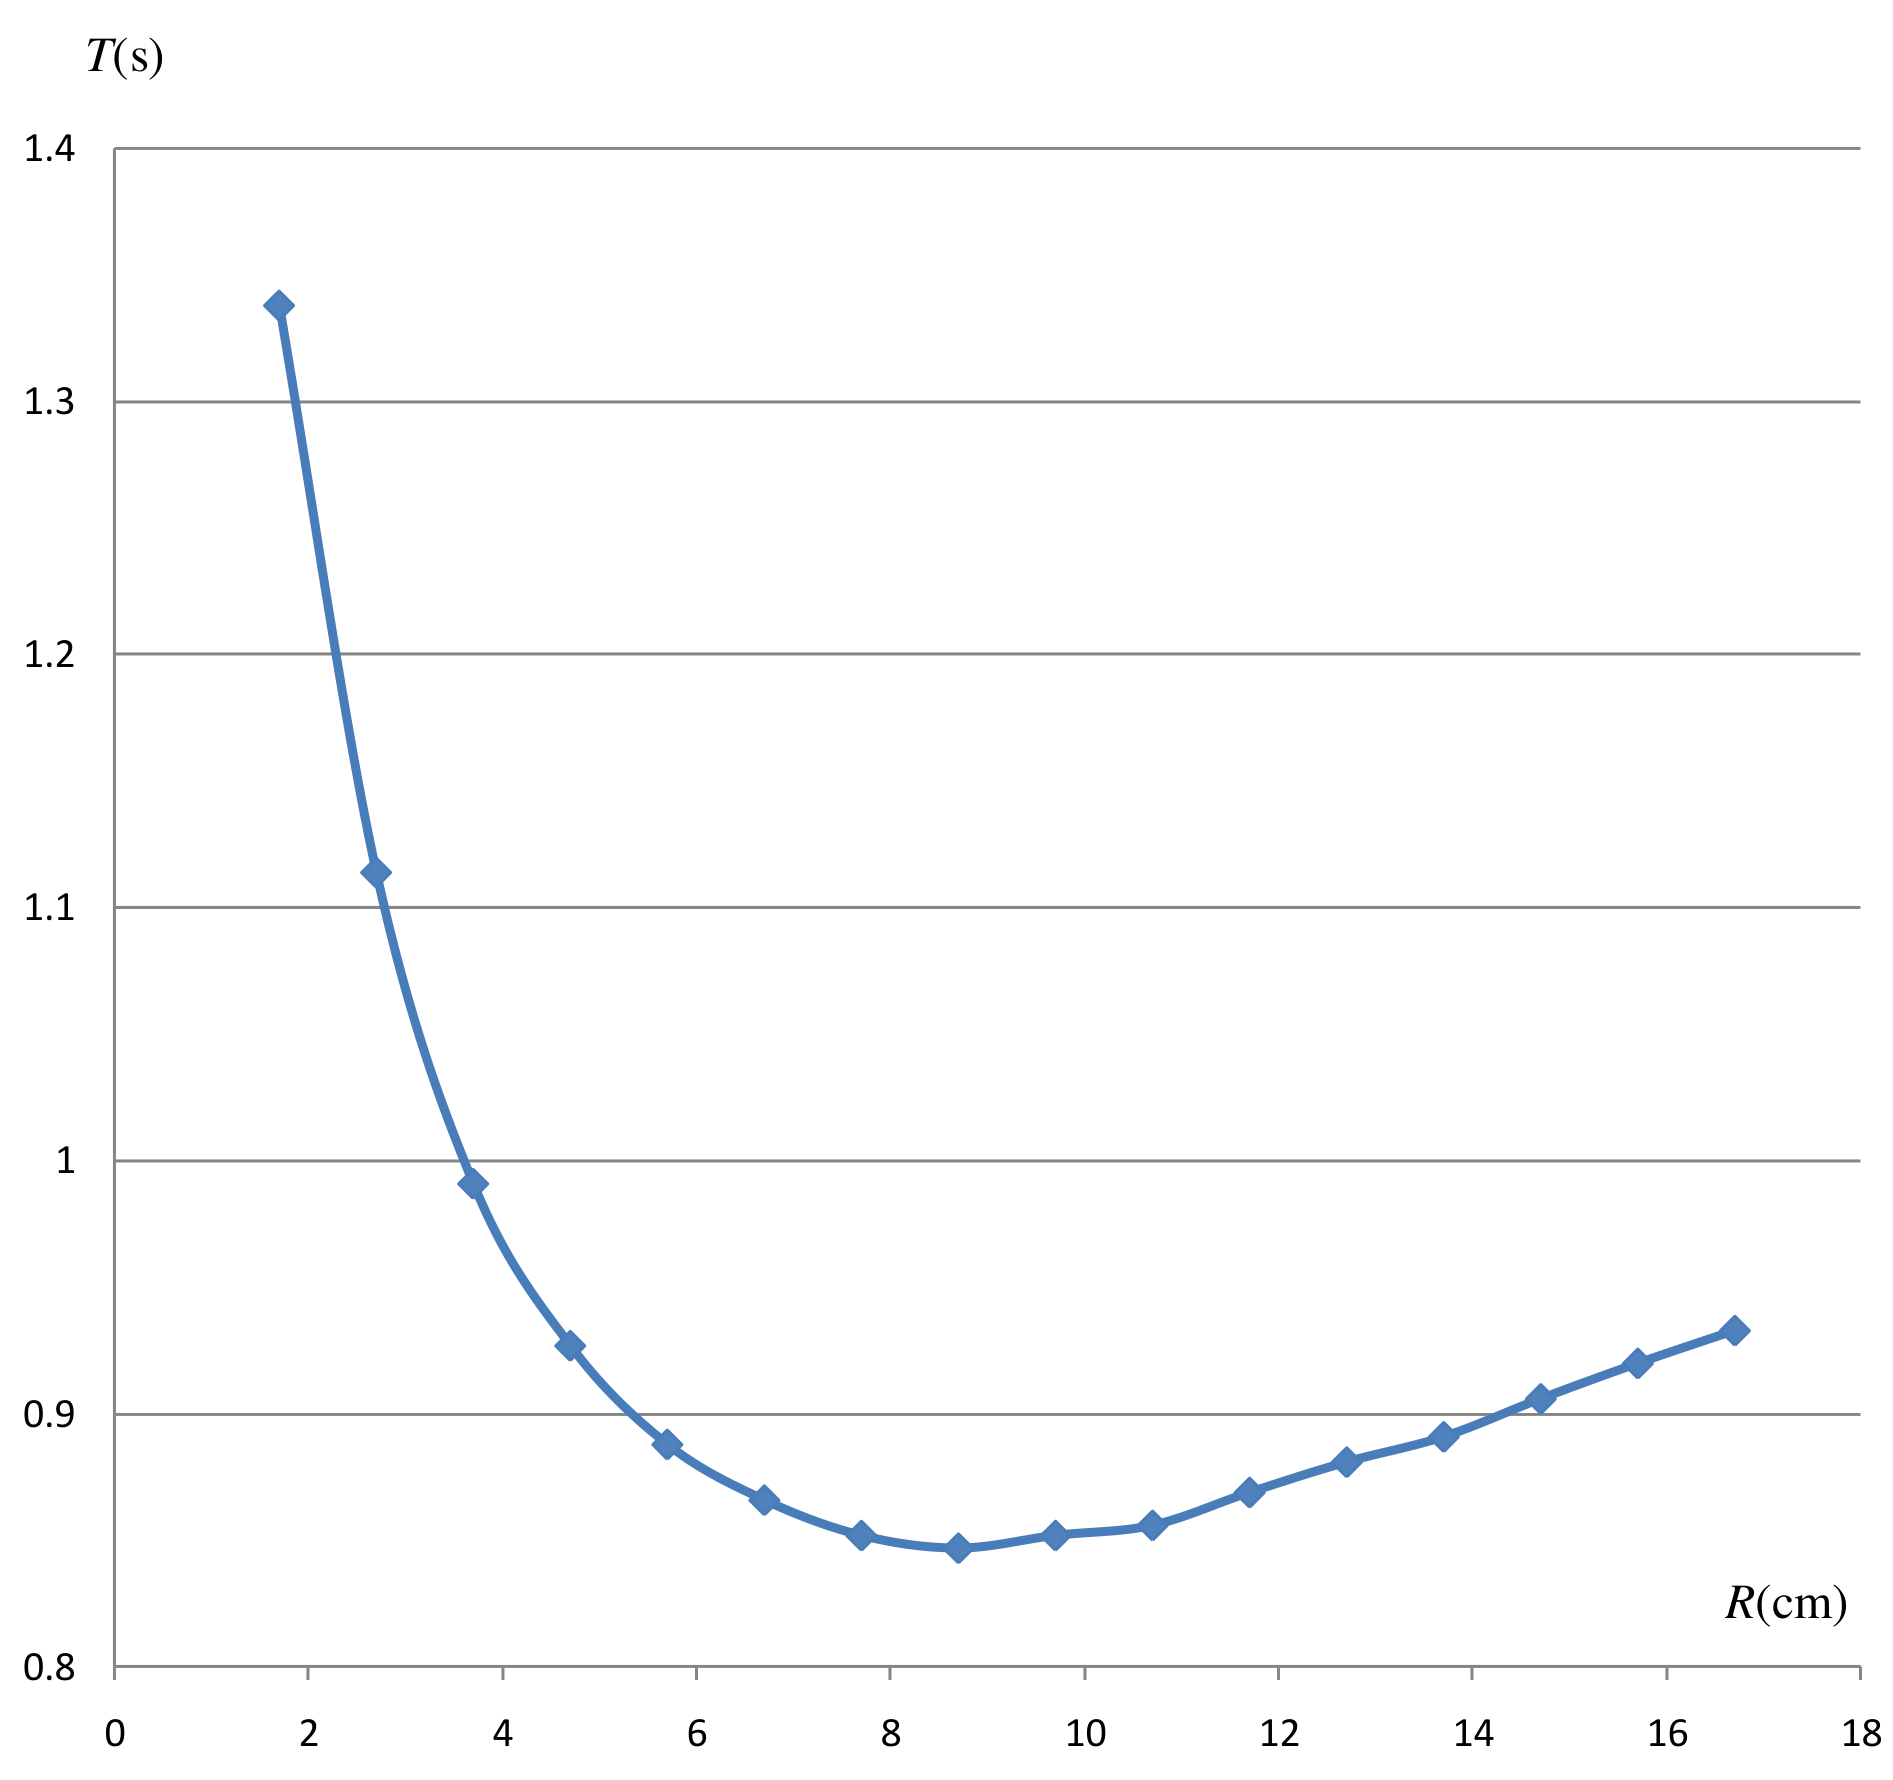
Using the minimum position: at and
From graph: and
From equations (14), (15), (16):
And
Error estimation
i) Find error for :
Using the minimum position: , we have
ii) Find error for :
First, find error for .
This is equivalent to in part 1. So, one can follow the same error analysis. As a result, we have
i) Find error for :
Following the same analysis as in part I, we found that
NOTE: This minimum curve method is not as accurate as the usual straight line graph.
Оригинал в Архива: exp2.pdf · официални решения: exp2_sol.pdf