IPhO 2013, Теория — Задача 3. The Greenlandic Ice Sheet
The Greenlandic Ice Sheet — T3 · 7 юли 2013 г. · 9 т.
Условие
Introduction
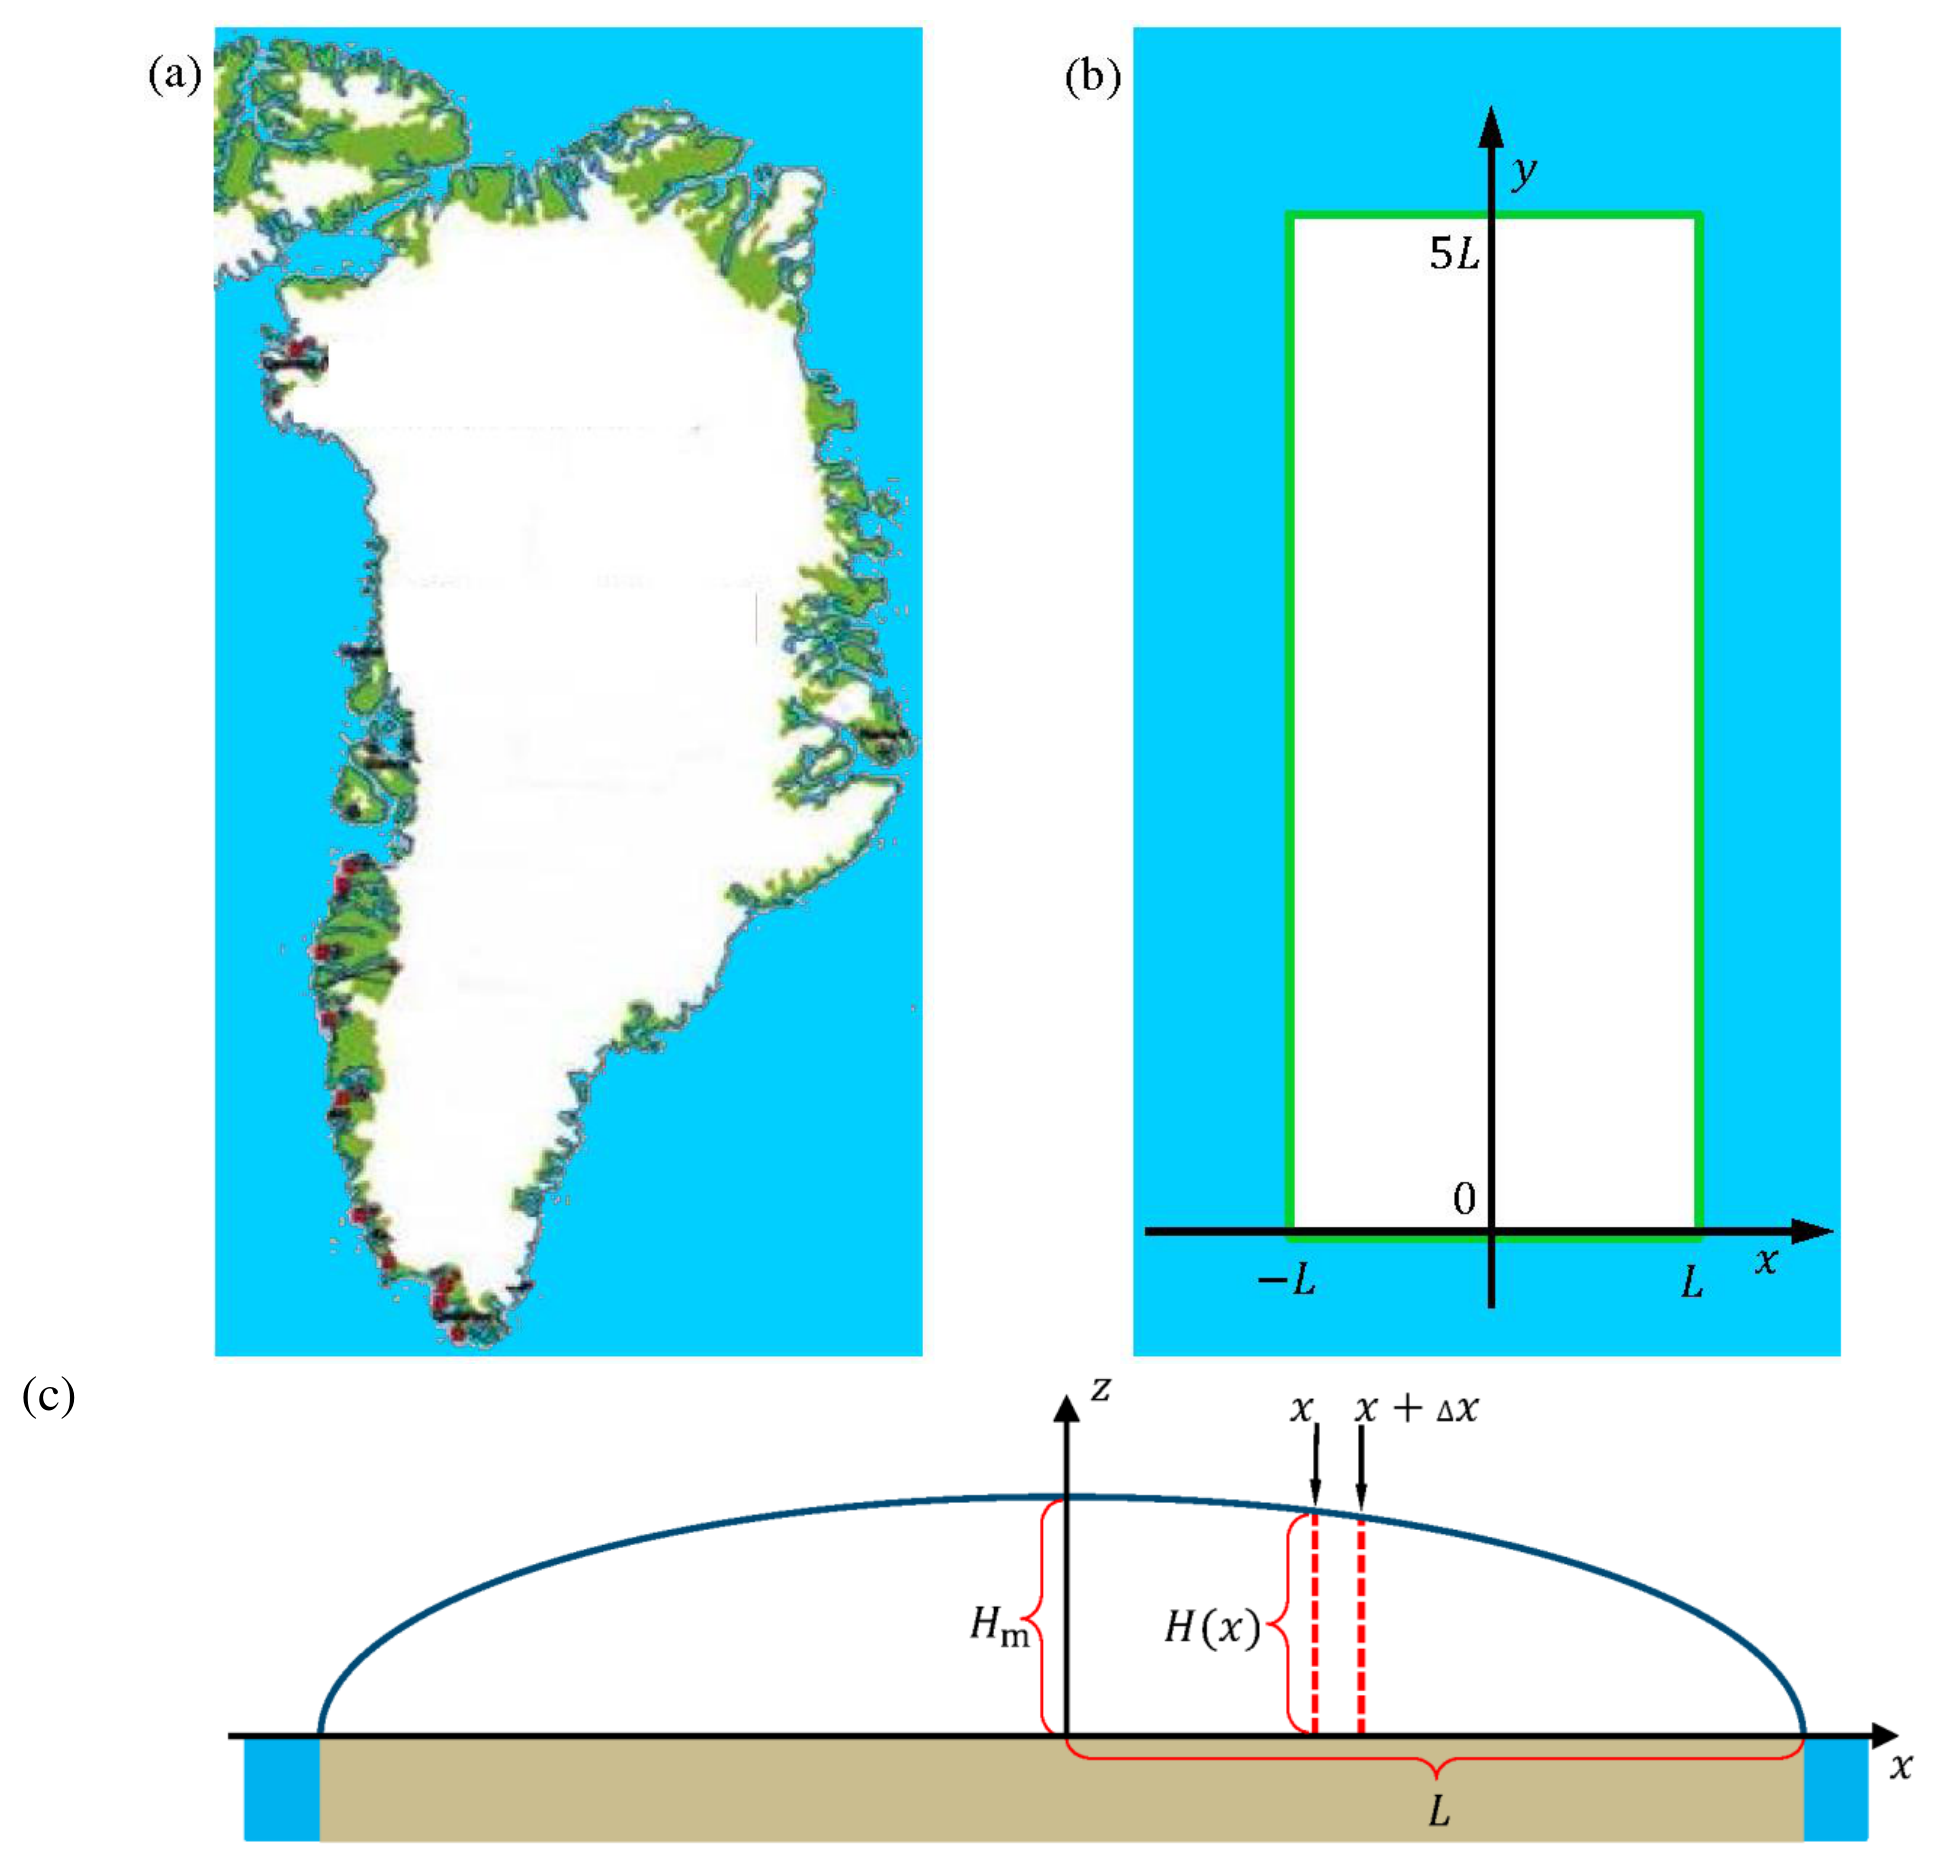
This problem deals with the physics of the Greenlandic ice sheet, the second largest glacier in the world, Fig. 3.1(a). As an idealization, Greenland is modeled as a rectangular island of width and length with the ground at sea level and completely covered by incompressible ice (constant density ), see Fig. 3.1(b). The height profile of the ice sheet does not depend on the -coordinate and it increases from zero at the coasts to a maximum height along the middle north-south axis (the -axis), known as the ice divide, see Fig. 3.1(c).
Two useful formulas
In this problem you can make use of the integral:
and the approximation , valid for .
The height profile of the ice sheet
On short time scales the glacier is an incompressible hydrostatic system with fixed height profile .
3.1 Write down an expression for the pressure inside the ice sheet as a function of vertical height z above the ground and distance from the ice divide. Neglect the atmospheric pressure. [0,3 т.]
Consider a given vertical slab of the ice sheet in equilibrium, covering a small horizontal base area between and , see the red dashed lines in Fig. 3.1(c). The size of does not matter. The net horizontal force component on the two vertical sides of the slab, arising from the difference in height on the center-side versus the coastal-side of the slab, is balanced by a friction force from the ground on the base area , where .
3.2a For a given value of , show that in the limit , , and determine k [0,9 т.]
3.2b Determine an expression for the height profile in terms of , , , and distance from the divide. The result will show, that the maximum glacier height scales with the half-width as . [0,8 т.]
3.2c Determine the exponent with which the total volume of the ice sheet scales with the area of the rectangular island, . [0,5 т.]
A dynamical ice sheet
On longer time scale, the ice is a viscous incompressible fluid, which by gravity flows from the center part to the coast. In this model, the ice maintains its height profile in a steady state, where accumulation of ice due to snow fall in the central region is balanced by melting at the coast. In addition to the ice sheet geometry of Fig. 3.1(b) and (c) make the following model assumptions:
- Ice flows in the -plane away from the ice divide (the -axis).
- The accumulation rate (m/year) in the central region is a constant.
- Ice can only leave the glacier by melting near the coasts at .
- The horizontal (-)component of the ice-flow velocity is independent of .
- The vertical (-)component of the ice-flow velocity is independent of .
Consider only the central region close to the middle of the ice sheet, where height variations of the ice sheet are very small and can be neglected altogether, i.e. .
3.3 Use mass conservation to find an expression for the horizontal ice-flow velocity in terms of , , and . [0,6 т.]
From the assumption of incompressibility, i.e. the constant density of the ice, it follows that mass conservation implies the following restriction on the ice flow velocity components
3.4 Write down an expression for the dependence of the vertical component of the ice-flow velocity. [0,6 т.]
A small ice particle with the initial surface position will, as time passes, flow as part of the ice sheet along a flow trajectory in the vertical -plane.
3.5 Derive an expression for such a flow trajectory . [0,9 т.]
Age and climate indicators in the dynamical ice sheet
Based on the ice-flow velocity components and , one can estimate the age of the ice in a specific depth from the surface of the ice sheet.
3.6 Find an expression for the age of the ice as a function of height above ground, right at the ice divide . [1 т.]
An ice core drilled in the interior of the Greenland ice sheet will penetrate through layers of snow from the past, and the ice core can be analyzed to reveal past climate changes. One of the best indicators is the so-called , defined as
where denotes the relative abundance of the two stable isotopes and of oxygen. The reference is based on the isotopic composition of the oceans around Equator.
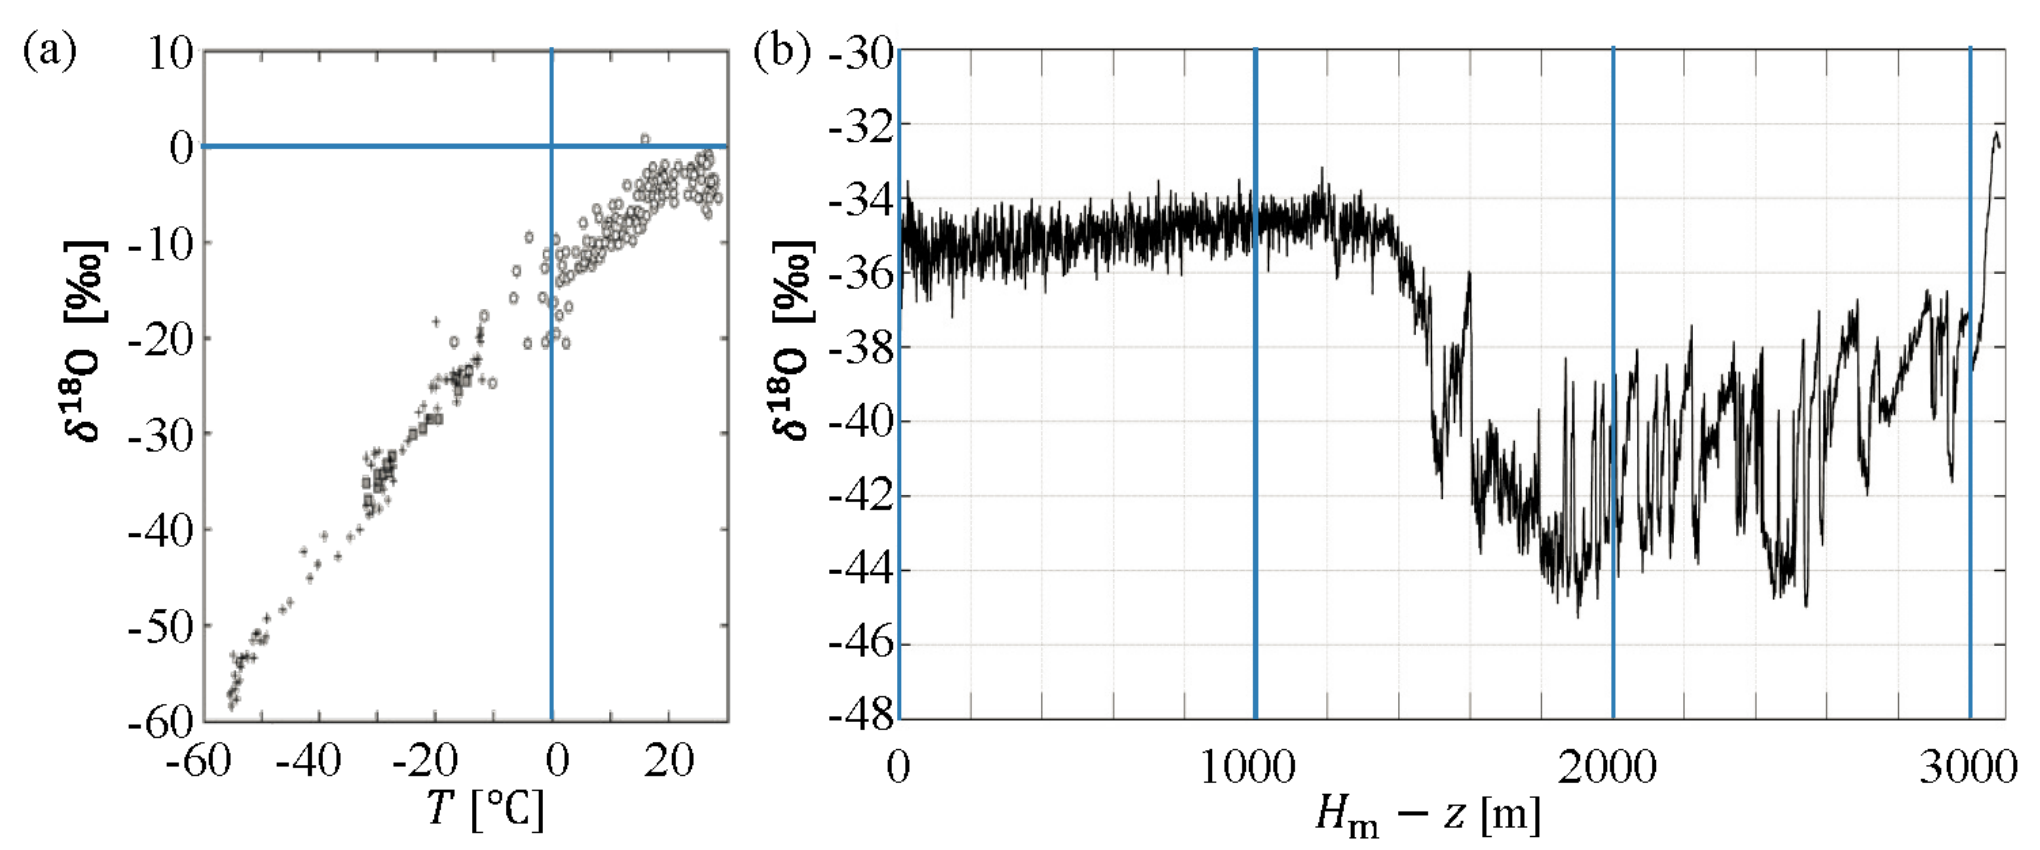
Observations from the Greenland ice sheet show that in the snow varies approximately linearly with temperature, Fig. 3.2(a). Assuming that this has always been the case, retrieved from an ice core at depth leads to an estimate of the temperature near Greenland at the age .
Measurements of in a 3060 m long Greenlandic ice core show an abrupt change in at a depth of 1492 m, Fig. 3.2(b), marking the end of the last ice age. The ice age began 120,000 years ago, corresponding to a depth of 3040 m, and the current interglacial age began 11,700 years ago, corresponding to a depth of 1492 m. Assume that these two periods can be described by two different accumulation rates, (ice age) and (interglacial age), respectively. You can assume to be constant throughout these 120,000 years.
3.7a Determine the accumulation rates and . [0,8 т.]
3.7b Use the data in Fig. 3.2 to find the temperature change at the transition from the ice age to the interglacial age. [0,2 т.]
Sea level rise from melting of the Greenland ice sheet
A complete melting of the Greenlandic ice sheet will cause a sea level rise in the global ocean. As a crude estimate of this sea level rise, one may simply consider a uniform rise throughout a global ocean with constant area .
3.8 Calculate the average global sea level rise, which would result from a complete melting of the Greenlandic ice sheet, given its present area of and . [0,6 т.]
The massive Greenland ice sheet exerts a gravitational pull on the surrounding ocean. If the ice sheet melts, this local high tide is lost and the sea level will drop close to Greenland, an effect which partially counteracts the sea level rise calculated above.
To estimate the magnitude of this gravitational pull on the water, the Greenlandic ice sheet is now modeled as a point mass located at the ground level and having the total mass of the Greenlandic ice sheet. Copenhagen lies at a distance of 3500 km along the Earth surface from the center of the point mass. One may consider the Earth, without the point mass, to be spherically symmetric and having a global ocean spread out over the entire surface of the Earth of area . All effects of rotation of the Earth may be neglected.
3.9 Within this model, determine the difference between sea levels in Copenhagen () and diametrically opposite to Greenland (). [1,8 т.]
Отговори
3.1
3.2a
3.2b
3.2c
3.3
3.4
3.5
3.6
3.7a cig = 0.1749 m/year, cia = 0.1232 m/year
The official solution prints cia = 0.1232 without a unit.
3.7b 12 °C
3.8 8.79 m
3.9 4.56 m
The problem sheet prints 1.8 points for 3.9; the solution sheet prints 1.6.
Решение
3.1 [0.3]
The pressure is given by the hydrostatic pressure , which is zero at the surface.
3.2a [0.9]
The outward force on a vertical slice at a distance from the middle and of a given width is obtained by integrating up the pressure times the area:
which implies that . This finally shows that
Notice the sign, which must be like this, since was defined as positive and is a decreasing function of .
3.2b [0.8]
To find the height profile, we solve the differential equation for :
with the boundary condition that . This gives the solution:
Which gives the maximum height .
Alternatively, dimensional analysis could be used in the following manner. First notice that . Using that , , , demands that , which again implies , , . These three equations are solved to give , which shows that
Since we were informed that , it follows that . With the boundary condition , the solution then take the form
The proportionality constant of cannot be determined in this approach.
3.2c [0.5]
For the rectangular Greenland model, the area is equal to and the volume is found by integrating up the height profile found in problem 3.2b:
where the last line follows from the fact that . Note that the integral need not be carried out to find the scaling with . This implies that and the wanted exponent is .
3.3 [0.6]
According to the assumption of constant accumulation c the total mass accumulation rate from an area of width between the ice divide at and some point at must equal the total mass flux through the corresponding vertical cross section at . That is: , from which the velocity is isolated:
3.4 [0.6]
From the given relation of incompressibility it follows that
Solving this differential equation with the initial condition , shows that:
3.5 [0.9]
Solving the two differential equations
with the initial conditions that , and gives
This shows that , meaning that flow lines are hyperbolas in the -plane. Rather than solving the differential equations, one can also use them to show that
which again implies that . Fixing the constant by the initial conditions, again leads to the result that .
3.6 [1.0]
At the ice divide, , the flow will be completely vertical, and the -dependence of found in 3.5 can be inverted to find . One finds that .
3.7a [0.8]
The present interglacial period extends to a depth of 1492 m, corresponding to 11,700 year. Using the formula for from problem 3.6, one finds the following accumulation rate for the interglacial:
The beginning of the ice age 120,000 years ago is identified as the drop in in figure 3.2b at a depth of 3040 m. Using the vertical flow velocity found in problem 3.4, on has , which can be integrated down to a depth of 3040 m, using a stepwise constant accumulation rate:
Isolating form this equation leads to , i.e. far less precipitation than now.
3.7b [0.2]
Reading off from figure 3.2b: changes from ‰ to ‰. Reading off from figure 3.2a, then changes from ℃ to ℃. This gives ℃.
3.8 [0.6]
From the area one finds that . Inserting numbers in the volume formula found in 3.2c, one finds that:
This ice volume must be converted to liquid water volume, by equating the total masses, i.e. , which is finally converted to a sea level rise, as .
3.9 [1.6]
The total mass of the ice is
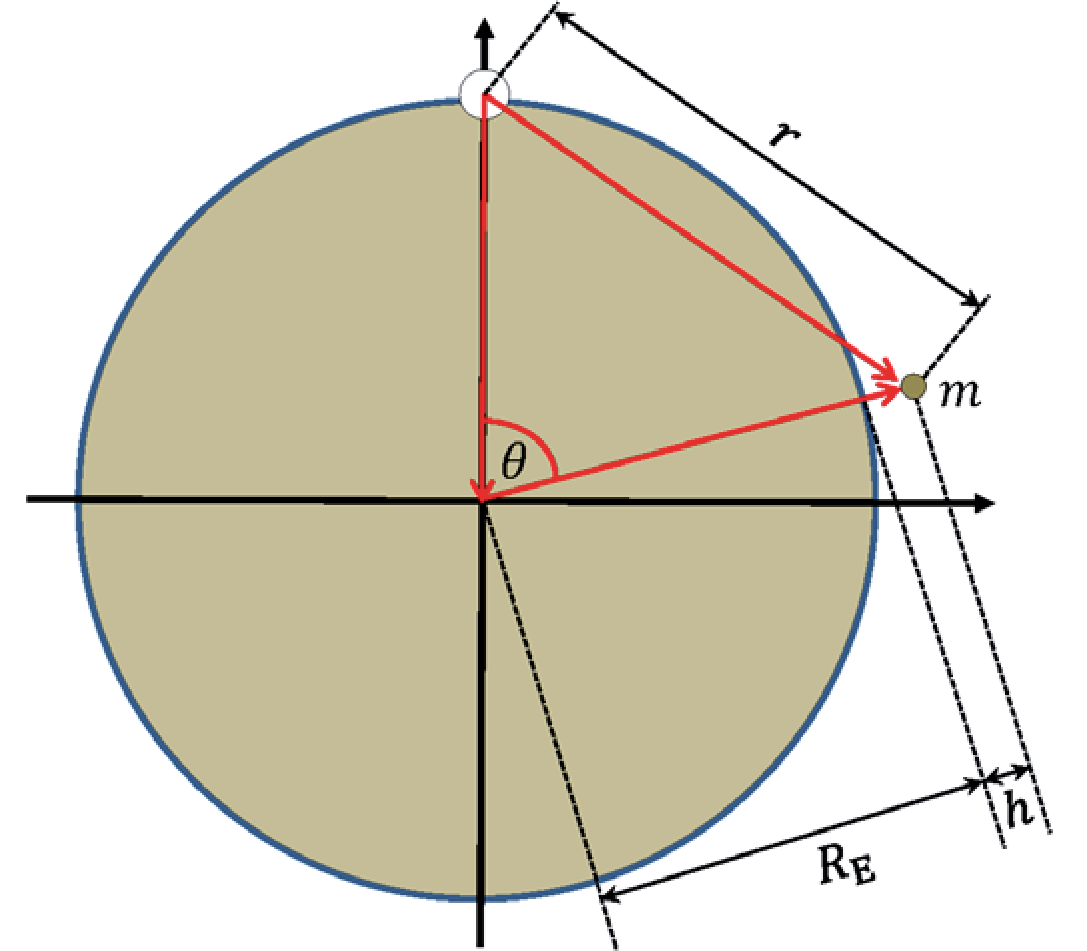
The total gravitational potential felt by a test mass at a certain height above the surface of the Earth, and at a polar angle (cf. figure 3.S1), with respect to a rotated polar axis going straight through the ice sphere is found by adding that from the Earth with that from the ice:
where . Since one may use the approximation given in the problem, , , to approximate this by
Isolating now shows that , where . Using again that , trigonometry shows that , and one has:
To find the magnitude of the effect in Copenhagen, the distance of 3500 km along the surface is used to find the angle , corresponding to m. Directly opposite to Greenland corresponds to , which gives m. The difference is then m, where has dropped out.
Approach with forces:
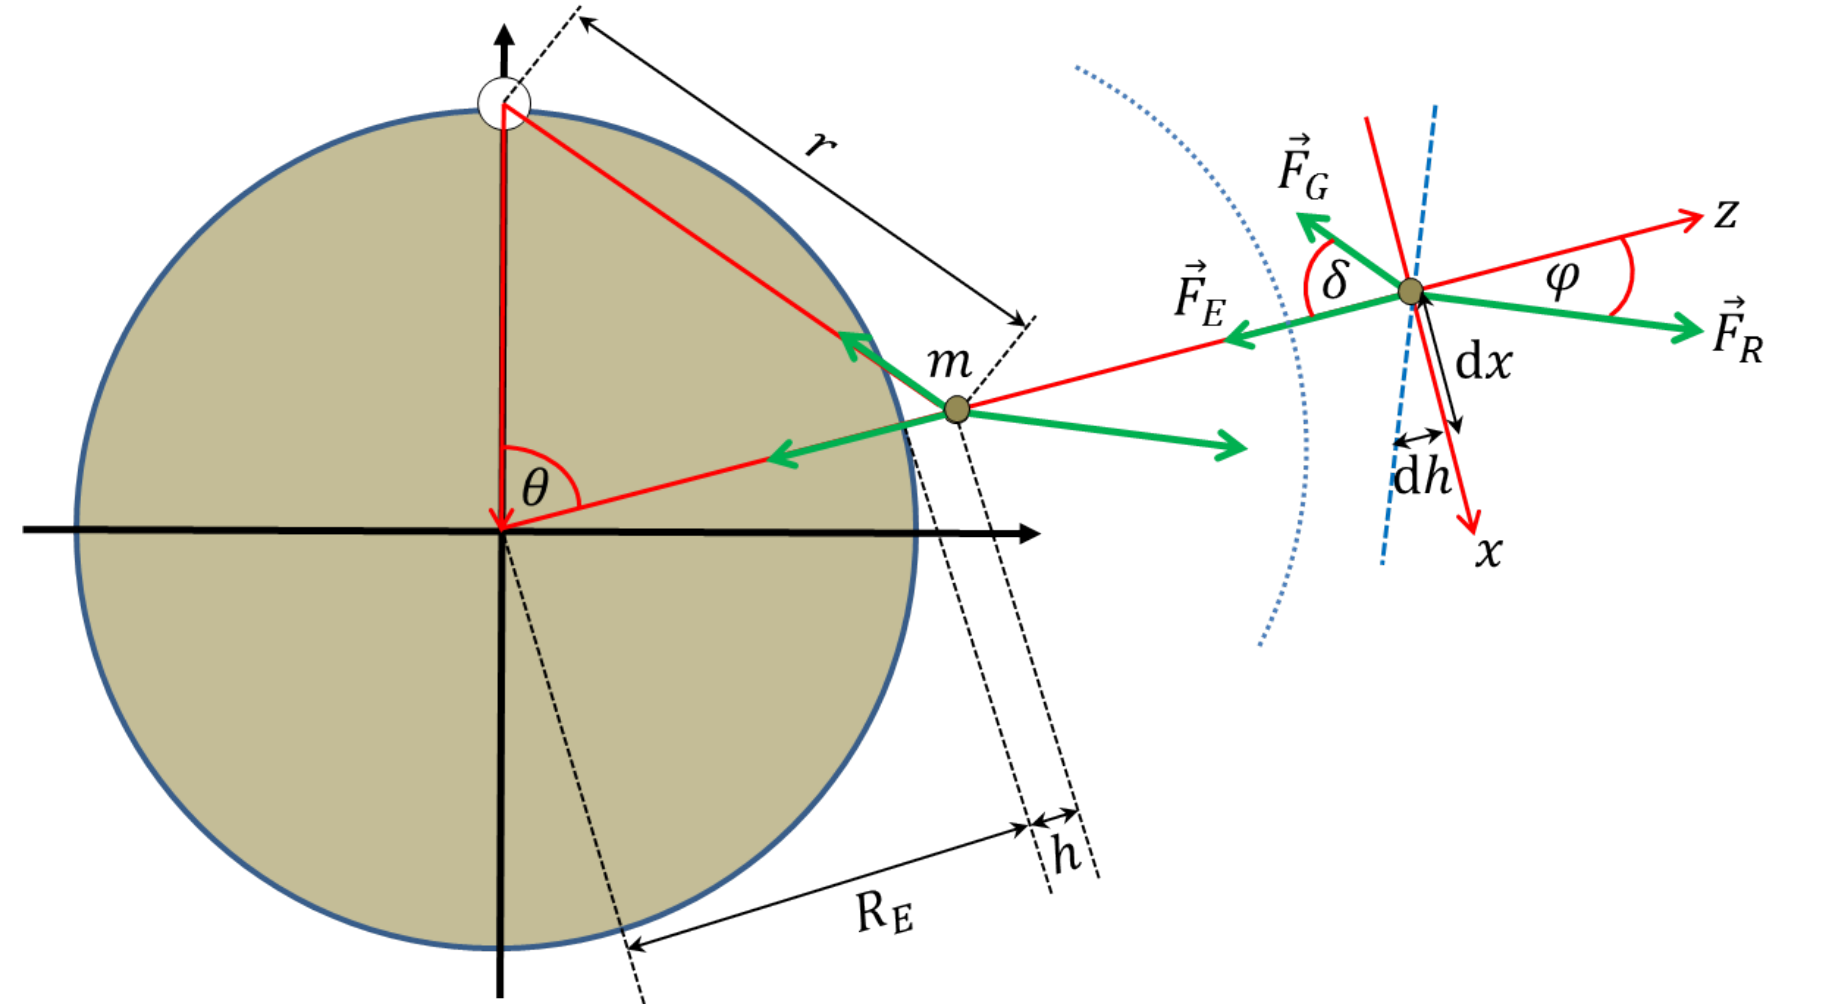
This problem can also be solved using forces. The basic equations for mechanical equilibrium of the test particle is then a simple matter of balancing the two gravitational forces, and , with the reaction force from the Earth, . Given the angles indicated in Figure 3.S2, the force balance along locally vertical and horizontal directions, respectively, read
and
which can be divided to obtain (using that ):
where we have plugged in the gravitational forces and the relevant distances. We have also approximated the fraction, using that , which is only valid not too close to Greenland, i.e. for a certain size of . Since the local sea surface will be perpendicular to the reaction force, it is seen from figure 3.S2 that
whereby
The difference in sea levels in Copenhagen and opposite to Greenland can now be obtained by integrating this expression. That is
where we have made the substitution . Plugging in the numbers found above, we obtain again . Note that this solution strategy necessarily involves consideration of tangential force components alongside with the radial components.
Total [9.0]