IPhO 2015, Експеримент — Задача 1. Diffraction due to Helical Structure
46th International Physics Olympiad 2015 Mumbai - India. Q E-I. Diffraction due to Helical Structure · 10 т.
Условие
(Total marks: 10)
Introduction
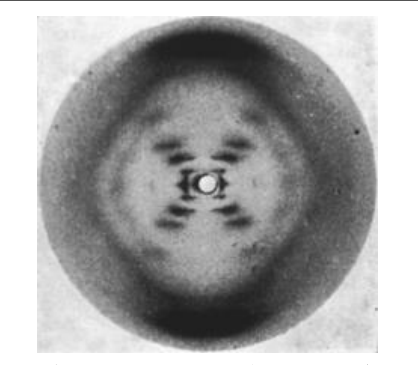
The X-ray diffraction image of DNA (Fig. 1) taken in Rosalind Franklin’s laboratory, famously known as “Photo 51”, became the basis of the discovery of the double helical structure of DNA by Watson and Crick in 1952. This experiment will help you understand diffraction patterns due to helical structures using visible light.
Objective
To determine geometrical parameters of helical structures using diffraction.
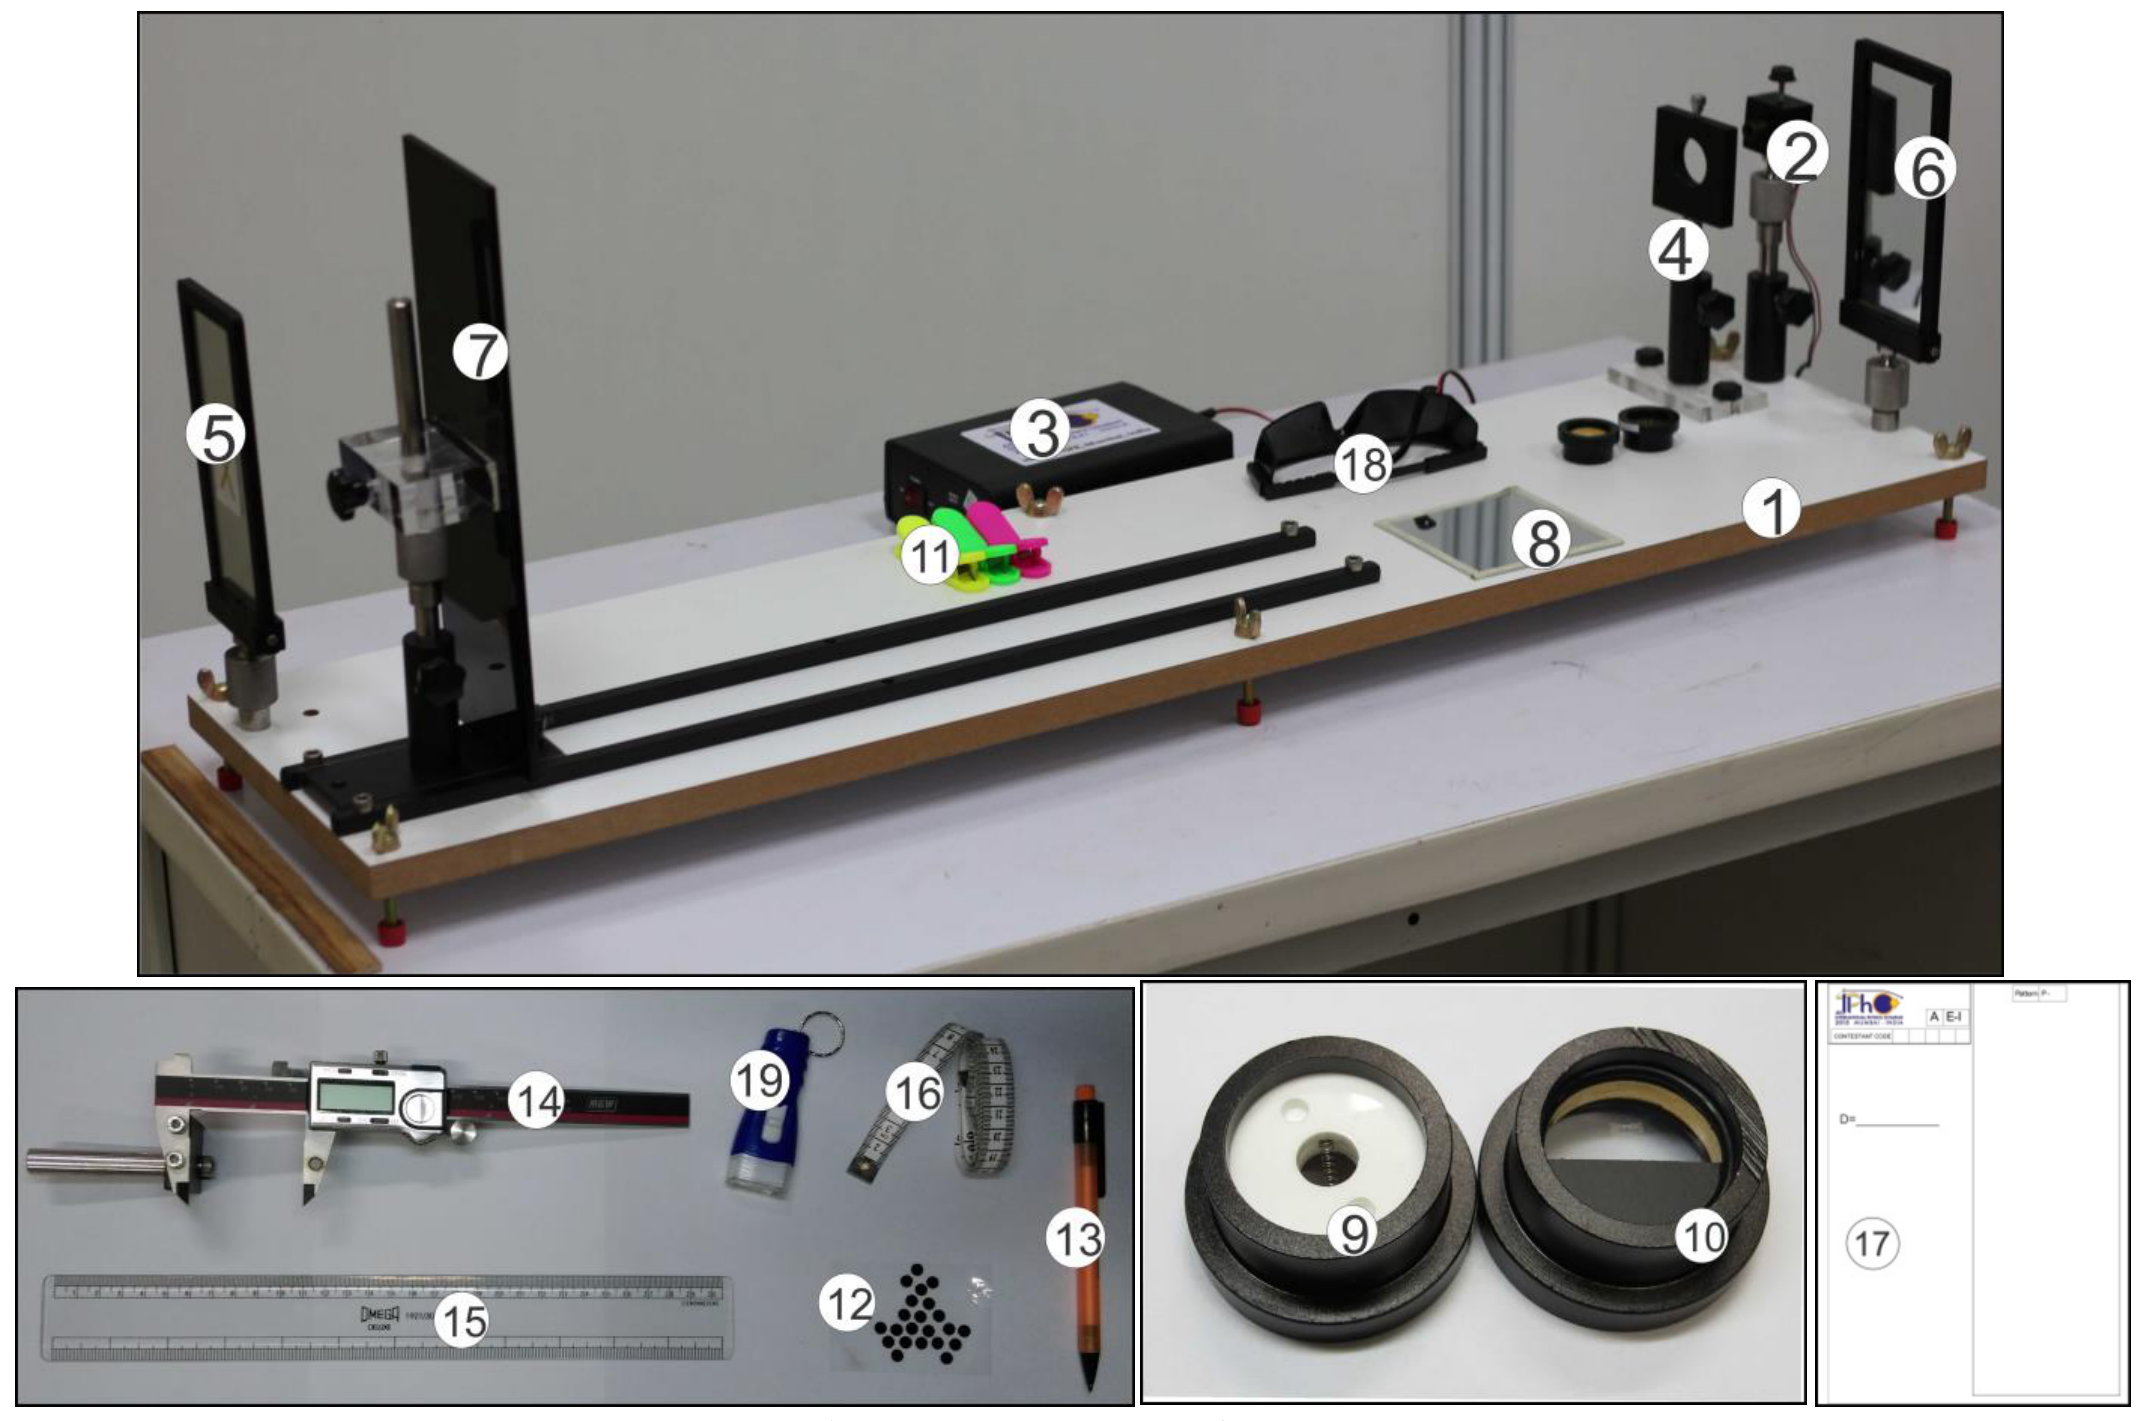
List of apparatus
| [1] | Wooden platform | [11] | Plastic clips |
|---|---|---|---|
| [2] | Laser source with its mount and base | [12] | Circular black stickers |
| [3] | DC regulated power supply for the Laser source | [13] | Mechanical pencil |
| [4] | Sample holder with its base | [14] | Digital caliper with a mount |
| [5] | Left reflector (front coated mirror) | [15] | Plastic scale (30 cm) |
| [6] | Right reflector (front coated mirror) | [16] | Measuring tape (1.5 m) |
| [7] | Screen (10 cm x 30 cm) with its mount and base | [17] | Pattern marking sheets |
| [8] | Plane mirror (10 cm x 10 cm) | [18] | Laser safety goggles |
| [9] | Sample I (helical spring) | [19] | Battery operated flashlight |
| [10] | Sample II (double-helix-like pattern printed on glass plate) |
Note: Items [1], [3], [14], [15], [16] and [18] are also used in experiment E-II.
¹ Praveen Pathak (HBCSE-TIFR, Mumbai), Charudatt Kadolkar (IIT, Guwahati), and Manish Kapoor (Christ Church College, Kanpur) were the principal authors of this problem. The contributions of the Academic Committee, Academic Development Group and the International Board are gratefully acknowledged.
Description of apparatus
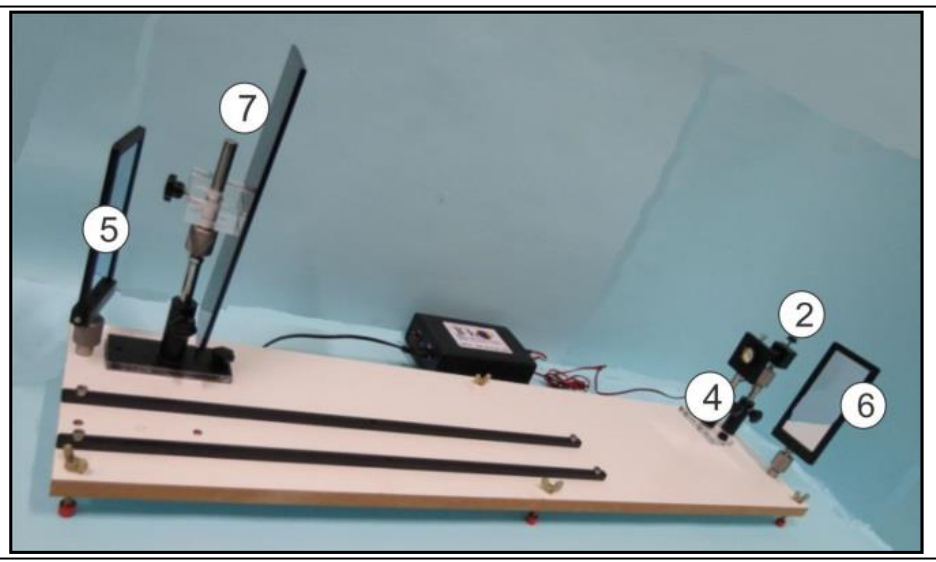
Wooden platform [1]: A pair of guiding rails, laser, reflectors, screen and sample mounts are rigidly fixed on it.
Laser source with its mount and base [2]: Laser source of wavelength () is fixed in a metallic mount clamped to the base using a ball joint ([20] in Fig. 3) allowing the adjustment in X-Y-Z directions. The laser body can be rotated and clamped using the top lock-in screw. The beam focus can be adjusted by rotating the front lens cap (red arrow in Fig. 3) to obtain a clear and sharp diffraction pattern.
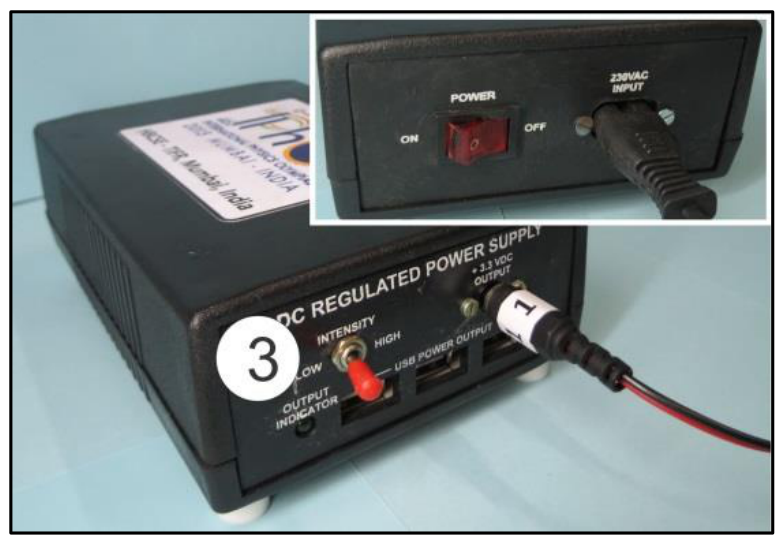
DC regulated power supply [3]: The front panel has an intensity switch (high/low), socket for laser source connector and three USB sockets. The back panel has power switch and mains power socket (inset of Fig. 4).
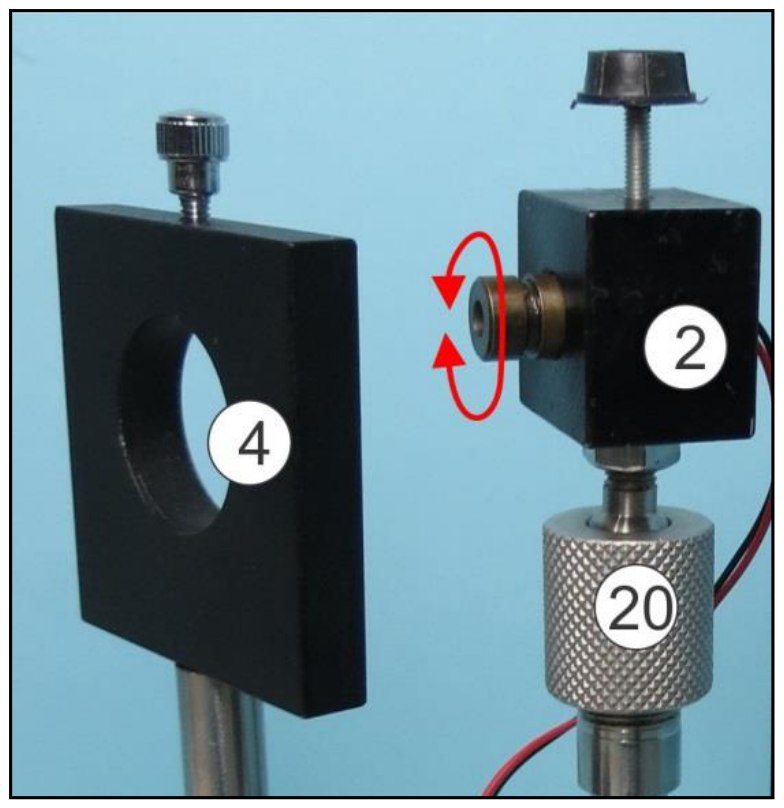
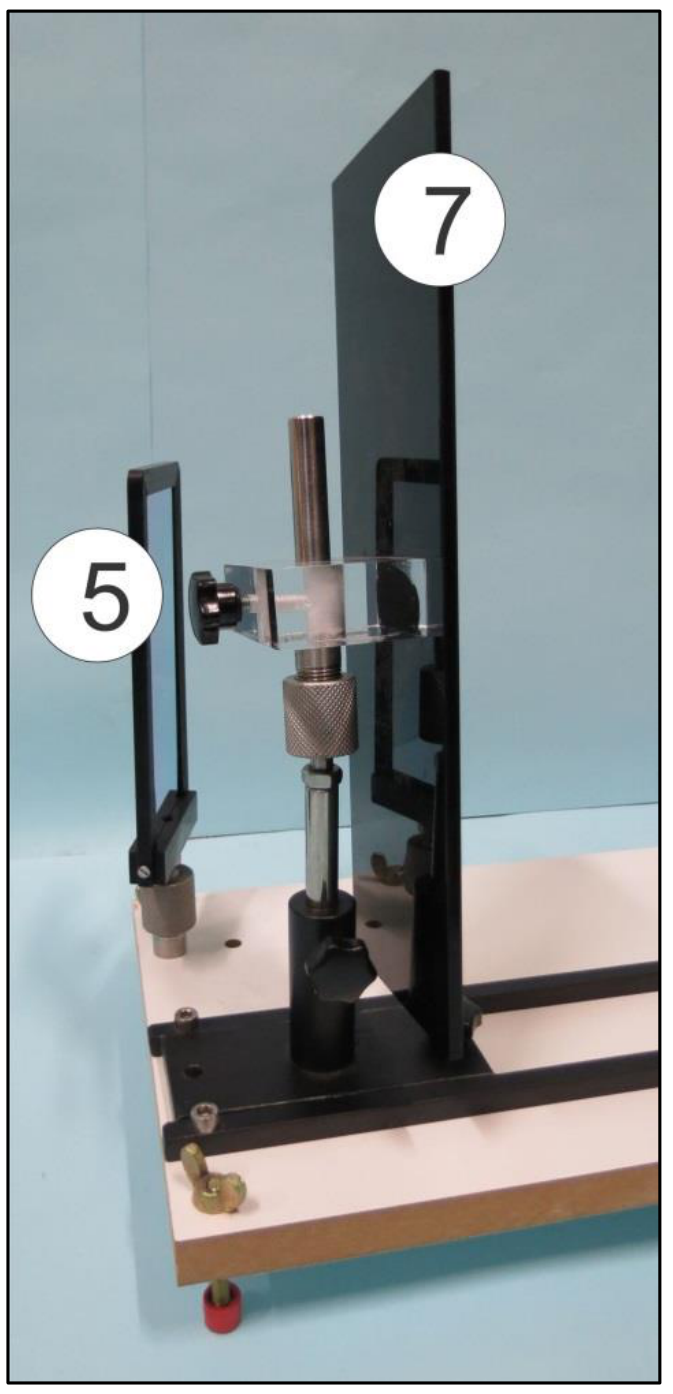
Sample holder with its base [4]: Use the top locking screw to affix the samples in it (Fig. 3). The sample holder can be adjusted horizontally, vertically and rotated.
Left reflector [5]: This reflector is fixed to the platform (Fig. 5). Do not use the side marked X.
Right reflector [6]: This reflector is fixed to the platform and is removable (It will be removed in experiment E-II). Do not use the side marked X.
Screen with its mount [7]: The screen is mounted on ball joint and a base allowing rotational adjustments in all directions (Fig 5). The screen can be fixed as shown in Fig. 2 or Fig. 6 as required.
Sample I [9]: A helical spring fixed on a circular mount using white acrylic plates.
Sample II [10]: A double-helix-like pattern printed on a glass plate which is fixed on a circular mount.
Digital caliper with a mount [14]: Digital caliper is fixed to a mount (the mount is required in E-II). It has an On/Off switch, a switch to reset the reading to zero, a mm/inch selector (keep on mm), a locking screw and a knob for moving the right jaw. The digital caliper can be used to make measurements on pattern marking sheets.
Pattern marking sheets [17]: The given pattern marking sheets can be folded in half and clipped onto the screen using the plastic clips. Ensure that you mark the diffraction pattern within the rectangular box.
Theory
A laser beam of wavelength , falling normally on a cylindrical wire of diameter , is diffracted in the direction perpendicular to the wire. The resulting intensity pattern as observed on a screen is shown in Fig. 7.
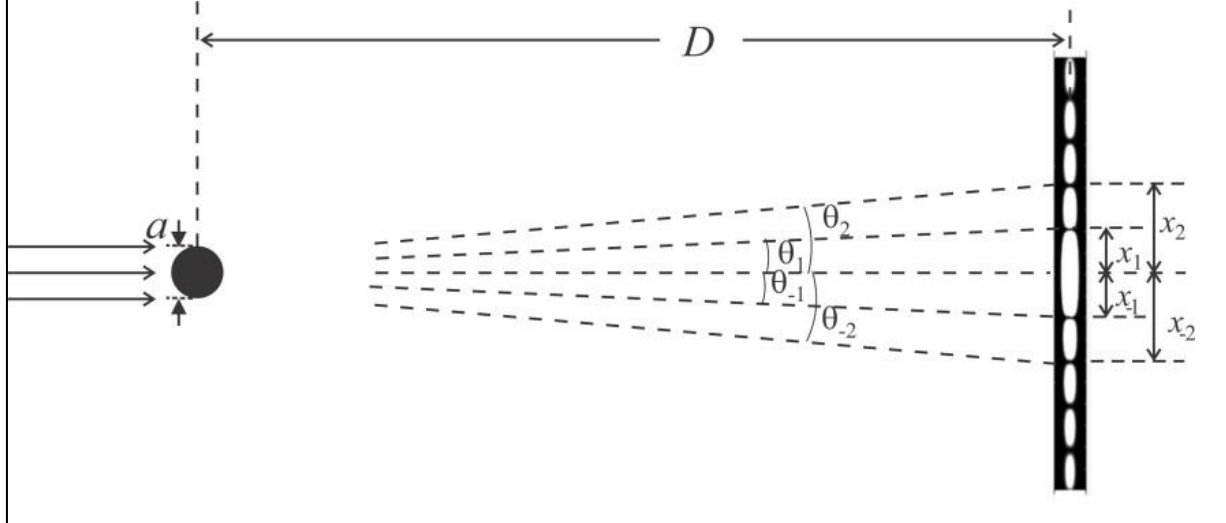
The intensity distribution as a function of angle with the incident direction is given by
The central spot is bright and for other angles, when () is zero, the intensity vanishes. Thus the intensity distribution has minimum at the angle , given by
Here refers to both sides of the central spot ().
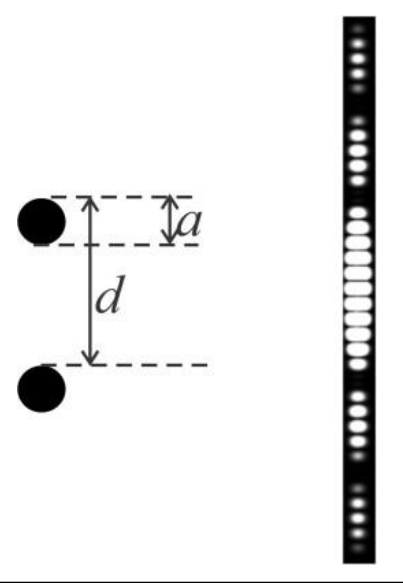
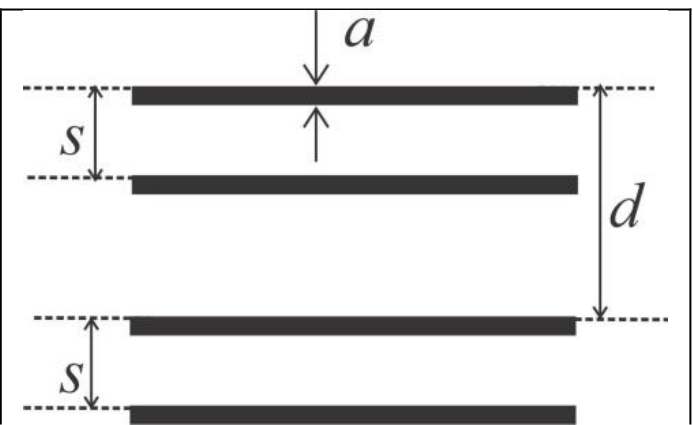
The diffraction pattern due to two parallel identical wires kept at a distance from each other (Fig. 8) is a combination of two patterns (diffraction due to a single wire and interference due to two wires). The resultant intensity distribution is given by,
where and
For a screen placed at a large distance from the wire, the positions of the minima on the screen are observed at due to diffraction and at due to interference (where ). Similarly for a set of four identical wires (Fig. 9), the net intensity distribution is a combination of diffraction from each wire and interference due to pairs of wires and hence depends on , and . In other words, the combination of three different intensity patterns is observed.
Initial adjustments
- Switch on the laser source and adjust both reflectors so that the laser spot falls on the screen.
- Use the plastic scale and adjust the laser mount and reflectors such that the laser beam is parallel to the wooden platform.
- Make sure that the laser spot falls near the centre of the screen.
- Switch off the laser source. Clamp the pattern marking sheet on the screen.
- Clamp the given plane mirror on the screen using plastic clips and switch on the laser again.
- Adjust the screen so that the laser beam retraces its path back to the laser source. Remove the mirror once your alignment is completed.
- Lights in the cubicle may be switched on/off as required.
Experiment
Part A: Determination of geometrical parameters of a helical spring²
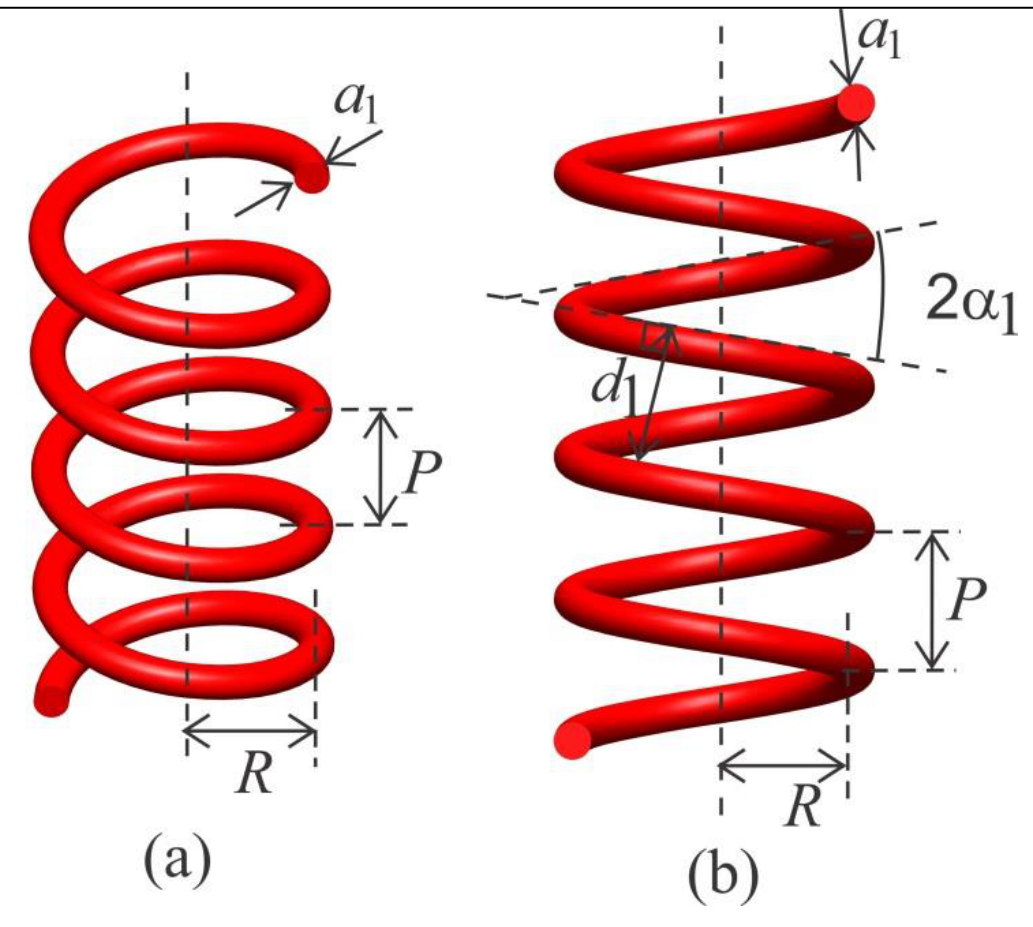
Sample I is a helical spring of radius and pitch made of a wire of uniform thickness as shown in Fig. 10(a). When viewed at normal incidence its projection is equivalent to two sets of parallel wires of the same thickness separated by distance and angle between them (Fig. 10(b)).
² Reference: G. Braun, D. Tierney and H. Schmitzer, Phys. Teach. 49, 140 (2011).
- Mount sample I in the sample holder ensuring that the spring is vertical.
- Obtain a clear and sharp X-shaped diffraction pattern on the pattern marking sheet.
- For this you may adjust
- laser beam focus (rotate lens cap)
- beam orientation (rotate the laser body so that only two turns of the spring are illuminated)
- laser intensity (high/low switch on power supply)
- ambient light (by switching on or off cubicle light)
If the central maximum is very bright, you may stick circular black stickers on the pattern marking sheet to reduce scattering.
A1 Mark the appropriate positions (using given pencil [13]) of the intensity minima to determine and on the both sides of the central spot on the pattern-marking sheet. Please label your pattern-marking sheets as P-1, P-2 etc. [0,7 т.]
A2 Measure the appropriate distances using digital calipers and record them in Table A1 for determining . [0,5 т.]
A3 Plot a suitable graph, label it Graph A1 and from the slope, determine . [0,7 т.]
A4 Measure the appropriate distances and record them in Table A2 for determining . [0,8 т.]
A5 Plot a suitable graph, label it Graph A2 and from the slope, determine . [0,6 т.]
A6 From the X-shaped pattern, determine the angle . [0,2 т.]
A7 Express in terms of and and calculate . [0,2 т.]
A8 Express in terms of and and calculate (neglect ). [0,2 т.]
Part B: Determination of geometrical parameters of double-helix-like pattern
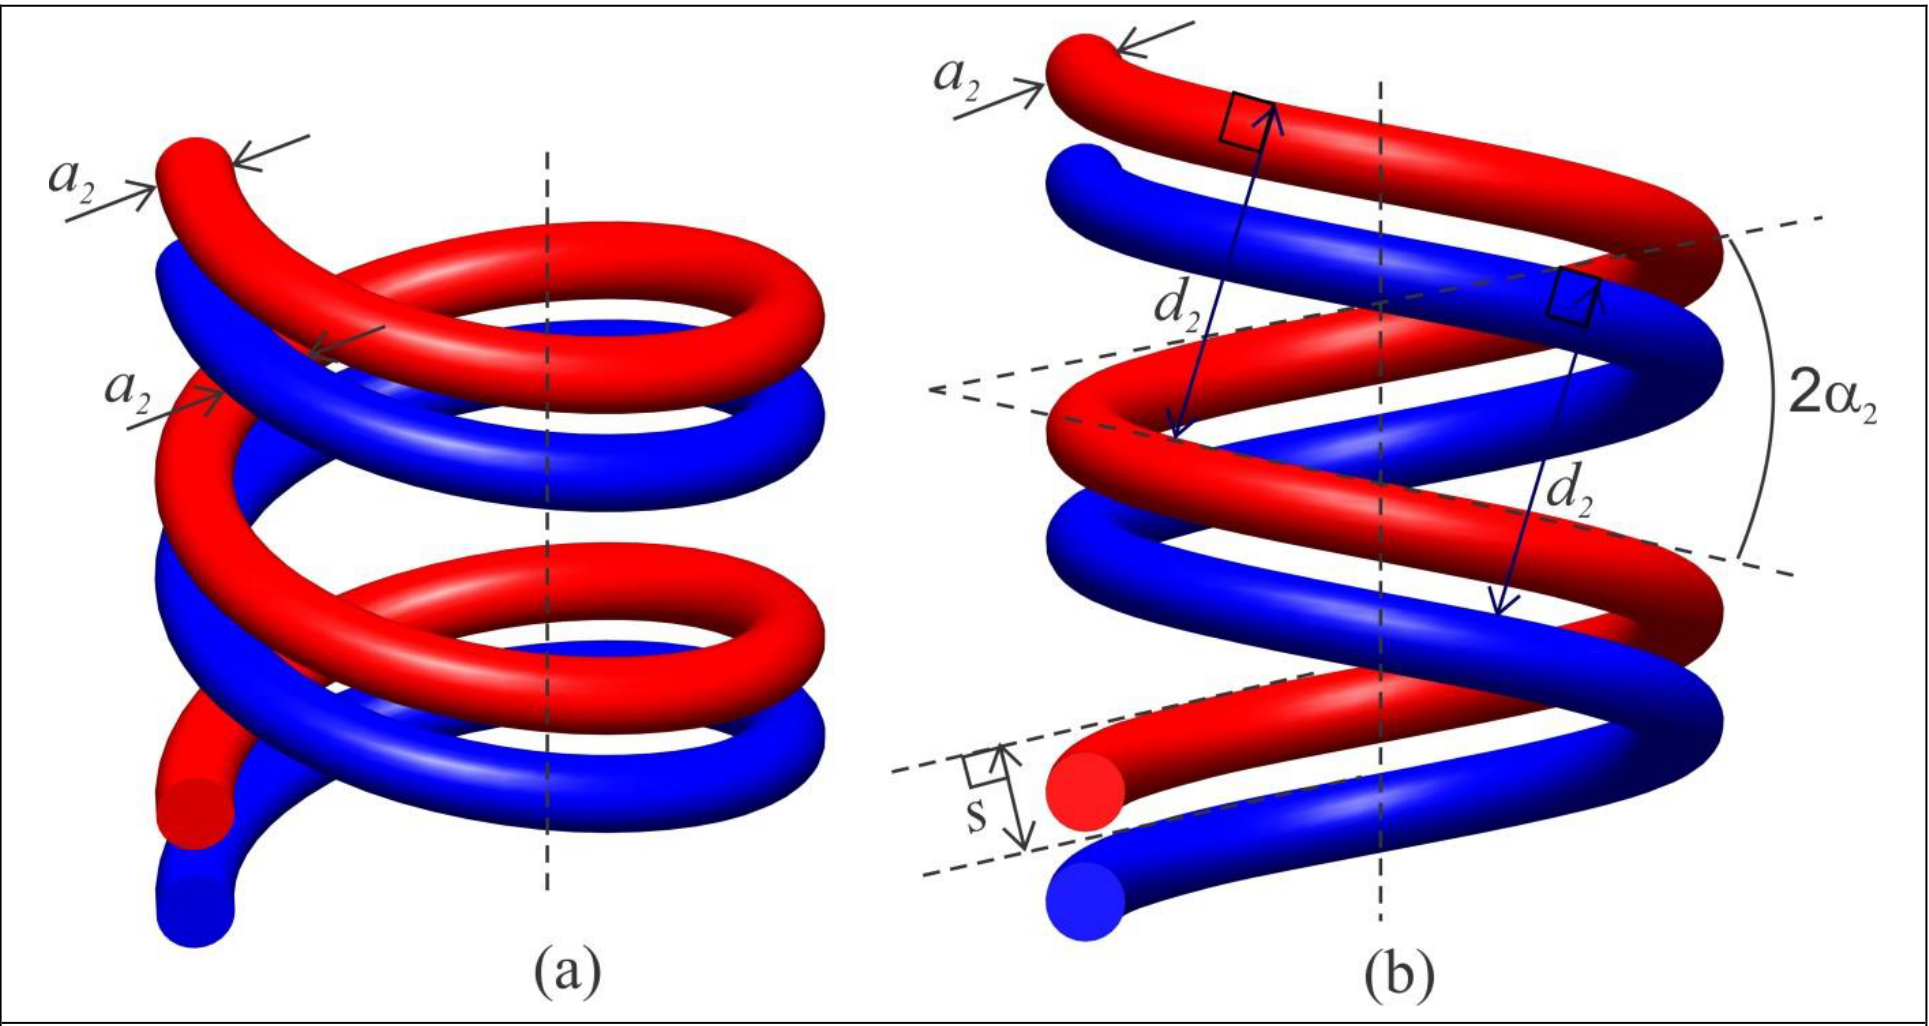
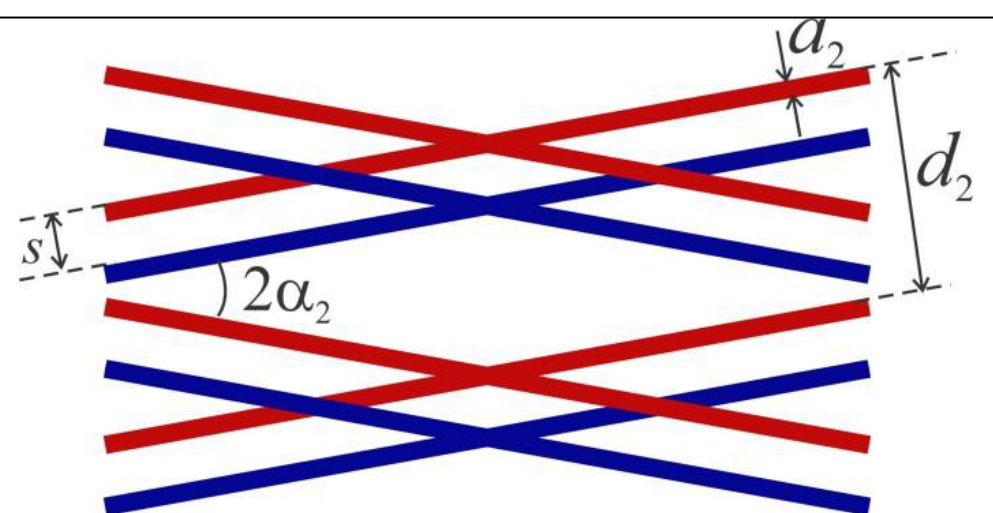
Figure 11(a) shows two turns of a double helix. Fig. 11(b) is a two-dimensional projection of this double helix when viewed at normal incidence. Each helix of thickness has an angle and perpendicular distance between turns. The separation between two helices is . Sample II is a double-helix-like pattern printed on glass plate (Fig. 12), whose diffraction pattern is similar to that of a double helix. In this part, you will determine the geometrical parameters of sample II.
- Mount the sample II in sample holder.
- Attach a new pattern-marking sheet on the screen.
- Obtain clear and sharp X-shaped diffraction pattern on the screen.
B1 Mark the appropriate positions of the minima on either side of the central spot to determine and . You can use more than one pattern marking sheets. [1,1 т.]
B2 Measure the appropriate distances and record them in Table B1 for determining [0,5 т.]
B3 Plot suitable graph, label it Graph B1 and from the slope, determine . [0,5 т.]
B4 Measure the appropriate distances and record them in Table B2 for determining . [1,2 т.]
B5 Plot suitable graph, label it Graph B2 and from the slope determine . [0,5 т.]
B6 Measure the appropriate distances and record them in Table B3 for determining [1,6 т.]
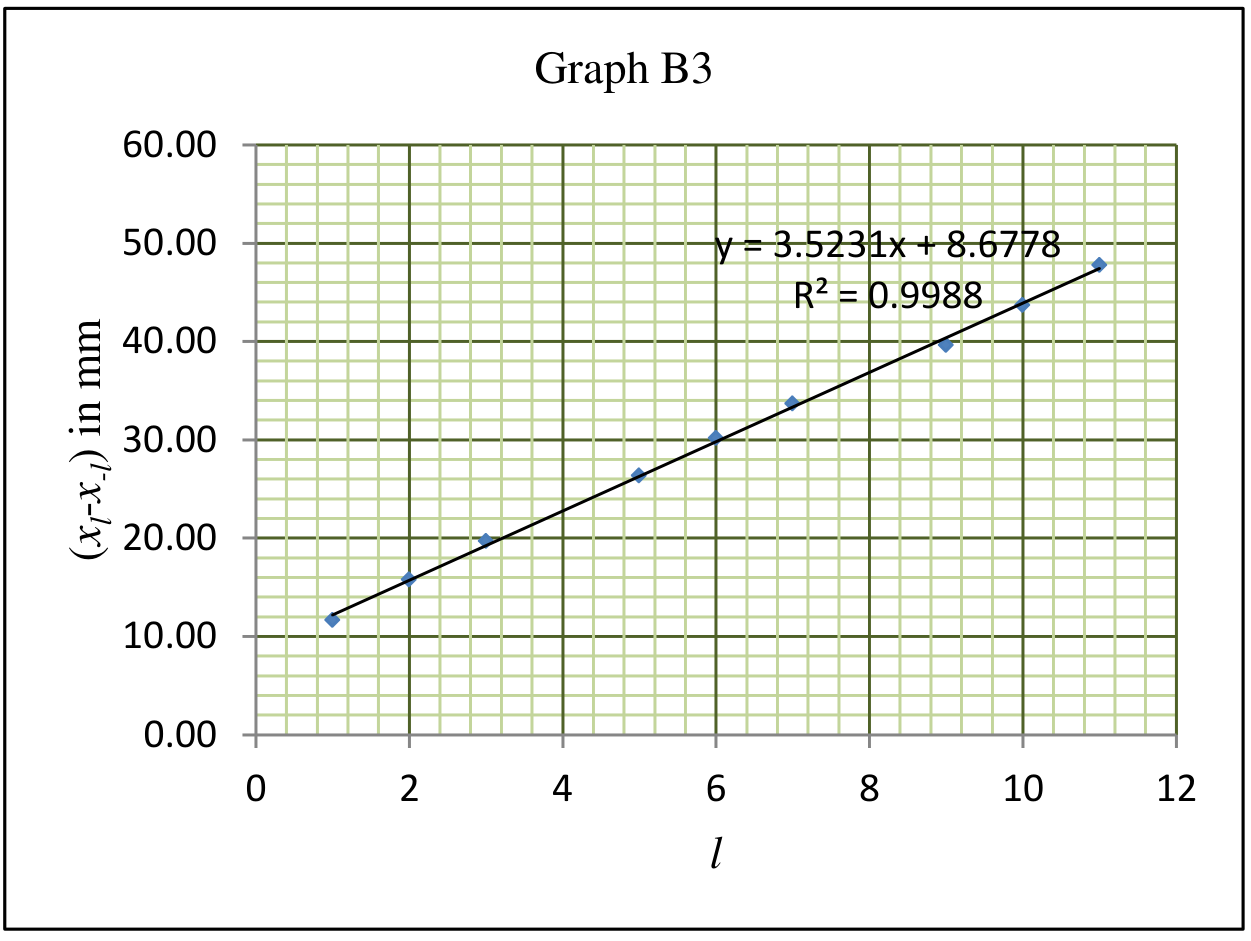
B7 Plot suitable graph, label it Graph B3 and from the slope, determine . [0,5 т.]
B8 From the X-shaped pattern, determine the angle . [0,2 т.]
Отговори
A3 0.151 mm
Sample value from the official solution; the result depends on the individual apparatus.
A5 0.89 mm
Sample value from the official solution.
A6 10.96 °
Sample value from the official solution.
A7
Numerical value is the official sample value.
A8
Numerical value is the official sample value.
B3 0.049 mm
Sample value from the official solution.
B5 0.248 mm
Sample value from the official solution.
B7 1 mm
Sample value from the official solution (printed 1.00 mm).
B8 9.88 °
Sample value from the official solution.
Решение
Part A: Determination of geometrical parameters of a helical spring
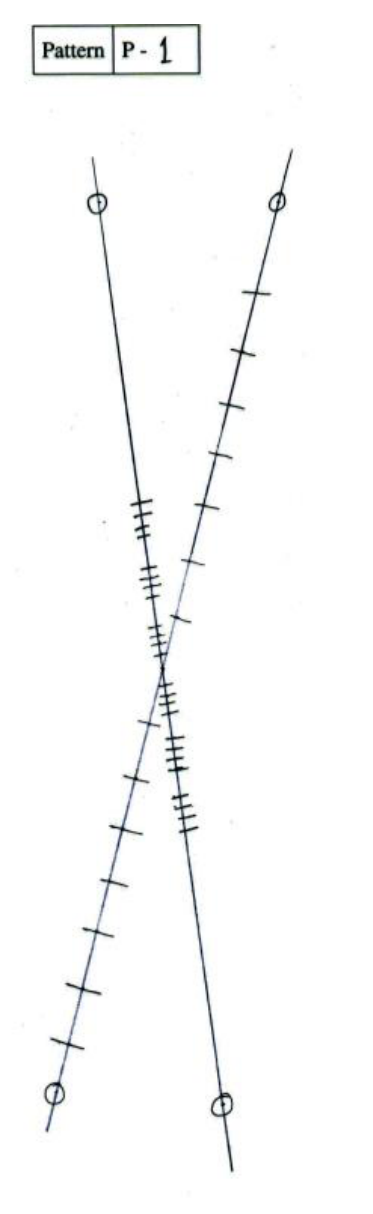
A1 (Marks: 0.7) Number of attached pattern marking sheet(s) for Part A: 2 with label(s): P1, P2 (patterns on page 7)
A2 (Marks: 0.5)
Table A1: Observations from pattern P1
| Sr. No. | Order () | in mm |
|---|---|---|
| 1 | 1 | 24.40 |
| 2 | 2 | 47.24 |
| 3 | 3 | 70.69 |
| 4 | 4 | 94.08 |
| 5 | 5 | 117.53 |
| 6 | 6 | 140.28 |
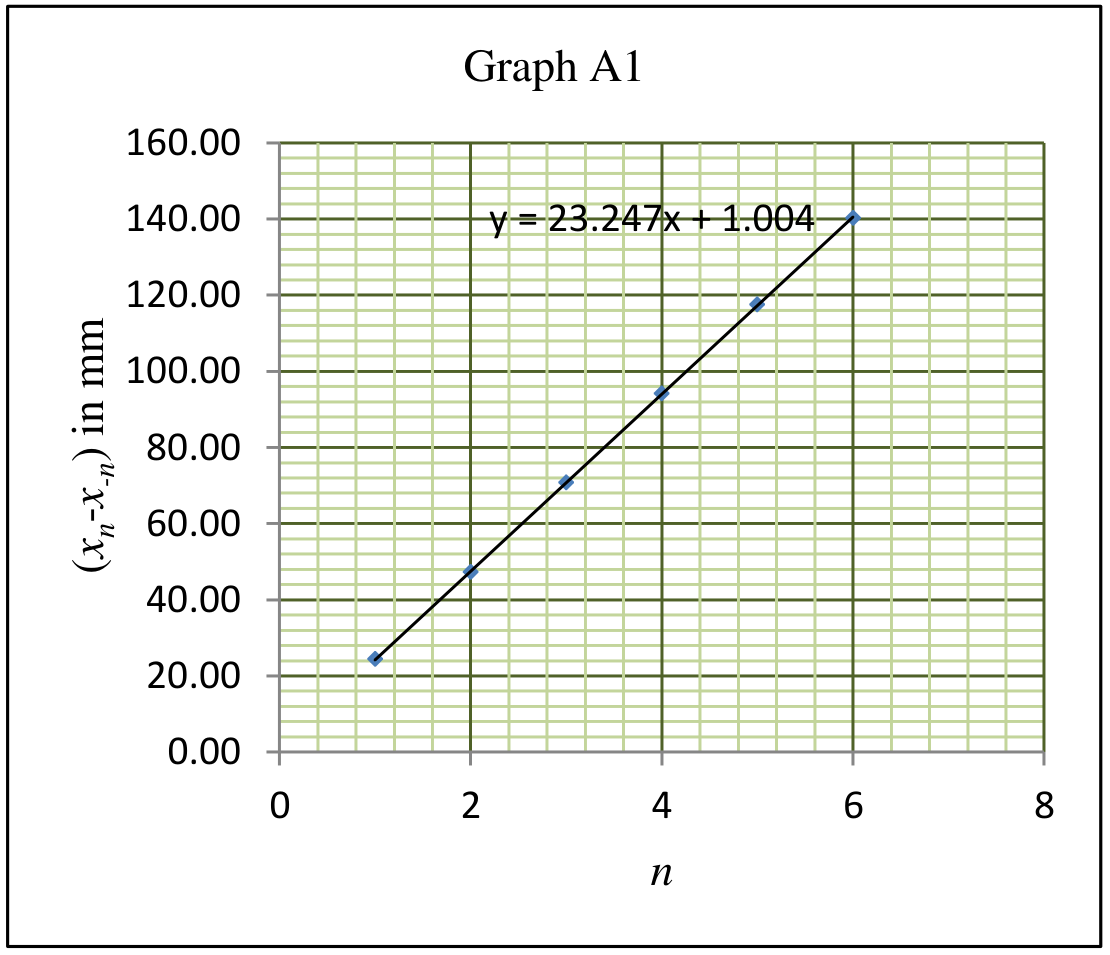
A3 (Marks: 0.7)
Graph A1 for determination of : versus
Slope of the graph A1 = 23.25 mm
Calculation of :
A4 (Marks: 0.8)
Table A2: Observations from pattern P1
| Sr. No. | in mm | |
|---|---|---|
| 1 | 1 | 9.39 |
| 2 | 2 | 13.43 |
| 3 | 3 | 17.53 |
| 4 | 6 | 28.98 |
| 5 | 7 | 33.53 |
| 6 | 8 | 37.66 |
| 7 | 9 | 41.61 |
| 8 | 12 | 52.93 |
| 9 | 13 | 56.76 |
| 10 | 14 | 61.03 |
| 11 | 15 | 64.74 |
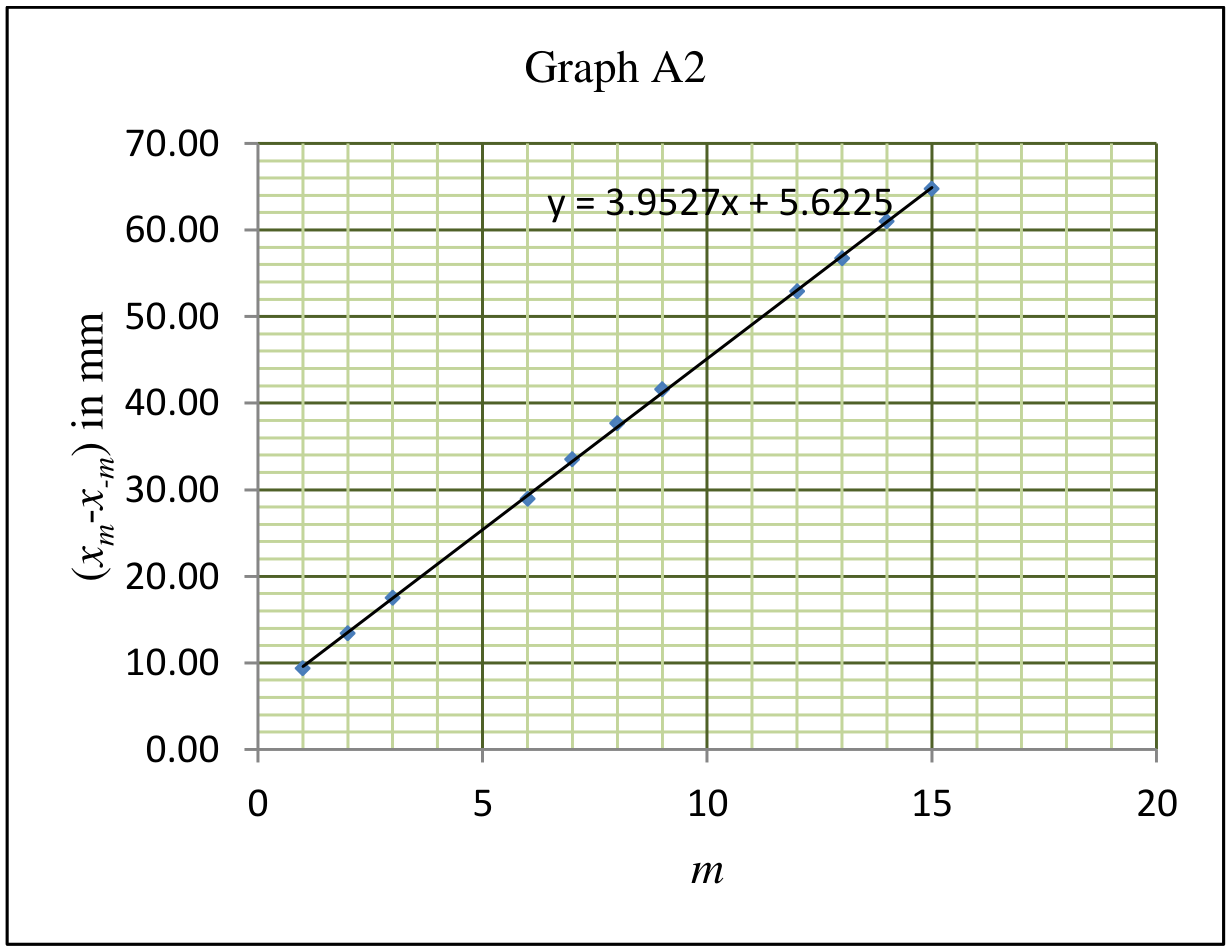
A5 (Marks: 0.6)
Graph A2 for determination of : versus
Slope of the graph A2 = 3.95 mm
Calculation of :
A6 (Marks: 0.2)
A7 (Marks: 0.2) Expression of in terms of and :
A8 (Marks: 0.2) Expression of in terms of and :
Total 3.9
Part B: Determination of geometrical parameters of double-helix-like pattern
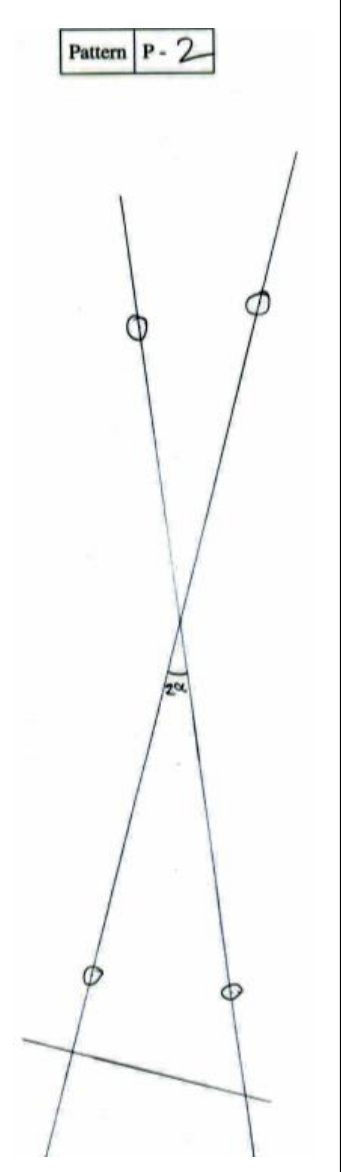
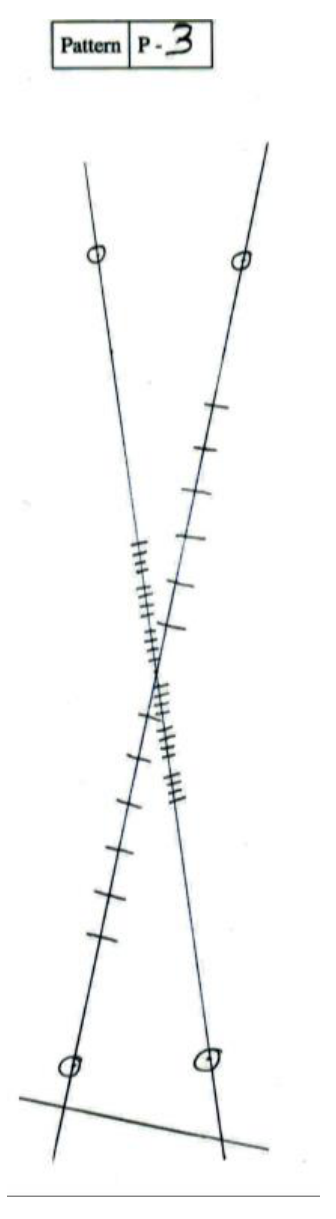
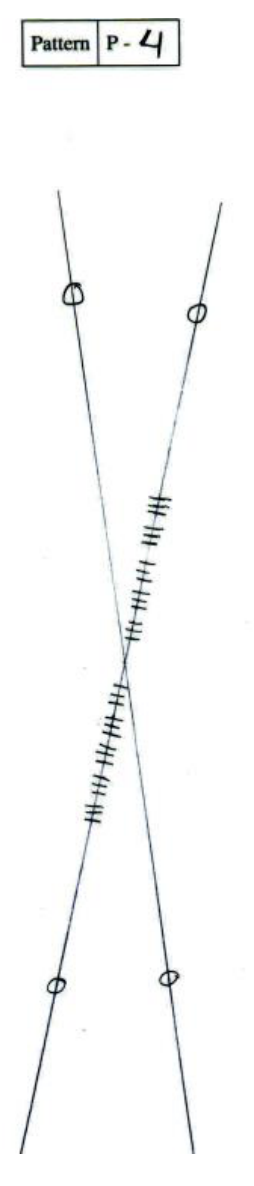
B1 (Marks: 1.1) Attached pattern marking sheet number(s): 2 with label(s): P3, P4 (patterns on page 7)
B2 (Marks: 0.5)
Table B1: Observations from pattern P3
| Sr. No. | Order () | in mm |
|---|---|---|
| 1 | 1 | 21.24 |
| 2 | 2 | 41.12 |
| 3 | 3 | 62.41 |
| 4 | 4 | 84.40 |
| 5 | 5 | 104.41 |
| 6 | 6 | 124.25 |
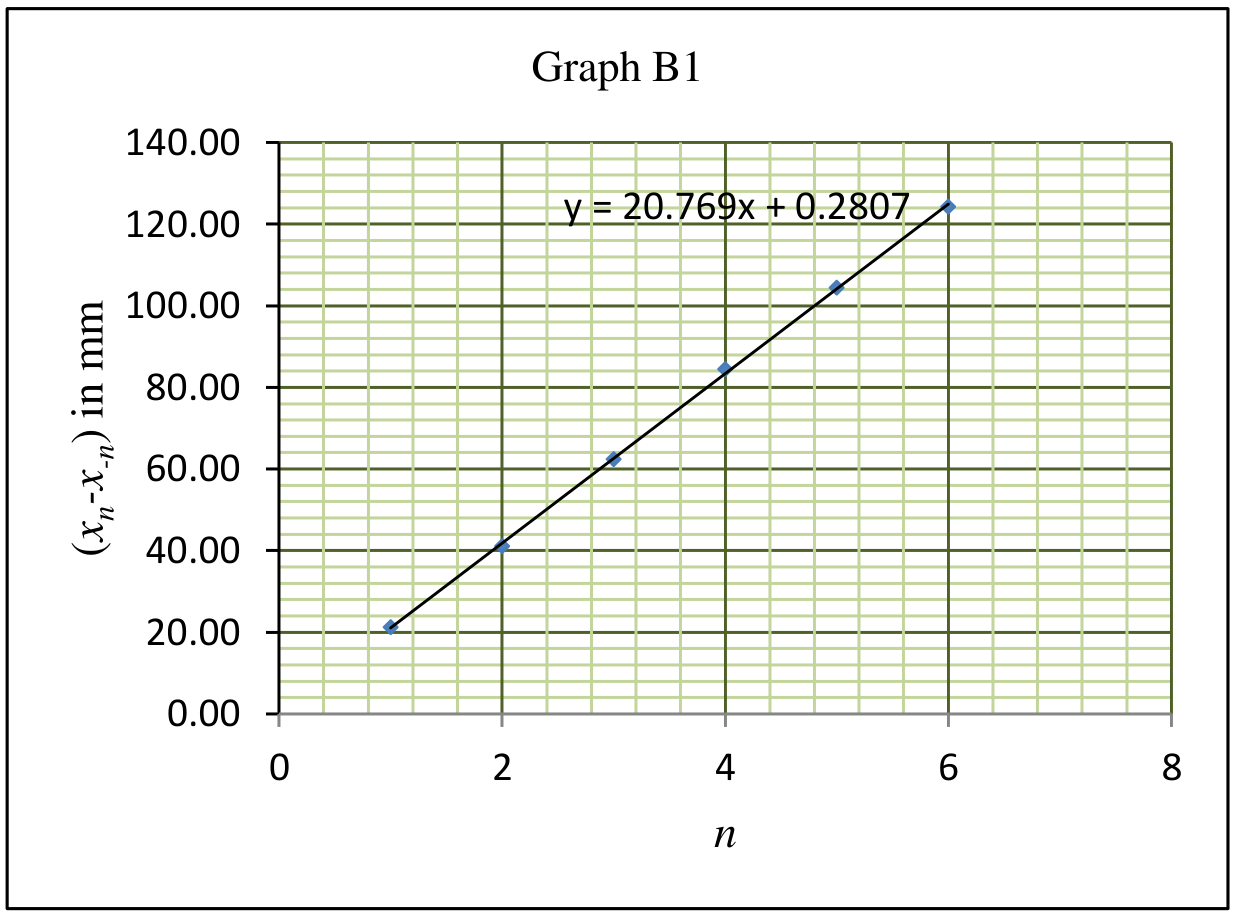
B3 (Marks: 0.5)
Graph B1 for determination of : versus
Slope of the graph B1 = 20.8 mm
Calculation of :
B4 (Marks: 1.2)
Table B2: Observations from pattern P3
| Sr. No. | in mm | |
|---|---|---|
| 1 | 1 | 5.84 |
| 2 | 2 | 10.29 |
| 3 | 3 | 14.83 |
| 4 | 4 | 18.84 |
| 5 | 6 | 26.44 |
| 6 | 7 | 30.65 |
| 7 | 8 | 35.26 |
| 8 | 9 | 38.34 |
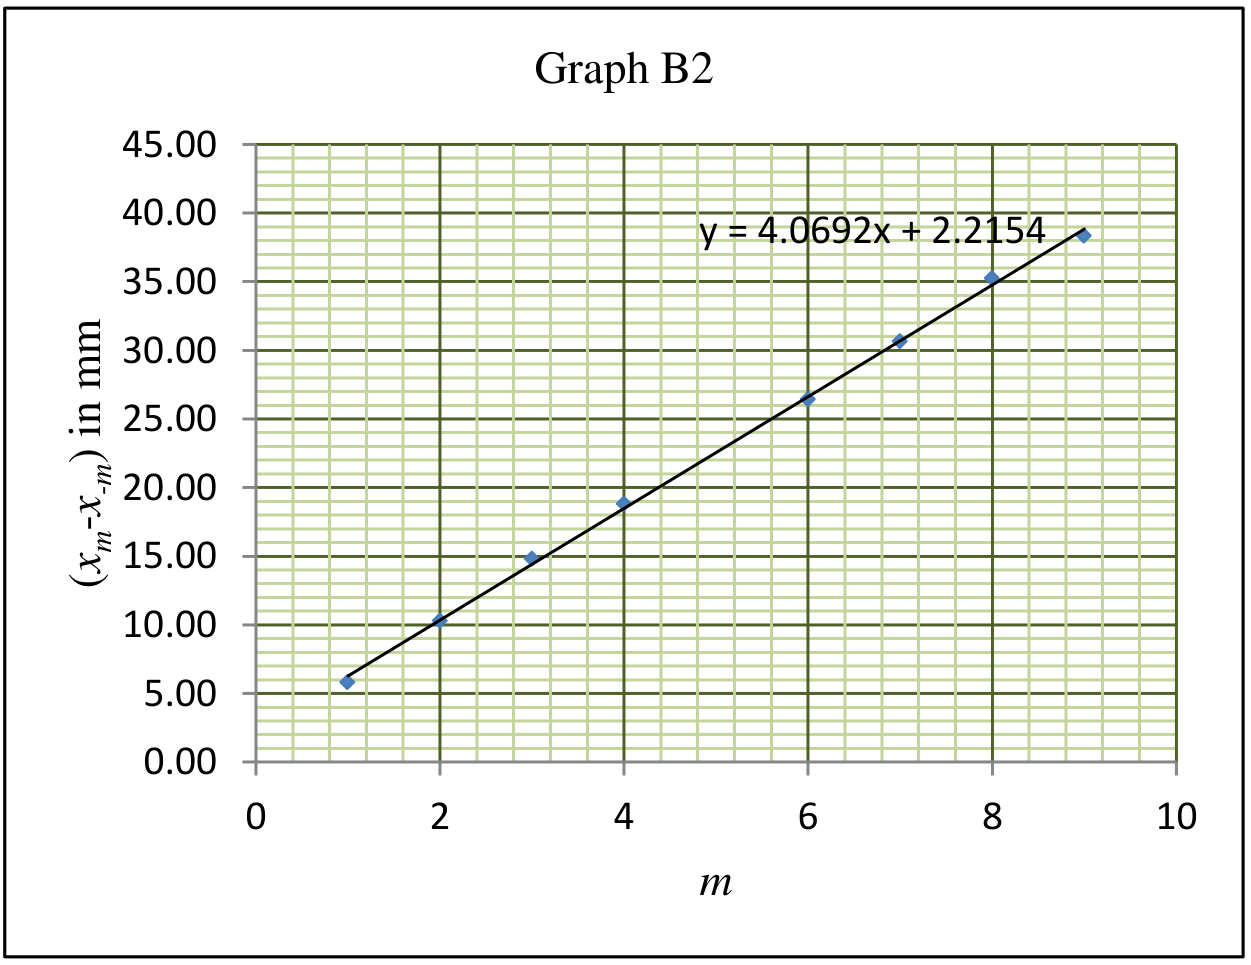
B5 (Marks: 0.5)
Graph B2 for determination of : versus
Slope of the graph B2 = 4.07 mm
Calculation of :
B6 (Marks: 1.6)
Table B3 Observations from pattern P4
| Sr. No. | Order () | in mm |
|---|---|---|
| 1 | 1 | 11.64 |
| 2 | 2 | 15.77 |
| 3 | 3 | 19.71 |
| 4 | 5 | 26.33 |
| 5 | 6 | 30.14 |
| 6 | 7 | 33.69 |
| 7 | 9 | 39.62 |
| 8 | 10 | 43.70 |
| 9 | 11 | 47.75 |
B7 (Marks: 0.5)
Graph B3 for determination of : versus
Slope of the graph B3 = 3.52 mm
Calculation of :
B8 (Marks: 0.2)
Total 6.1
Reference for Part A : G. Braun, D. Tierney and H. Schmitzer, Phys. Teach. 49, 140 (2011).
Patterns
Pattern P2: ,
Pattern P3: ,
Оригинал в Архива: exp1.pdf · официални решения: exp1_sol.pdf