IPhO 2019, Експеримент — Задача 1.1. Part A: The refractive index of a disk
IPhO Israel 2019. Experiment Q1. Optical Measurements · 5,5 т.
Optical Measurements
In this experiment, we will measure the optical properties of samples at the highest achievable accuracy using the available equipment.
Note: under your table you can find 2 big water bottles that you need to use for the second experiment - do not drink them.
In part A, we will use two different methods to measure the refractive index of a transparent disk. The first method is traditional, while the second one is original and enables a higher level of accuracy.
In part B, we will measure the ratio between the laser wavelength and the lattice constant of a diffraction grating , aiming at achieving the highest possible level of accuracy.
In part C, we will measure the refractive index of a triangular prism, again – attempting to reach the highest level of accuracy.
For the experiments, the exam hall will be darkened for 100 minutes, starting 20 minutes after the exam begins (you may use a table lamp when needed). It is more convenient to perform the measurements of part A in the dark, but it is still possible to perform most of them in light as well.
You may use the walls of your cubicle as a screen, and apply adhesive tapes to the cubicle walls.
In these experiments, you are using a diode laser as a light source.
Laser safety instructions:
- NEVER look directly into the laser beam!
- In all experiments, the laser beam is horizontal. When measuring the position of the laser beam on a surface make sure your head is ALWAYS above the level of the beam.
- Do not aim the laser beam toward the opening of the experimental cubicle.
- Turn the laser off using the designated switch whenever you are not performing measurements.
Equipment list
Pieces of equipment 1-9 are used in all parts of the question, and pieces of equipment 10-12 are used in separate parts of the questions. Note that you are given multiple pieces of optical equipment - make sure not to touch their vertical sides directly, to avoid fouling their surfaces.
- Ruler, 60 cm long
- Slider that can move along the ruler
- Laser source, mounted on the slider. The laser can be set at two heights, or levels: low level 3A for part A and high level 3B for parts B and C. The on/off switch of the laser is shown in the figure as 3C
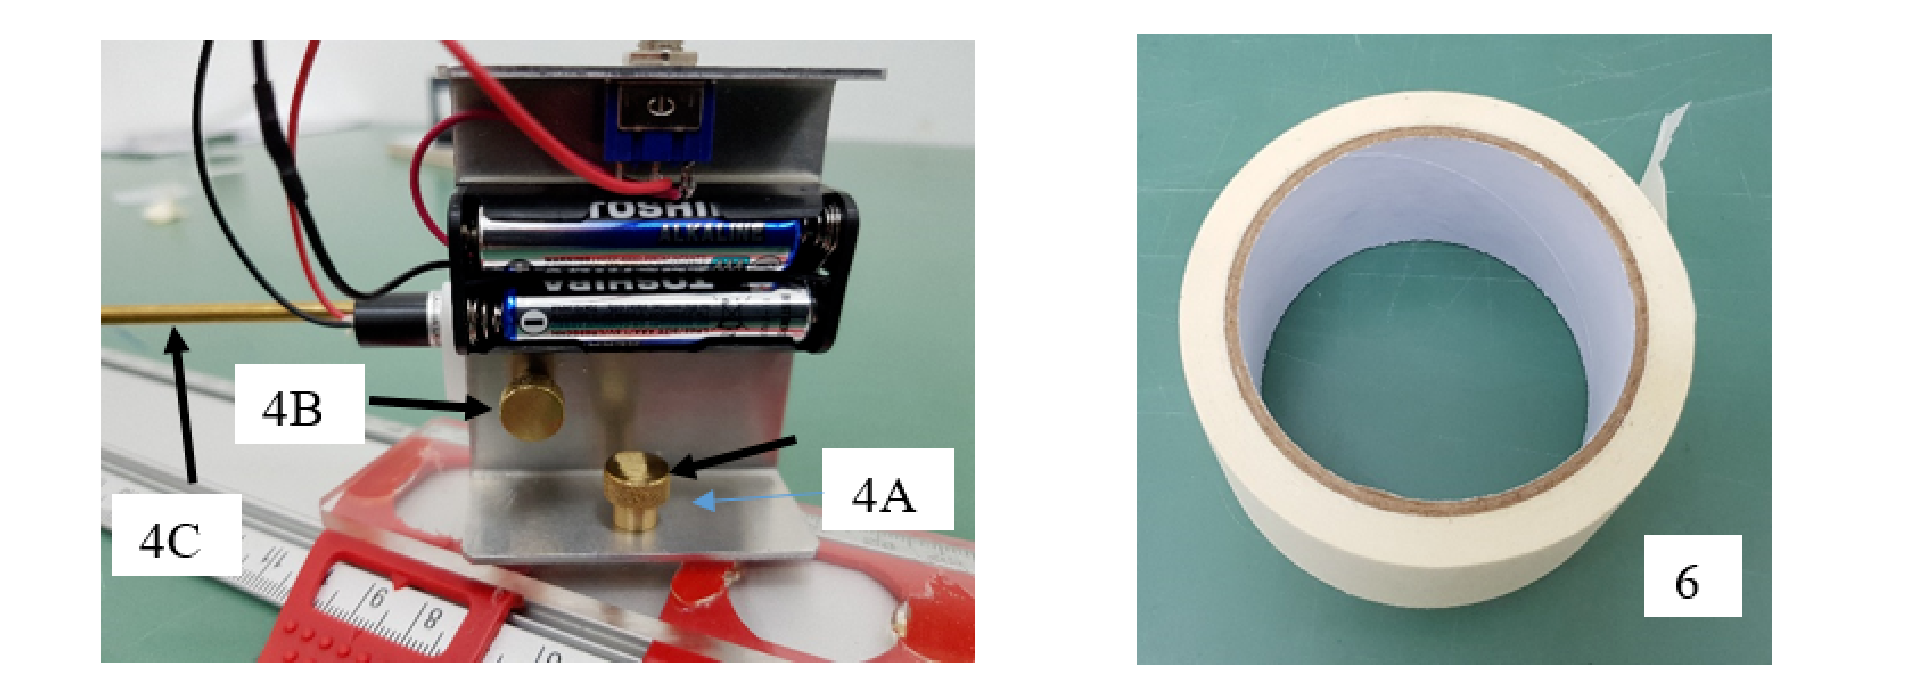
- The tension of screws 4A and 4B controls the resistance to rotation and therefore the stability of the apparatus. Use the small metal bar 4C to change the direction of the laser. Rotate 4C by 180 degrees to change the height of the laser. Do not rotate the laser around the beam axis, since the beam polarisation is pre-tuned.
- Screen: you may use the cubicle walls; you may assume the walls are perpendicular to each other
- A roll of adhesive tape which may be used to affix equipment to the table
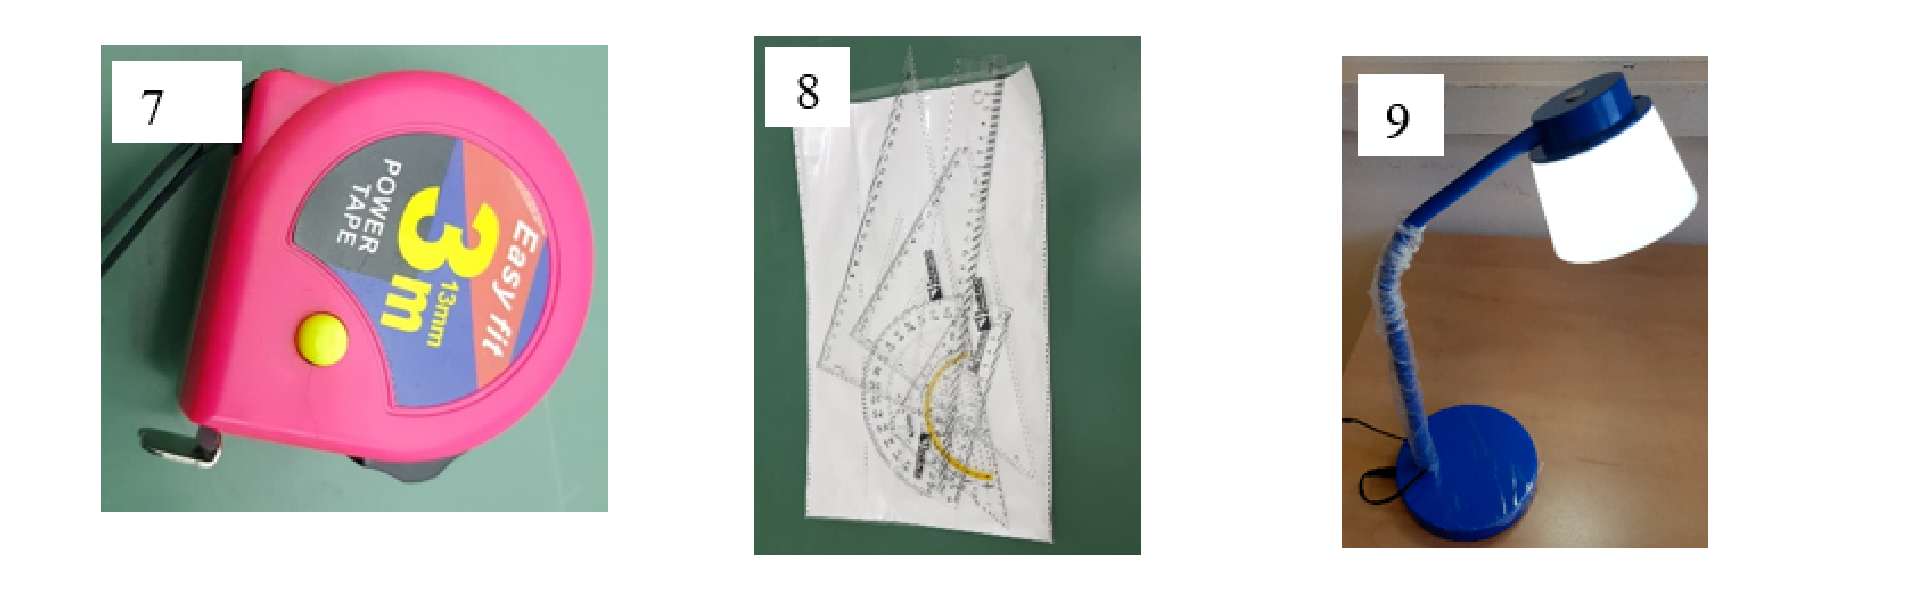
- Flexible measuring tape
- A variety of rulers
- Table lamp
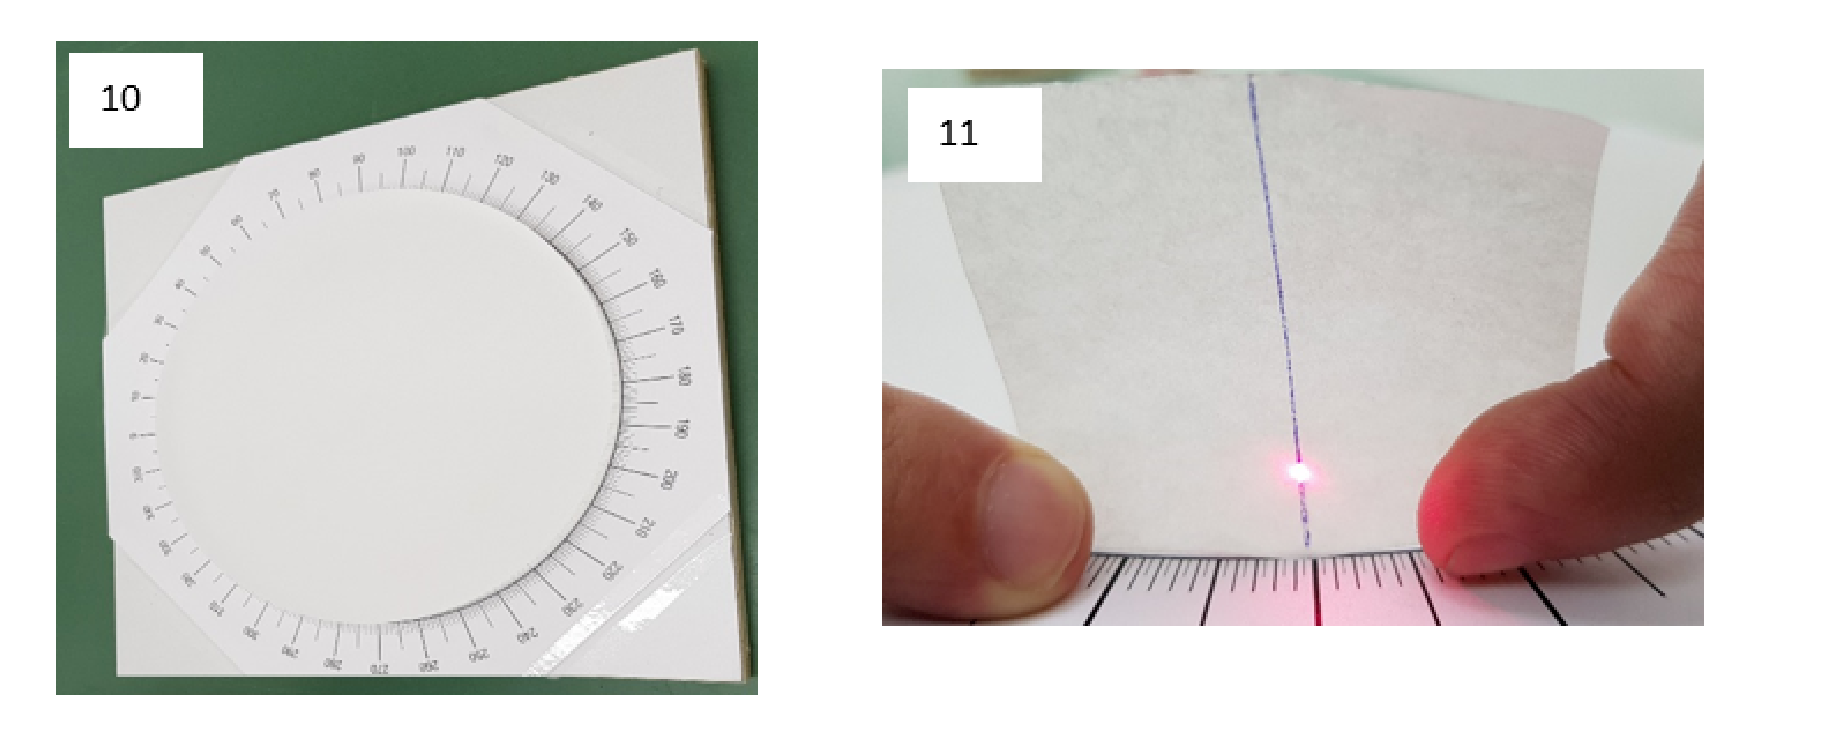
- Round transparent disk with a diameter of 20.00 cm, fixed on a protractor, which is glued to a wooden base (for part A). You should remove the 4 small wooden cubes attached to the wooden base
- Parchment paper that can be used as a transparent screen to be temporarily attached (by hand) to the side of the disk, allowing measuring the exit point without fouling the polished disk surface (for part A). It is more accurate to measure the beam exit point if you draw a line on the paper as shown in the figure.
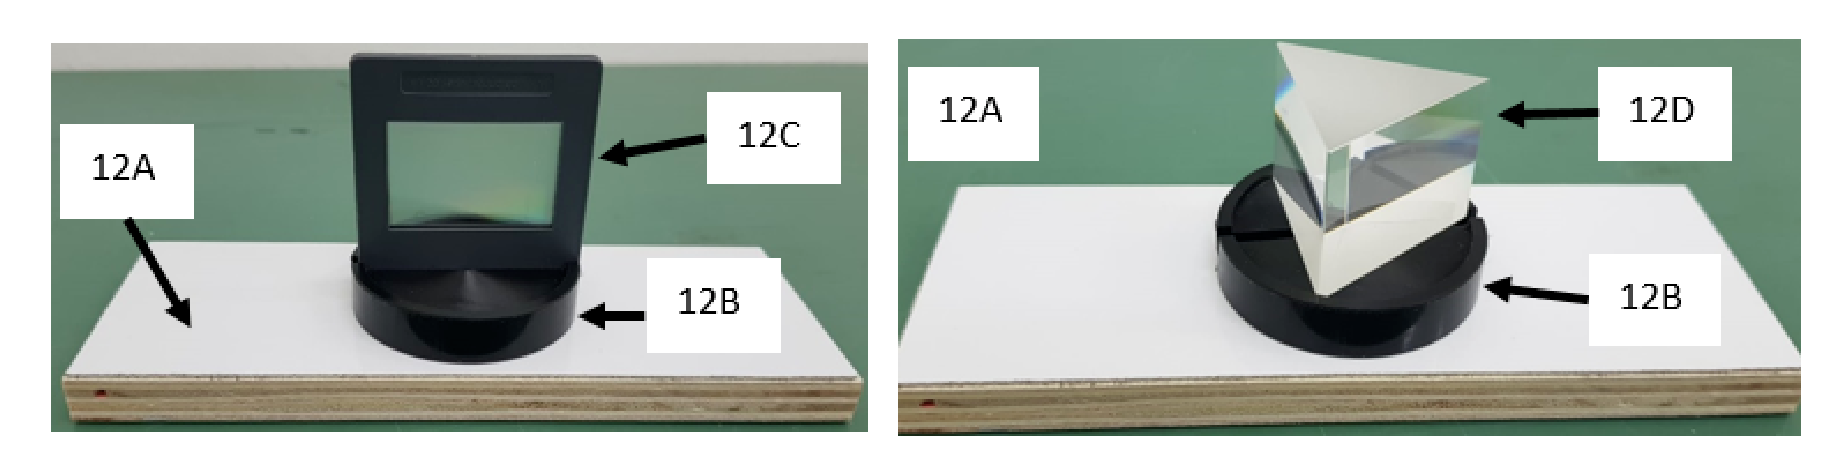
- A wooden piece (12A) and a cylinder holder (12B) capable of rotating along its vertical axis, for mounting the diffraction grating (12C) or the triangular prism (12D)
Photographs of the equipment are shown with Part A.
Условие
In this part, we will measure the refractive index of a transparent disk by observing the path taken by a beam of light as it is refracted and reflected inside the disk.
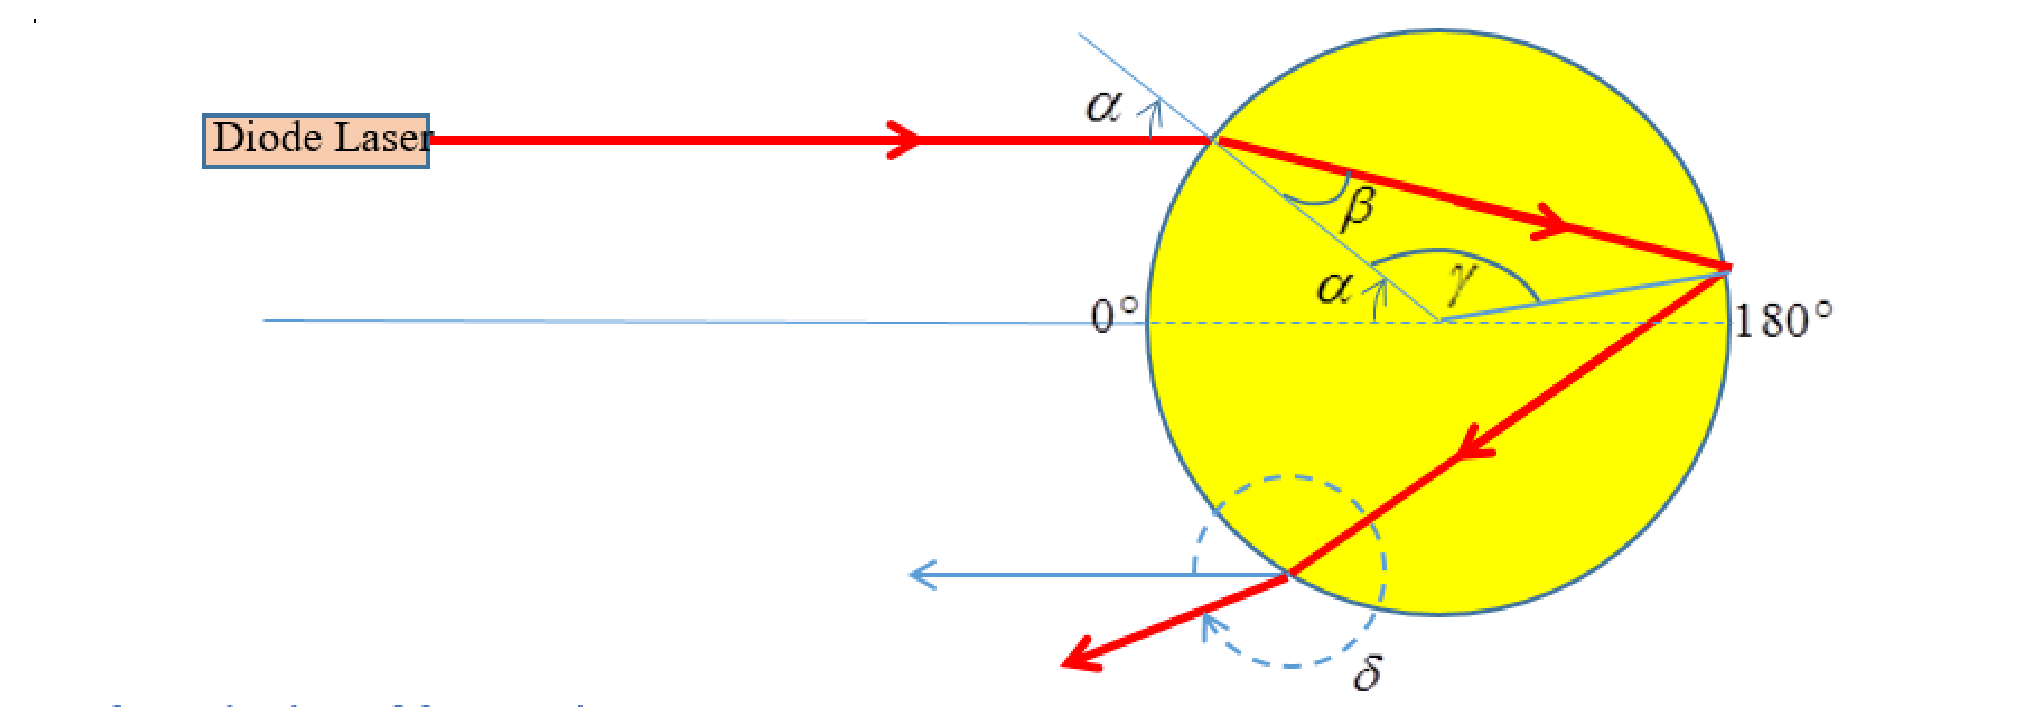
Definitions and symbols:
| The incident angle between the disk and the incoming beam | |
| The angular spread of the incident angle, i.e. the size of the range of values of the incident angle | |
| The refraction angle inside the disk | |
| The refractive index of the disk material | |
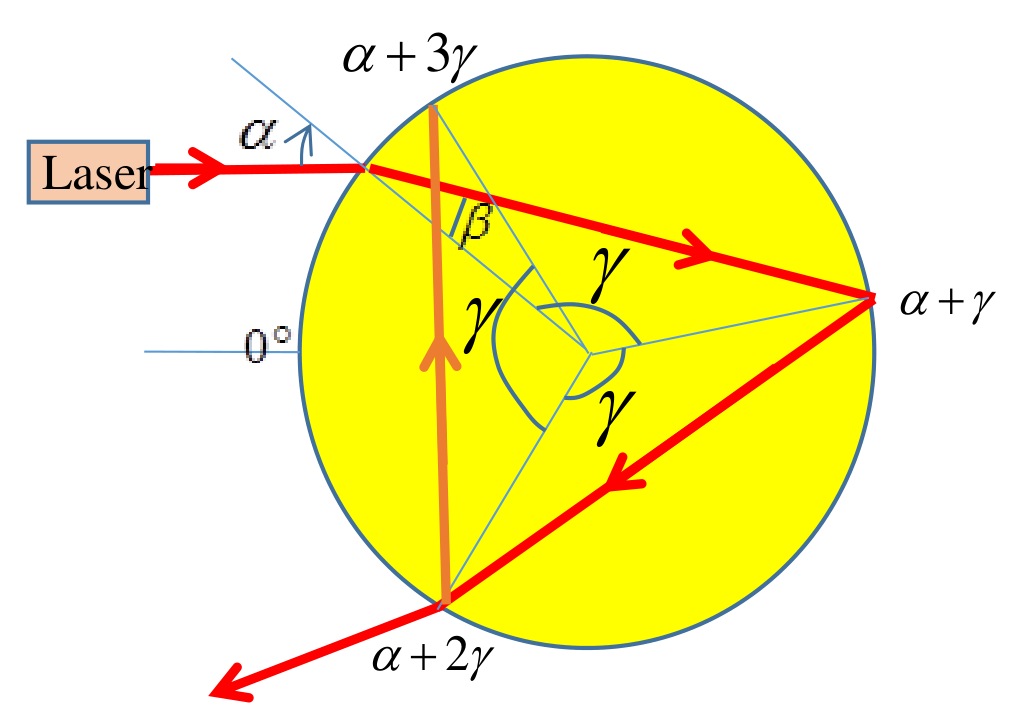
| The number of times the beam hits the disk’s boundary before emerging from the disk into the air (in the sketch, ) | |
| The angle between the direction opposite to that of the incoming beam and the direction of the outgoing beam, measured clockwise (the sketch shows the angle for ) | |
| The angular spread of |
It is possible to show that the angles , and are related by:
You may use this equation without deriving it.
Affix the ruler to the table in order to control the incident angle of the laser beam, using the adhesive tape, and adjust the laser in a way that will allow you to easily measure the incident angle. Then, affix the disk to the table by attaching the adhesive tape to the corners of the exposed wooden base and the table. Adjust inclination with the metal bar 4C. The laser may be set to two different heights: the low level for part A and the high level for parts B and C. The laser was tuned in advance so that the incident beam will be in the S polarization (a polarization in which the reflection is higher). Do not change the polarization of the incident beam (do not rotate the laser around the beam axis)!
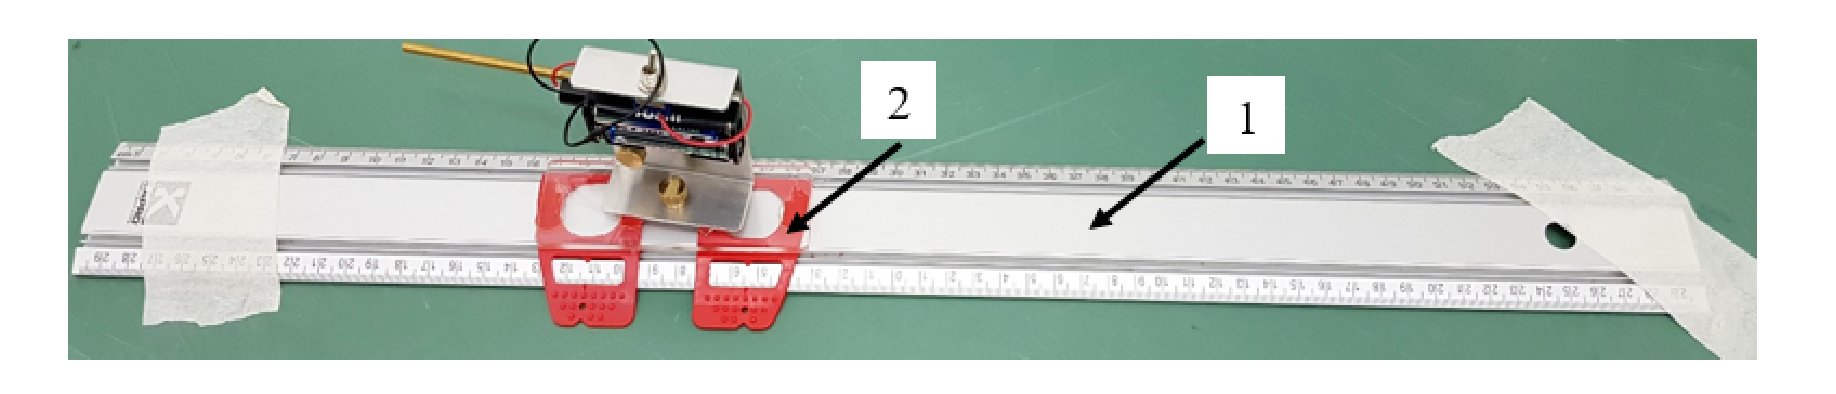
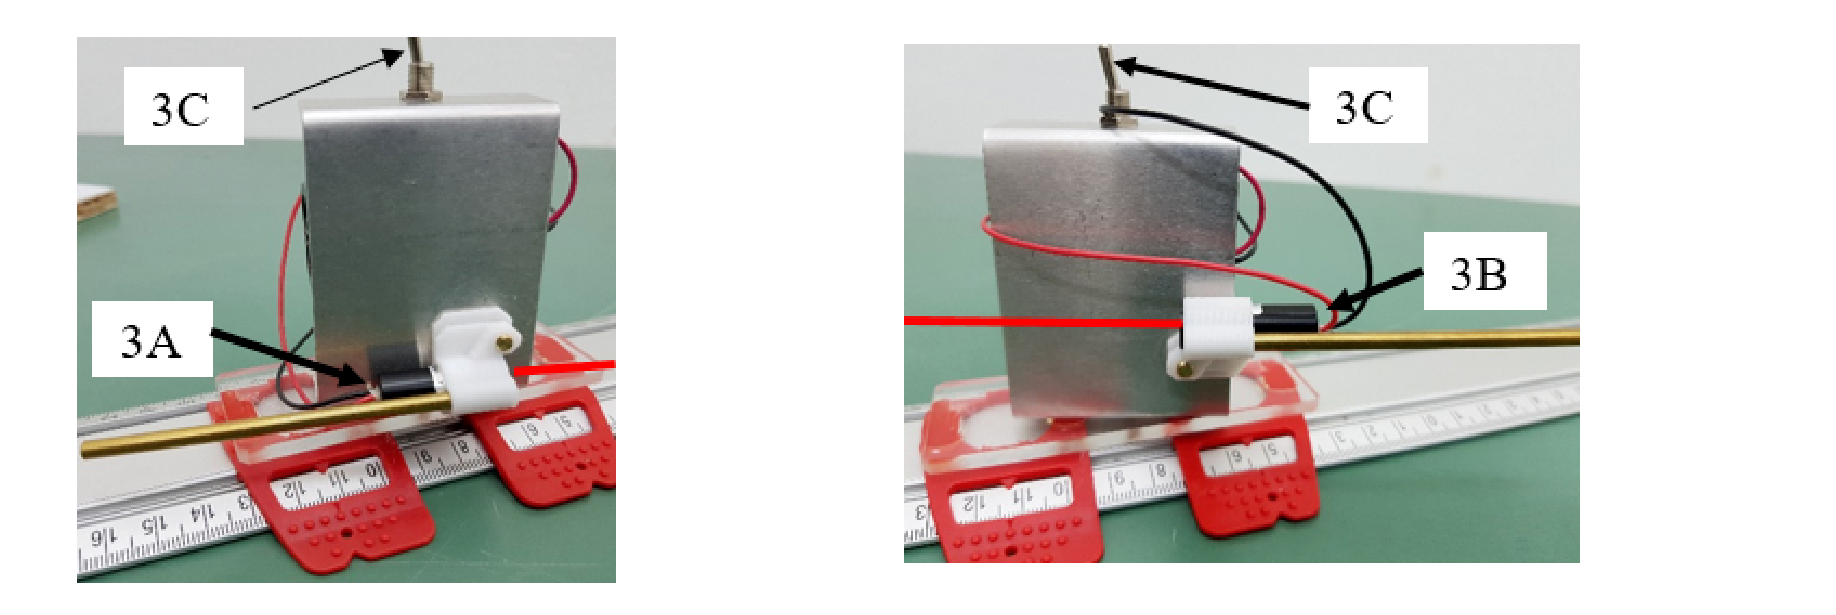
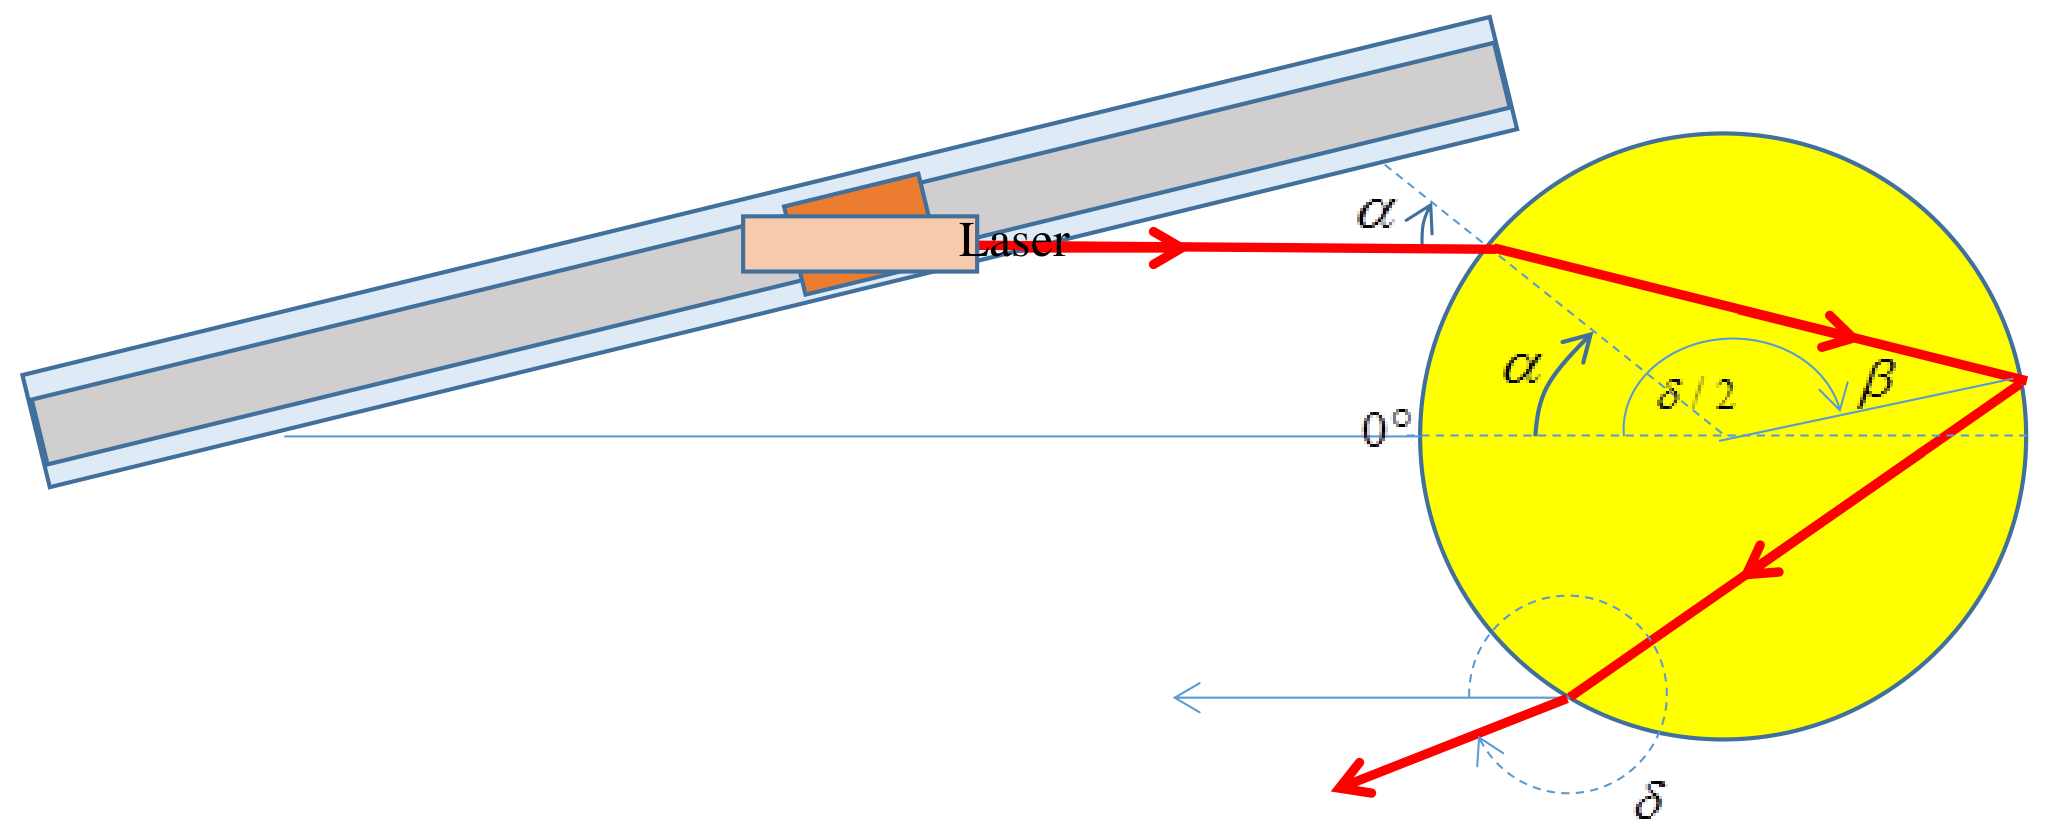
A.1 Draw a sketch of the system showing the ruler with the slider, the disk, and the path taken by the laser beam. Indicate the incident angle .
Perform a series of measurements between the angles , and write down in Table 1.
Note: for measuring , it is more convenient to measure directly on the disk. [1 т.]
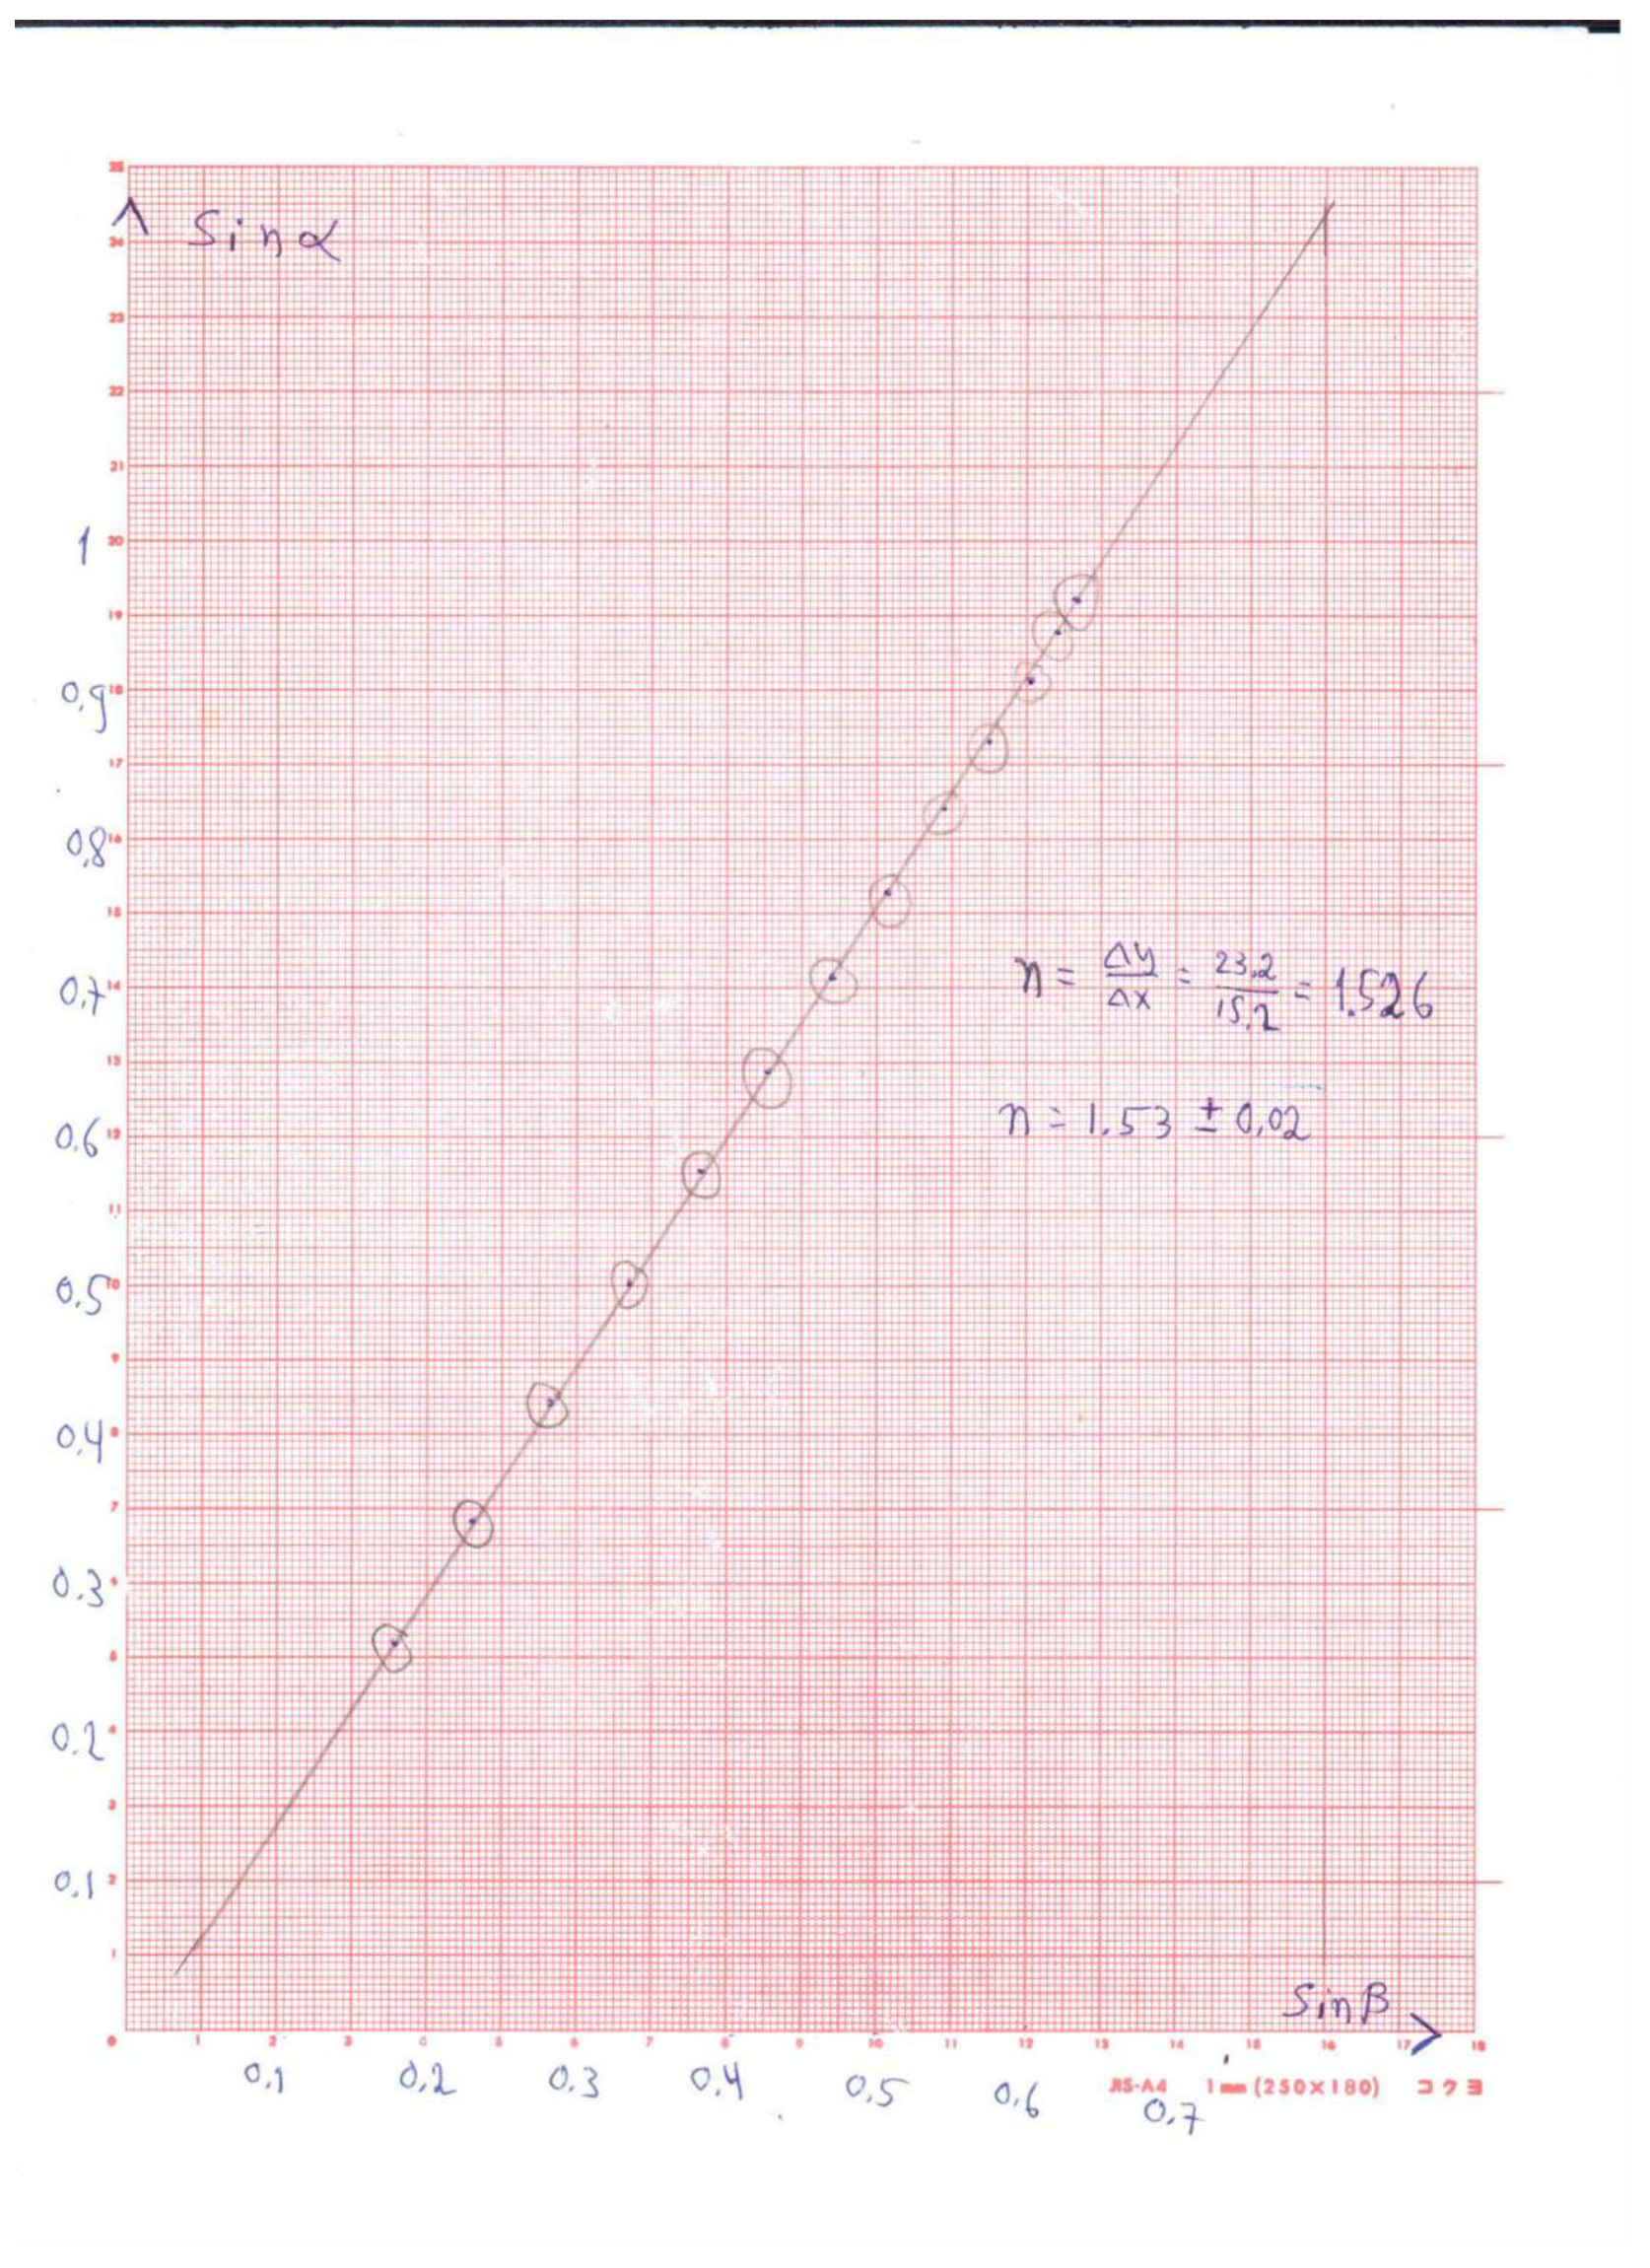
A.2 Using the measurement from the previous step, draw the appropriate graph, from which you can extract the refractive index and the error . Should you need to calculate additional quantities, fill the calculated numbers in the empty columns of Table 1. Find and . [1 т.]
A.3 For the measurements performed in A1, draw a graph of as a function of . Mark on each measured point the values of and using bars. Make an additional measurement to accurately find the minimal , and the corresponding . Denote them by and .
In order to identify the minimum point most accurately, you may use the walls of your cubicle as a screen for the outgoing beam. [0,5 т.]
A second method to measure the refractive index
In this section, you will develop an alternative method that will allow you to get very accurate results. Even though you are required to measure at the highest achievable accuracy, you are not required to perform error calculations. Nevertheless, you are required to detail the equations you use to obtain your results. Write them in the answer sheets.
A.4 Based on the behavior of the graph you got in A3, make a choice of the optimal angle to perform the measurements to find the refractive index. Write down the equation which one could use to obtain the refractive index using the developed method. [0,7 т.]
A.5 For , perform the necessary measurements to calculate the refractive index at high accuracy, using the method developed in A4
- Draw a diagram of the disk and the beam path, and indicate on the diagram the quantities you have measured.
- Document the measurements you have performed.
- Perform an analysis of the measurements and calculate the refractive index of the disk, at the highest achievable accuracy. You may use the additional supplied graph pages if needed. [0,8 т.]
A.6 Repeat the process you performed in the previous task, for and (no need to draw the system and beam path).
- Document the measurements you have performed at .
- Perform an analysis of the measurements at , and calculate the refractive index using these measurements at the highest achievable accuracy.
- Document the measurements you have performed at .
- Perform an analysis of the measurements at , and calculate the refractive index using these measurements at the highest achievable accuracy.
- From the results you obtained of the value of the refractive index using the measurements at , and , calculate the average value of the refractive index. [1,5 т.]
Отговори
A.2 1.53
From the slope of sin α versus sin β: n = 1.53 ± 0.02 (handwritten on the official graph).
A.3 α = 49° ± 0.25°, δ = 338° ± 0.5°
A.4
A.5 1.512
A.6 1.514
n = 1.511 (N = 4), n = 1.519 (N = 5); average 1.514 ± 0.004.
Решение
Optical Measurements – Solution
Part A: The refractive index of a disk
A.1: A sketch of the experimental setup for
A.1: table of measured and calculated values
| 15 | 0.25 | 174.5 | 0.25 | 349 | 0.5 | 10.25 | 0.259 | 0.178 |
| 20 | 0.25 | 173 | 0.25 | 346 | 0.5 | 13.5 | 0.342 | 0.233 |
| 25 | 0.25 | 172 | 0.25 | 344 | 0.5 | 16.5 | 0.423 | 0.284 |
| 30 | 0.25 | 171 | 0.25 | 342 | 0.5 | 19.5 | 0.500 | 0.334 |
| 35 | 0.5 | 170 | 0.25 | 340 | 0.5 | 22.5 | 0.574 | 0.383 |
| 40 | 1 | 169.5 | 0.25 | 339 | 0.5 | 25.25 | 0.643 | 0.427 |
| 45 | 1 | 169 | 0.25 | 338 | 0.5 | 28 | 0.707 | 0.469 |
| 50 | 1 | 169 | 0.25 | 338 | 0.5 | 30.5 | 0.766 | 0.508 |
| 55 | 1 | 169 | 0.25 | 338 | 0.5 | 33 | 0.819 | 0.545 |
| 60 | 1.5 | 170 | 0.25 | 340 | 0.5 | 35 | 0.866 | 0.574 |
| 65 | 1.5 | 171 | 0.5 | 342 | 1 | 37 | 0.906 | 0.602 |
| 70 | 1.5 | 173.5 | 1 | 347 | 2 | 38.25 | 0.940 | 0.619 |
| 75 | 2 | 176.5 | 1.5 | 353 | 3 | 39.25 | 0.966 | 0.633 |
A.2:
A.3:
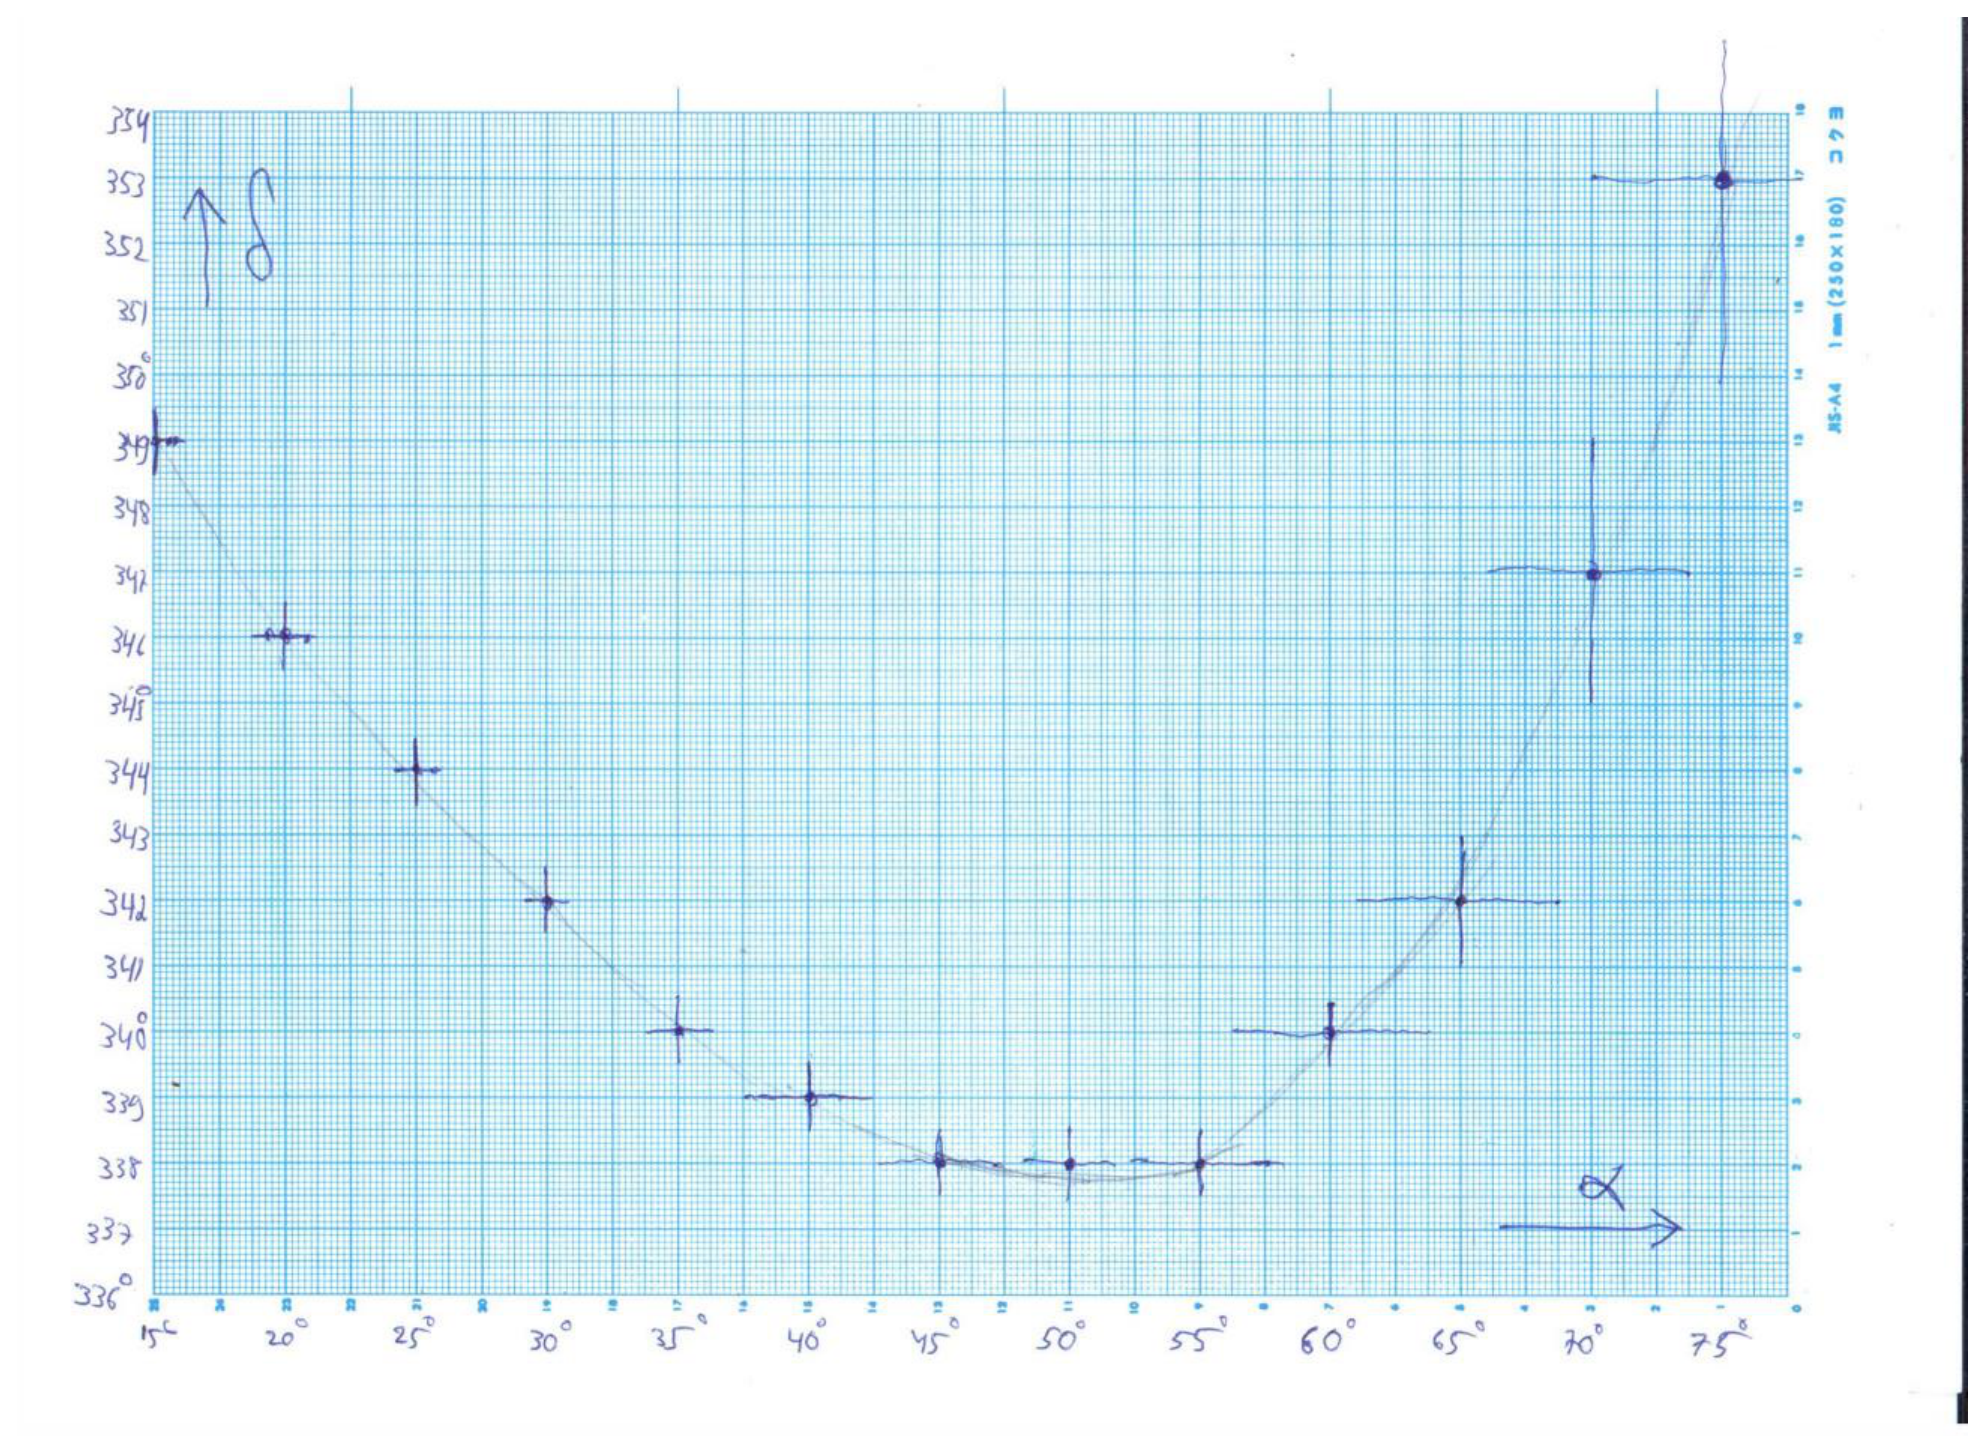
By observing the remote screen, it is possible to identify the point in which is minimal at the highest accuracy.
The values we find are
and
A.4:
When is minimal, .
Differentiating the relation by we get:
and therefore .
By differentiating Snell’s law we get
Squaring this result, as well as Snell’s law and summing the expressions we get:
Hence:
We got an explicit relation between the refraction angle and the refraction index of the material. Due to the multiple reflections inside the disk it is possible, by following all the point in which the beam hits the disk-air interface, to measure the angle at very high accuracy.
A.5: a sketch showing all the measured quantities:
Define the angle , as shown in the sketch. In fact, after two reflections inside the disk the beam exits at a point very close to the entering point. We will measure the angular location of the points where the beam hits the interface after reflection, for as many values of as we can:
| 0 | 49 |
| 1 | 168.5 |
| 2 | 288.5 |
| 3 | 409 |
Note: for the case of it is not possible to measure for as in this case, starting from the impact points co-inside with previous points.
Next we draw a graph of vs. and find the linear regression slope, :
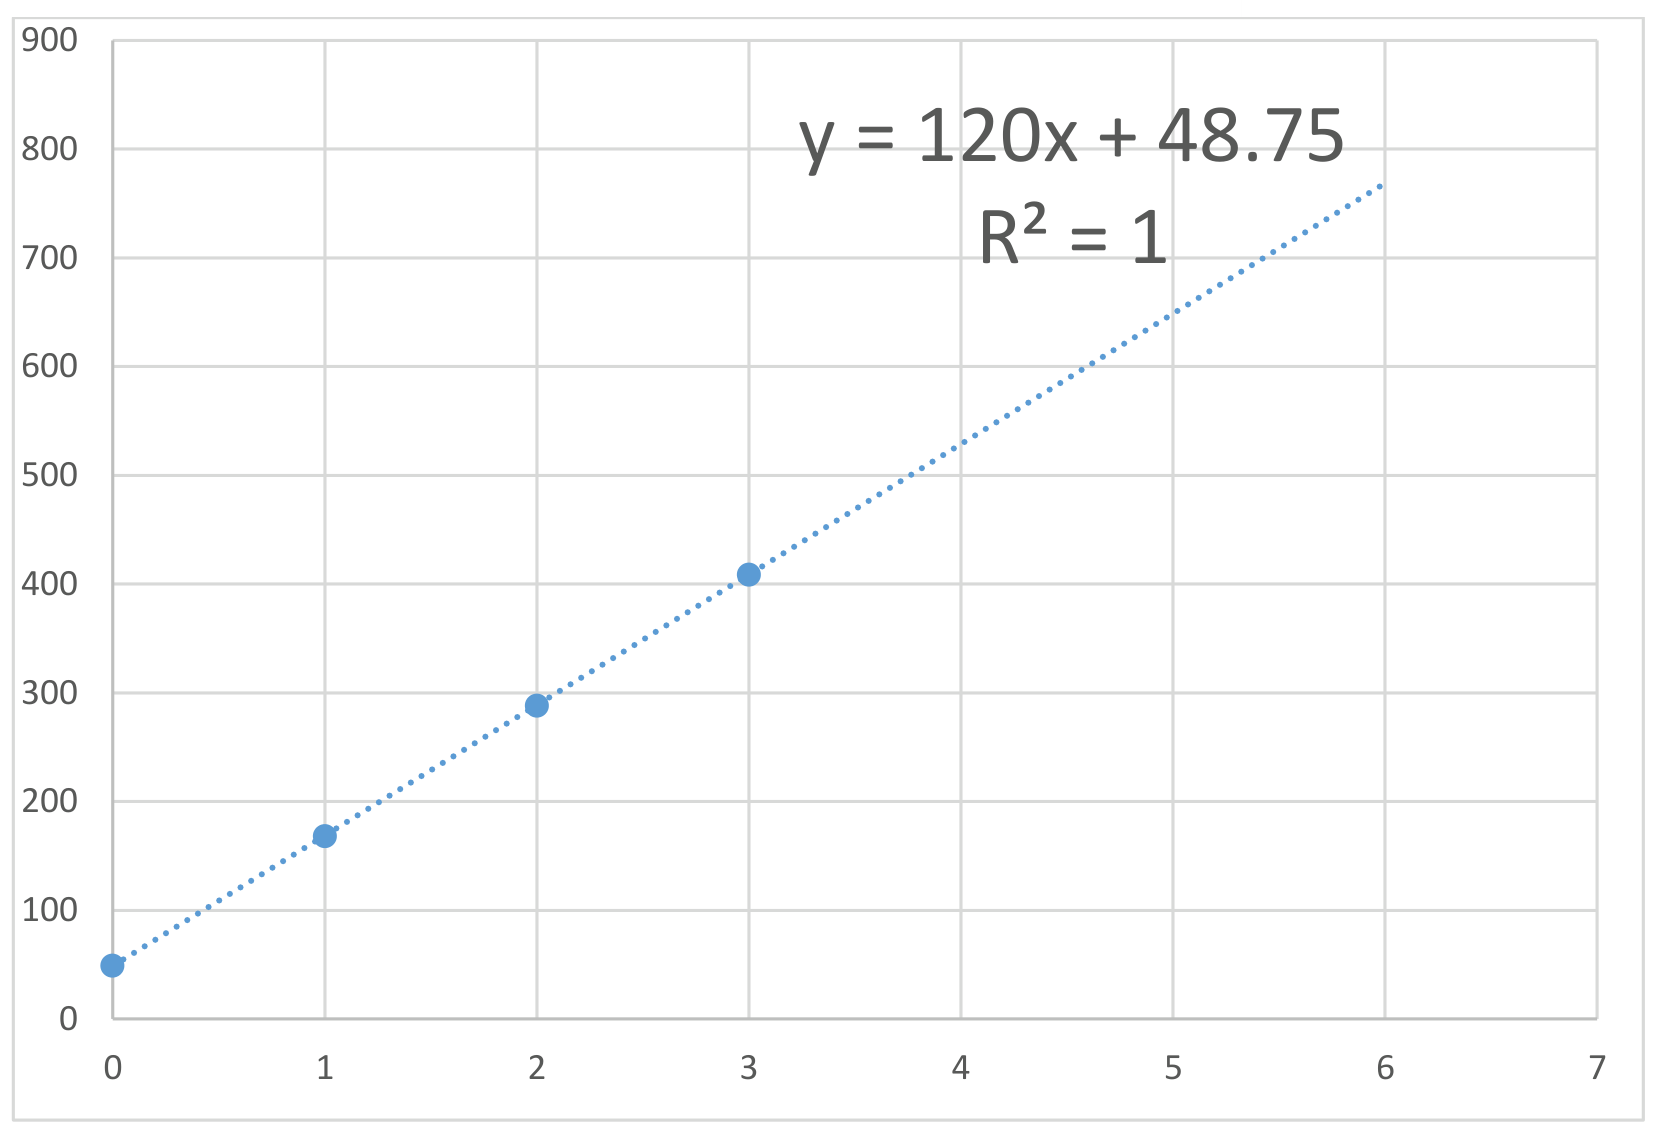
From we get , and using the equation we derived in A.4 we get:
A.6: We will identify the beam exiting the disk after 4 refractions/reflections and we will change the incident angle until we get for . We will measure as a function of the number of times the beams hits the disk-air interface, :
| 0 | 67 |
| 1 | 172 |
| 2 | 278 |
| 3 | 383 |
| 4 | 488 |
| 5 | 593 |
| 6 | 698.5 |
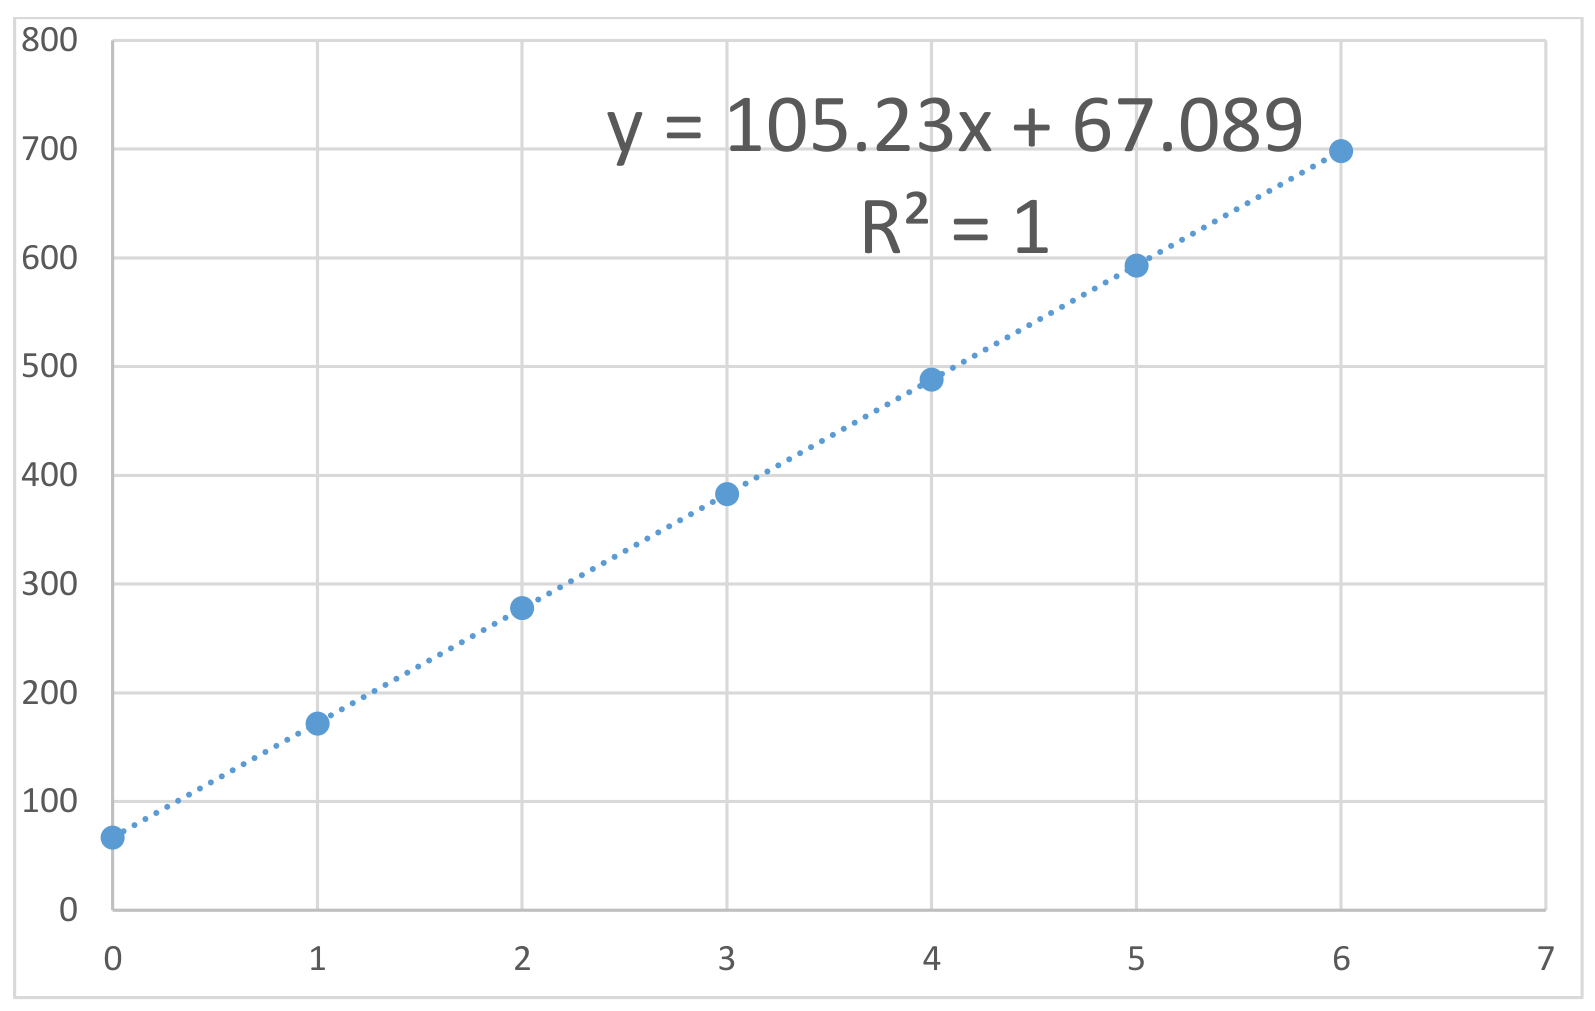
We’ll repeat this process for :
We will identify the beam exiting the disk after hitting the disk-air interface 5 times and measure as a function of the number of hits, :
| 0 | 72.5 |
| 1 | 174.5 |
| 2 | 276.5 |
| 3 | 379.5 |
| 4 | 480.5 |
| 5 | 582.5 |
| 6 | 685 |
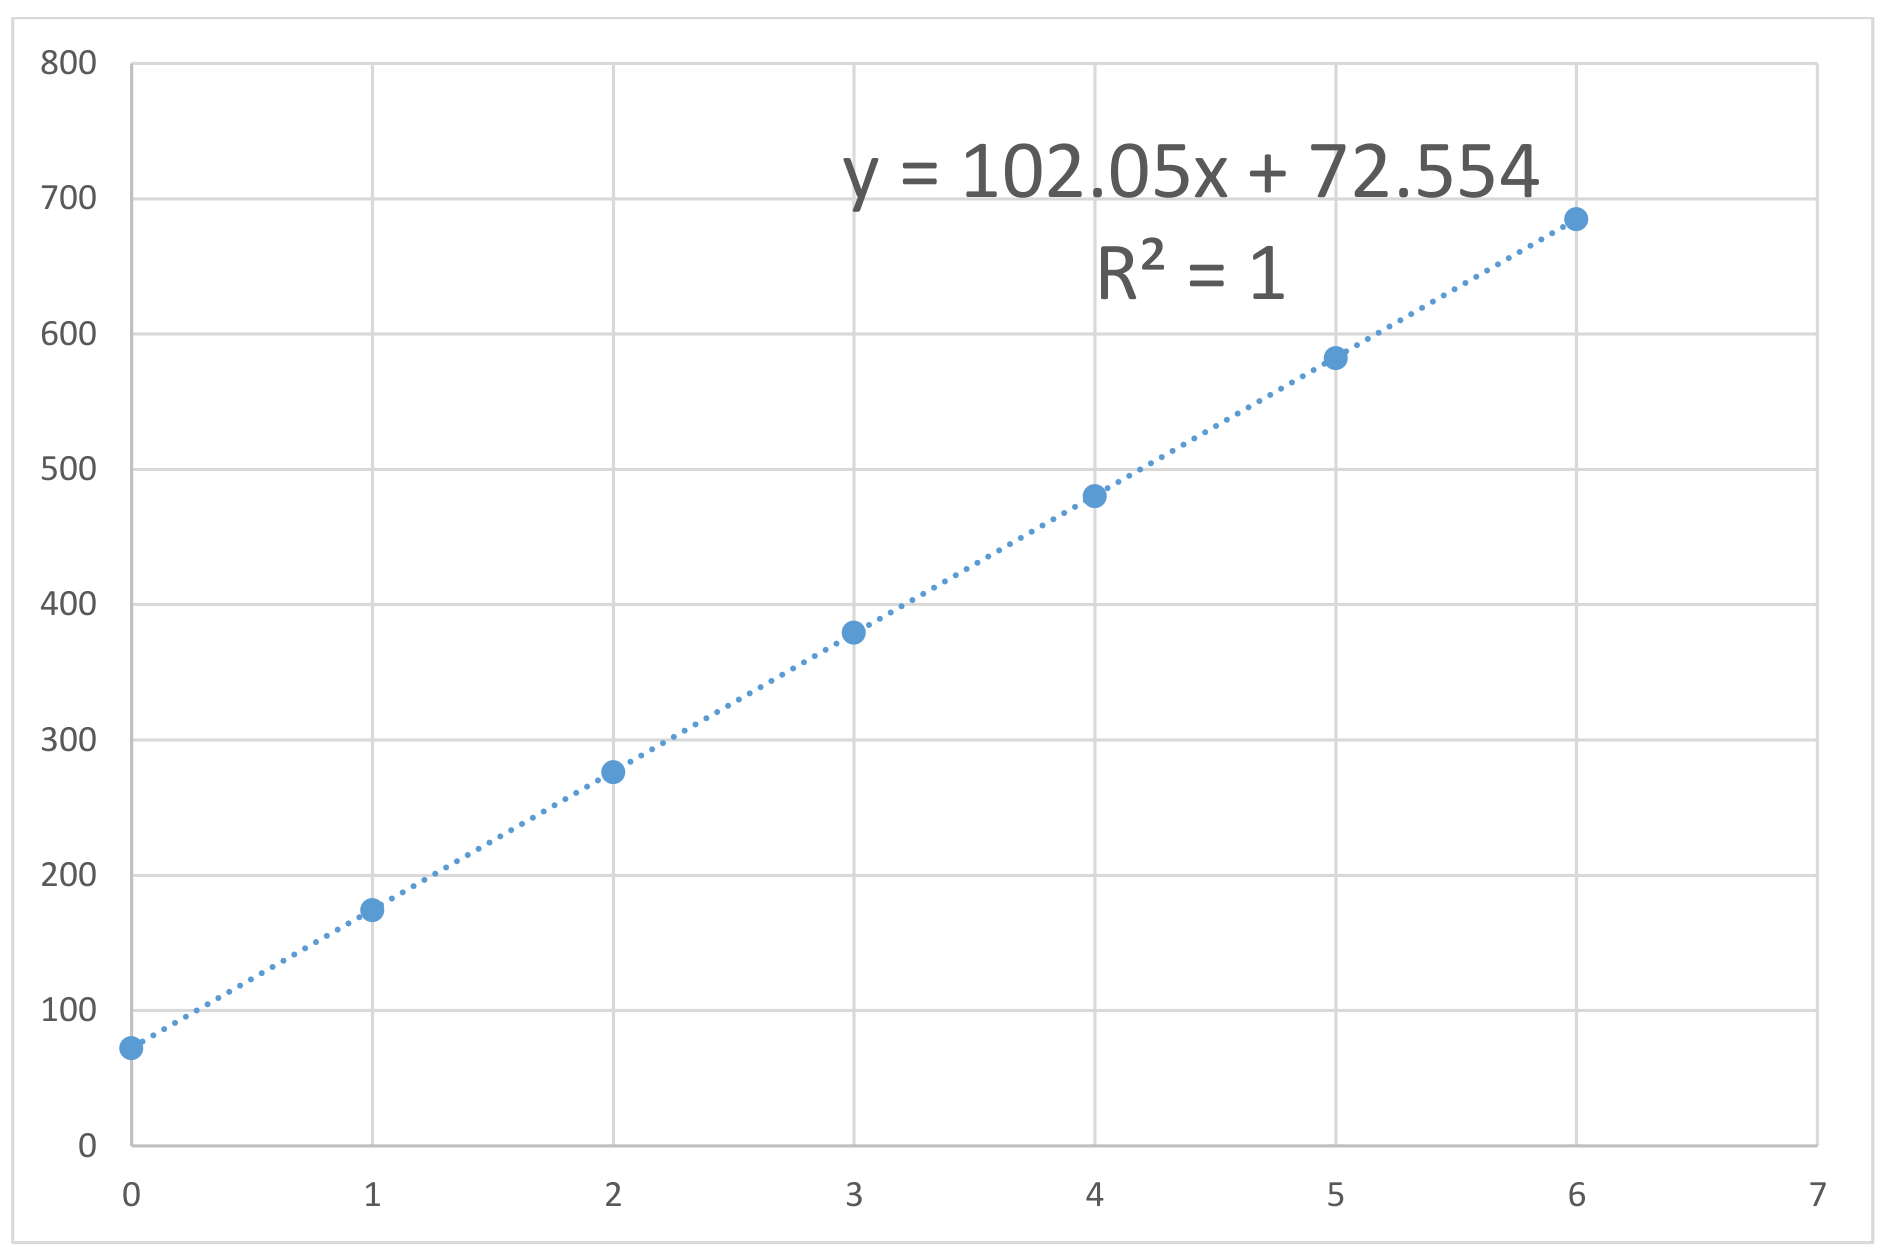
Averaging the three results we get:
Оригинал в Архива: exp1.pdf · официални решения: exp1_sol.pdf