IPhO 2021, Експеримент — Задача 2. Light Emitting Diodes (LEDs)
IPhO Lithuania 2021 — Experiment Q2 — Light Emitting Diodes (LEDs) (10 points) · 10 т.
Условие
This experiment is designed to investigate the electrical and thermal properties of LEDs. For the temperature measurements of the PCB you should use coefficients, obtained in Experiment-1 B.1 section. The electric circuit used in this experiment is shown in Fig. 2.1. For equipment guide see description for question 1.
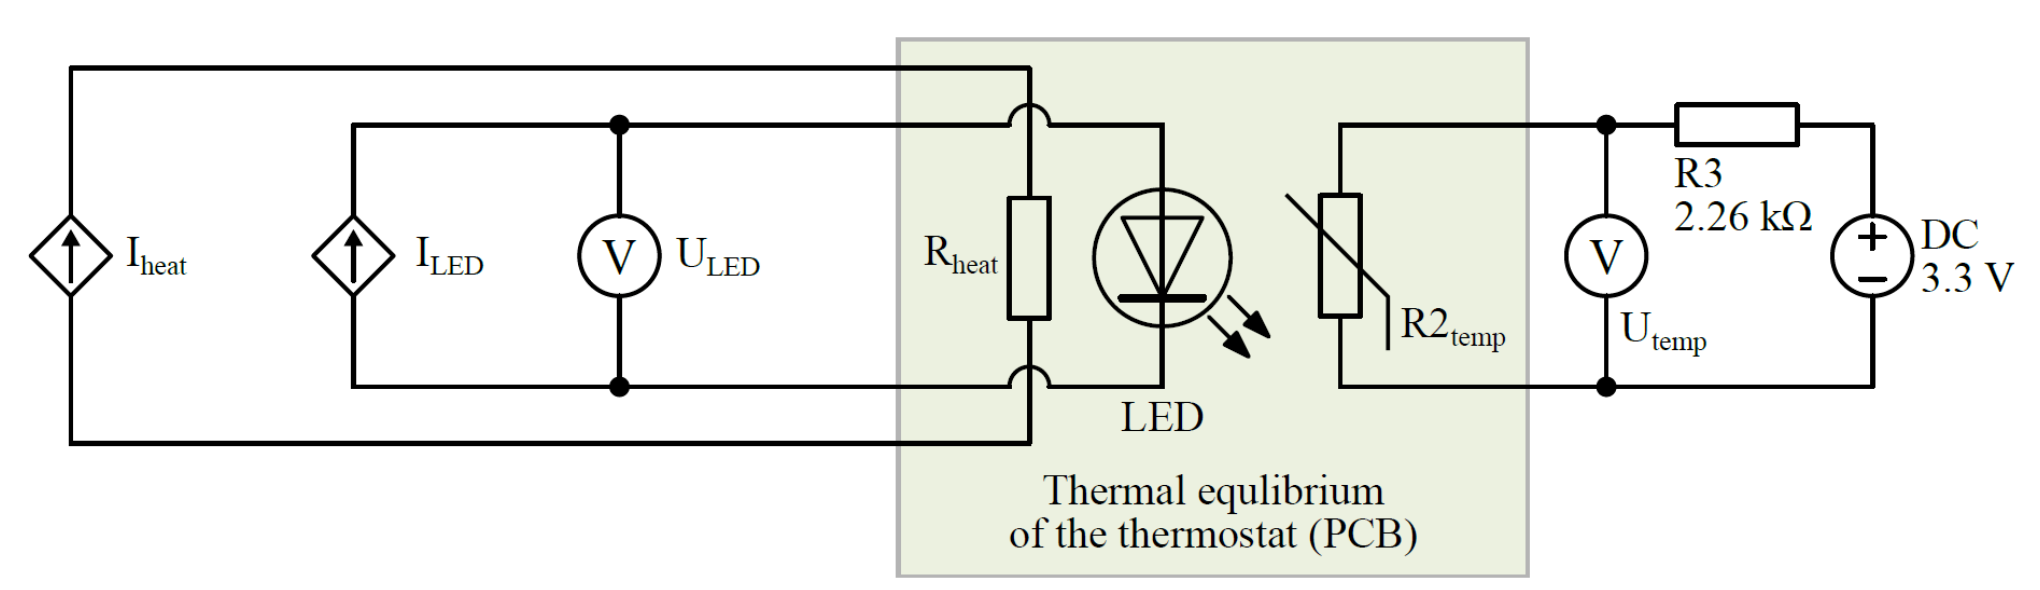
The LEDs typically are driven by the constant current in contrast to constant voltage used for incandescent lamps. The measured voltage of the LEDs depends on set current and temperature of the semiconductor die. The mathematical expression of volt-ampere characteristics is complicated and depends on physical and technological parameters, which are usually not known. Therefore, in this experiment the two-dimensional dependence of the voltage vs LED current and LED die temperature will have to be investigated:
The thermal resistance between the LED semiconductor die and the PCB is related to electrical power as follows (at several values of the current ()):
Caution: LED can be driven at continuous current or short current pulses. In the latter case it is assumed that the duration of the pulse is short enough to avoid the LED self-heating (for example 1 ms pulse duration with measurements spaced at least 100 ms apart), and to assume that at such driving regime. During the continuous operation and thermal resistance can be calculated.
Part A. Volt-ampere characteristics at different temperatures (5.0 points)
The physical mechanisms of the heating in both Experiment 1 and 2 are the same. Hence, you can use the result you obtained earlier in Experiment 1 to relate thermistor voltage with its temperature. Alternatively, you can use this explicit approximate relation:
where is temperature of the thermistor, expressed in kelvins, and is voltage on the thermistor, expressed in volts.
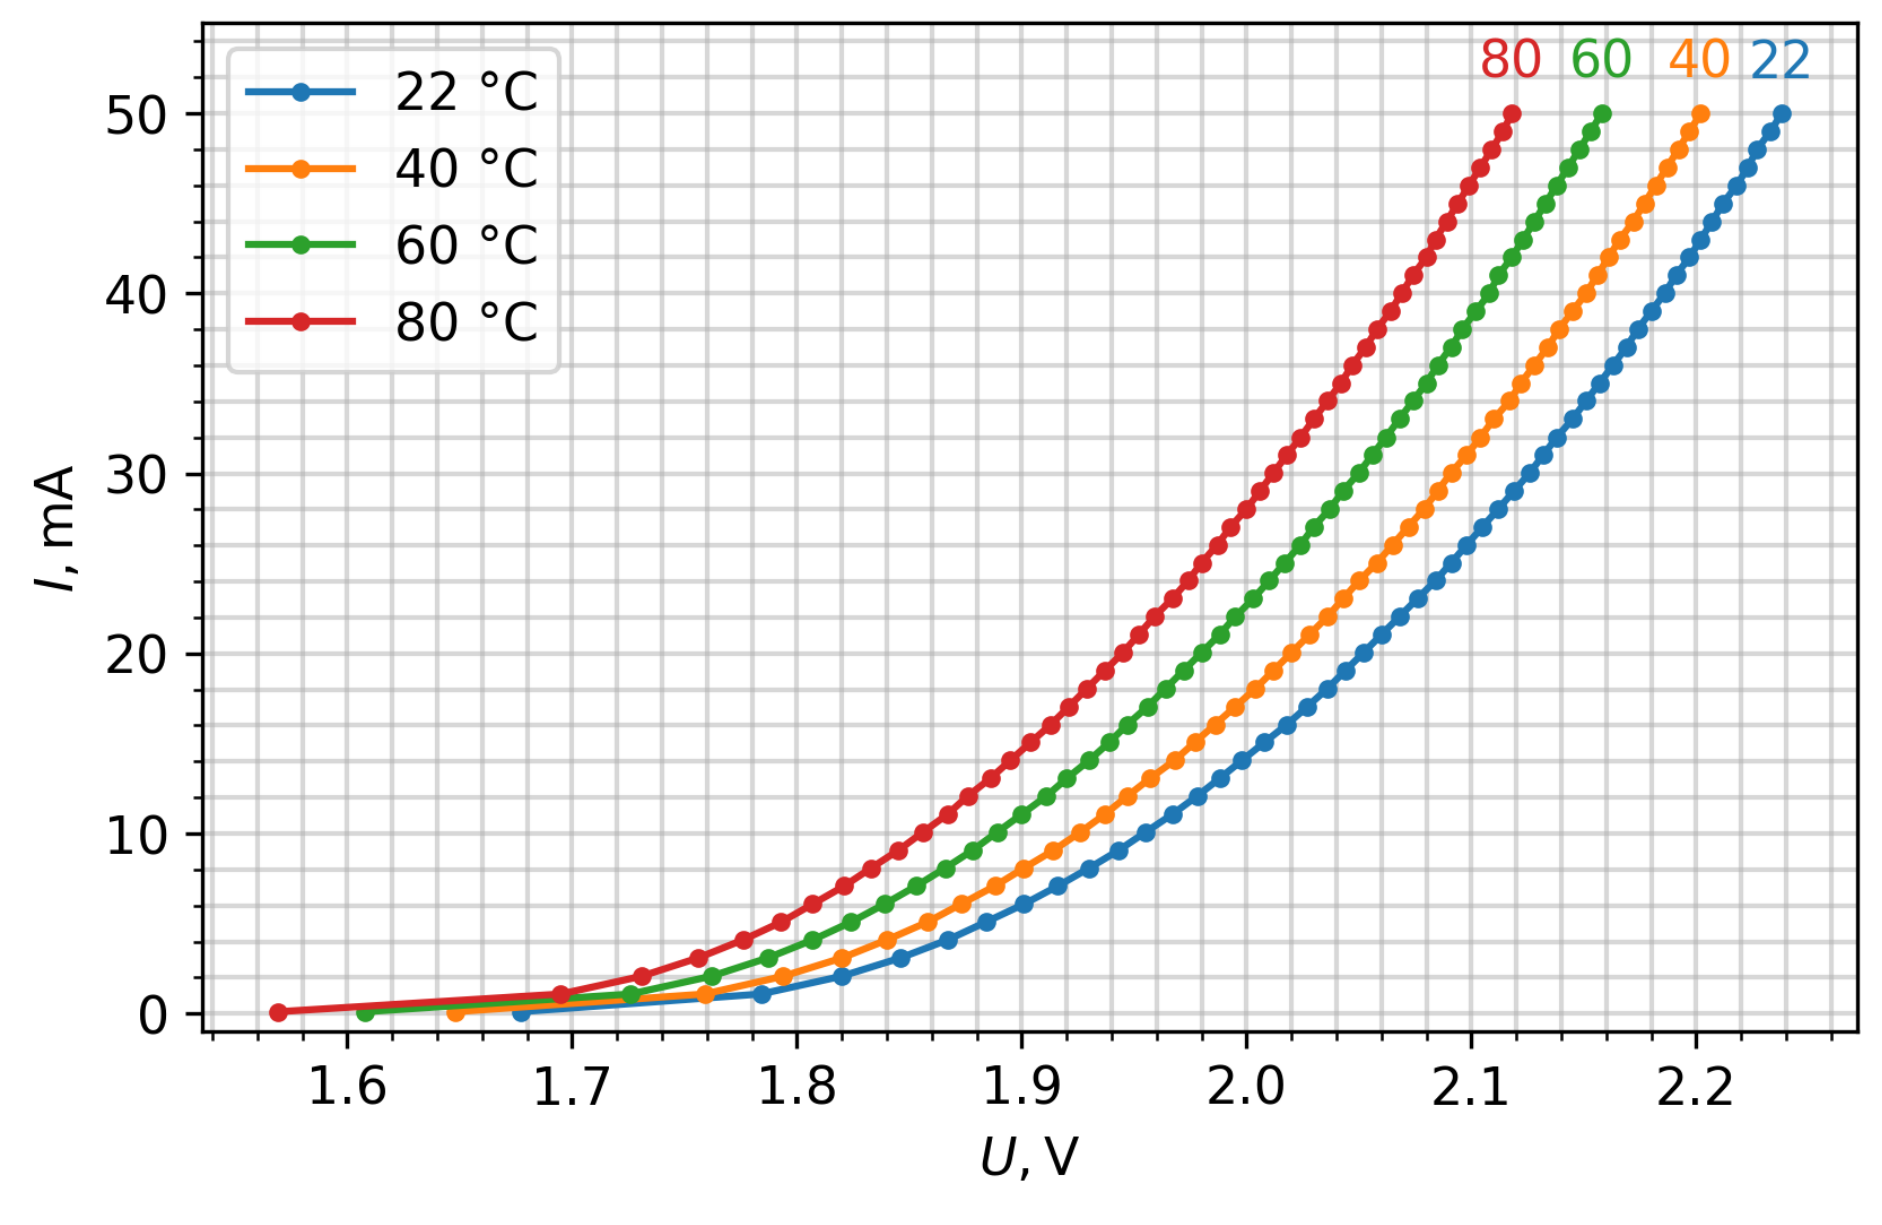
Measure and graph the Current vs Voltage of the LED at temperatures ranging from room temperature to 80 °C in pulsed mode.
A.1 Measure and graph dependence in the range from 3 mA to 50 mA at the room temperature, and 40, 60, and 80 °C. Draw all curves on the same graph. [2,5 т.]
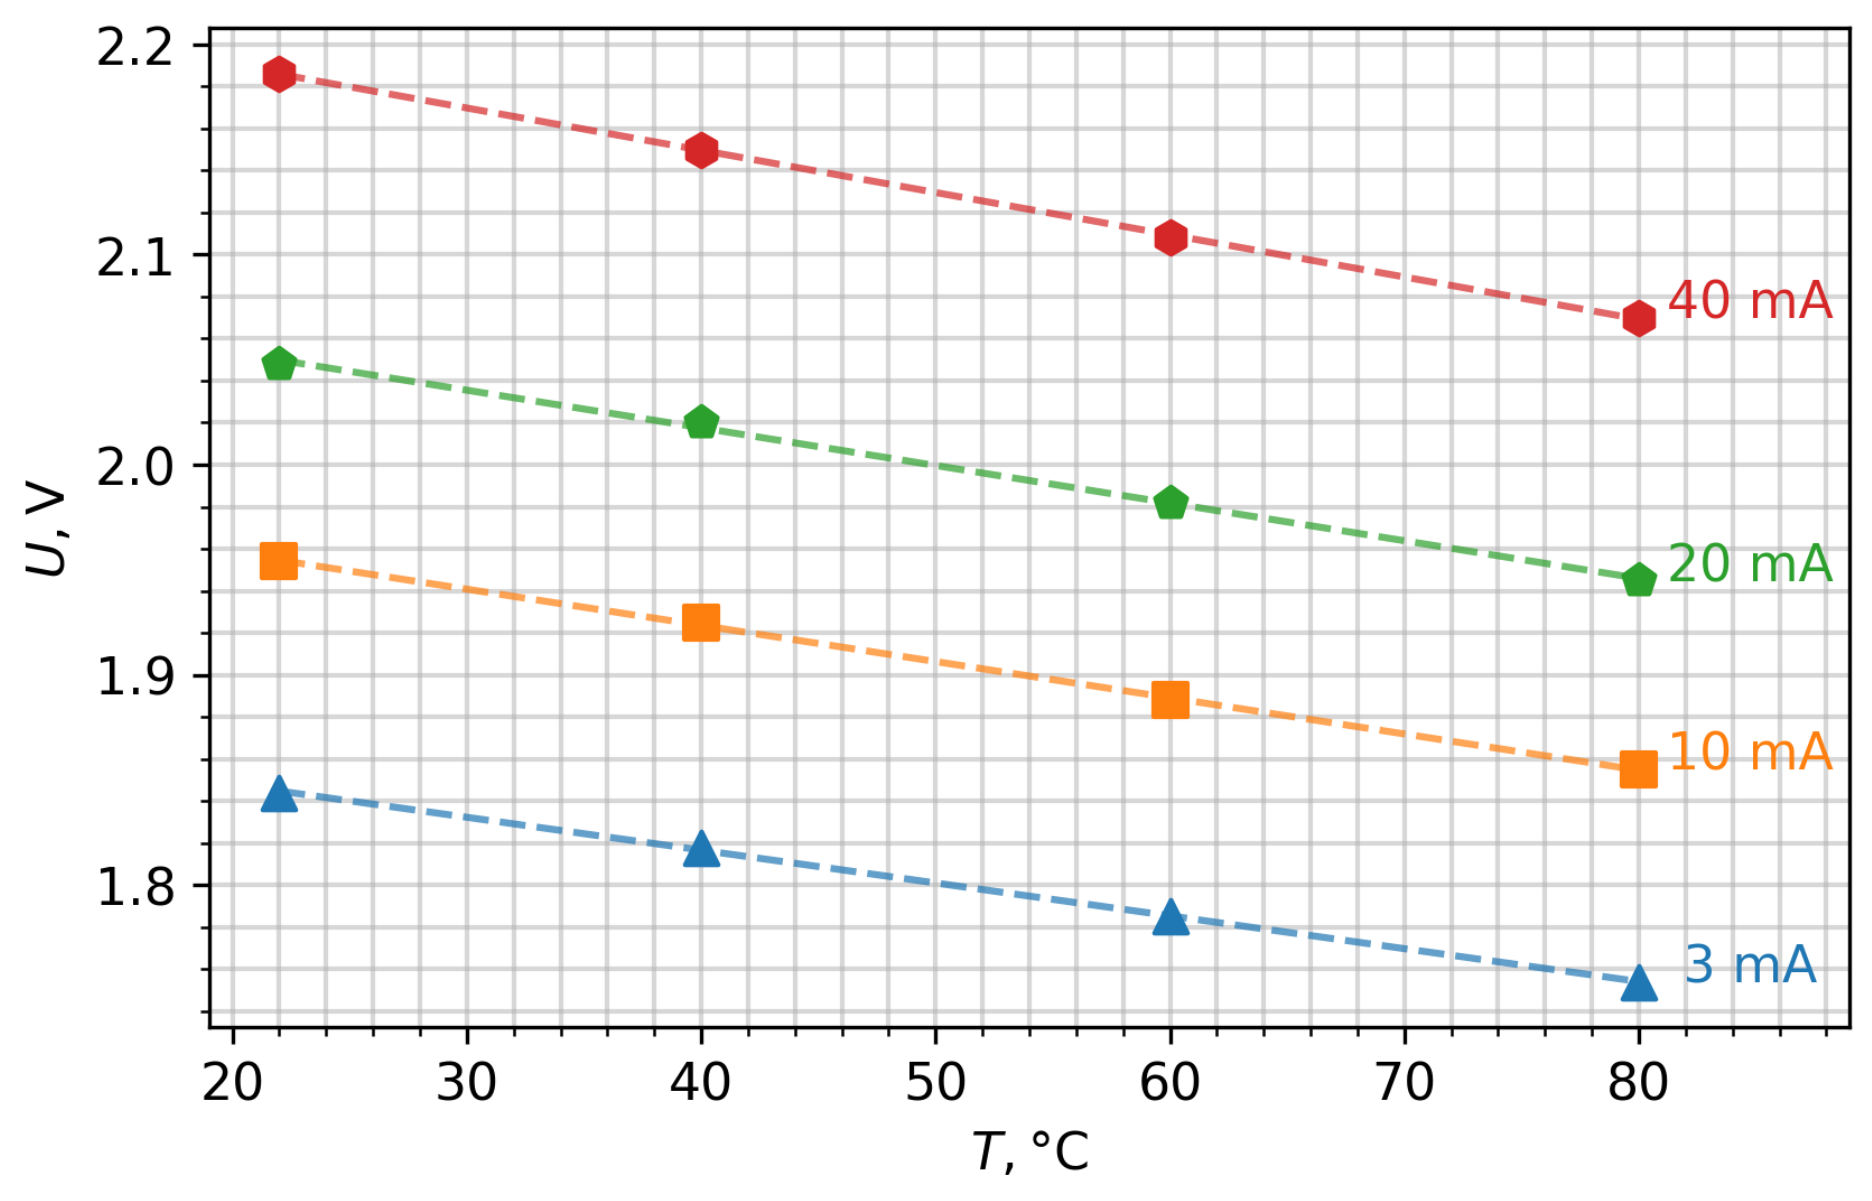
A.2 In the answer sheet, fill the table with values at 3, 10, 20, and 40 mA driving currents at room temperature, 40, 60, and 80 °C. [1 т.]
A.3 Graph main points of (those listed in question A.2) and calculate (approximate graphically) the linear voltage dependence on the temperature coefficient () at 3, 10, 20, and 40 mA. [1,5 т.]
Part B. Measurement of the LED volt-ampere characteristics at continuous driving current (3.5 points)
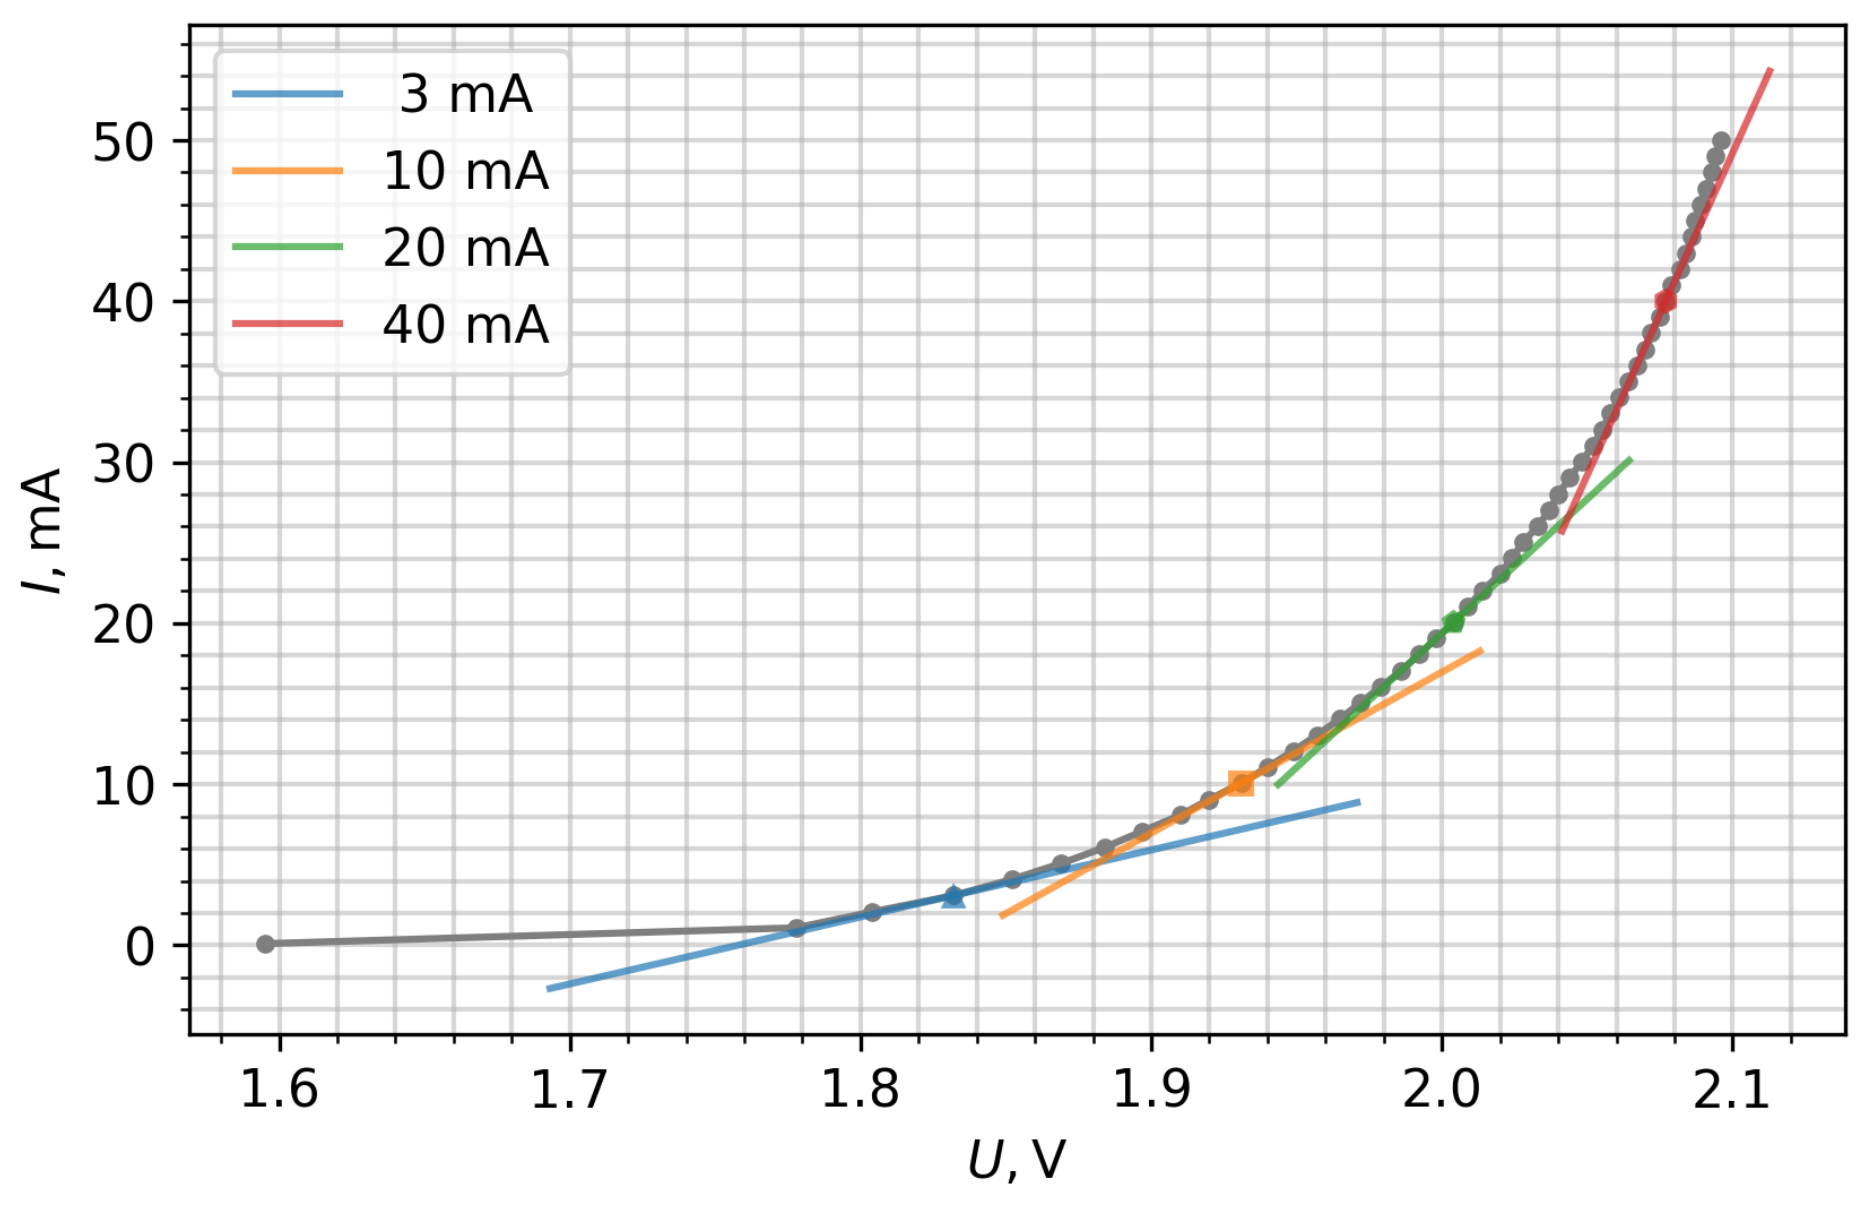
B.1 Measure and graph the dependence in the range from 3 mA to 50 mA with the heater turned off in the continuous driving regime. In the answer sheet, also write down the values of , PCB (thermostat) temperature , and the difference at 3, 10, 20, and 40 mA. [1,5 т.]
B.2 Since the resistance of the LEDs is not constant (depends on current), the term Dynamic Resistance is used and expressed as . Using graph (B.1), estimate the reciprocal of the LED dynamic resistance . In the answer sheet, write the values of at 3, 10, 20, and 40 mA. Draw tangents at these points on the graph. [0,5 т.]
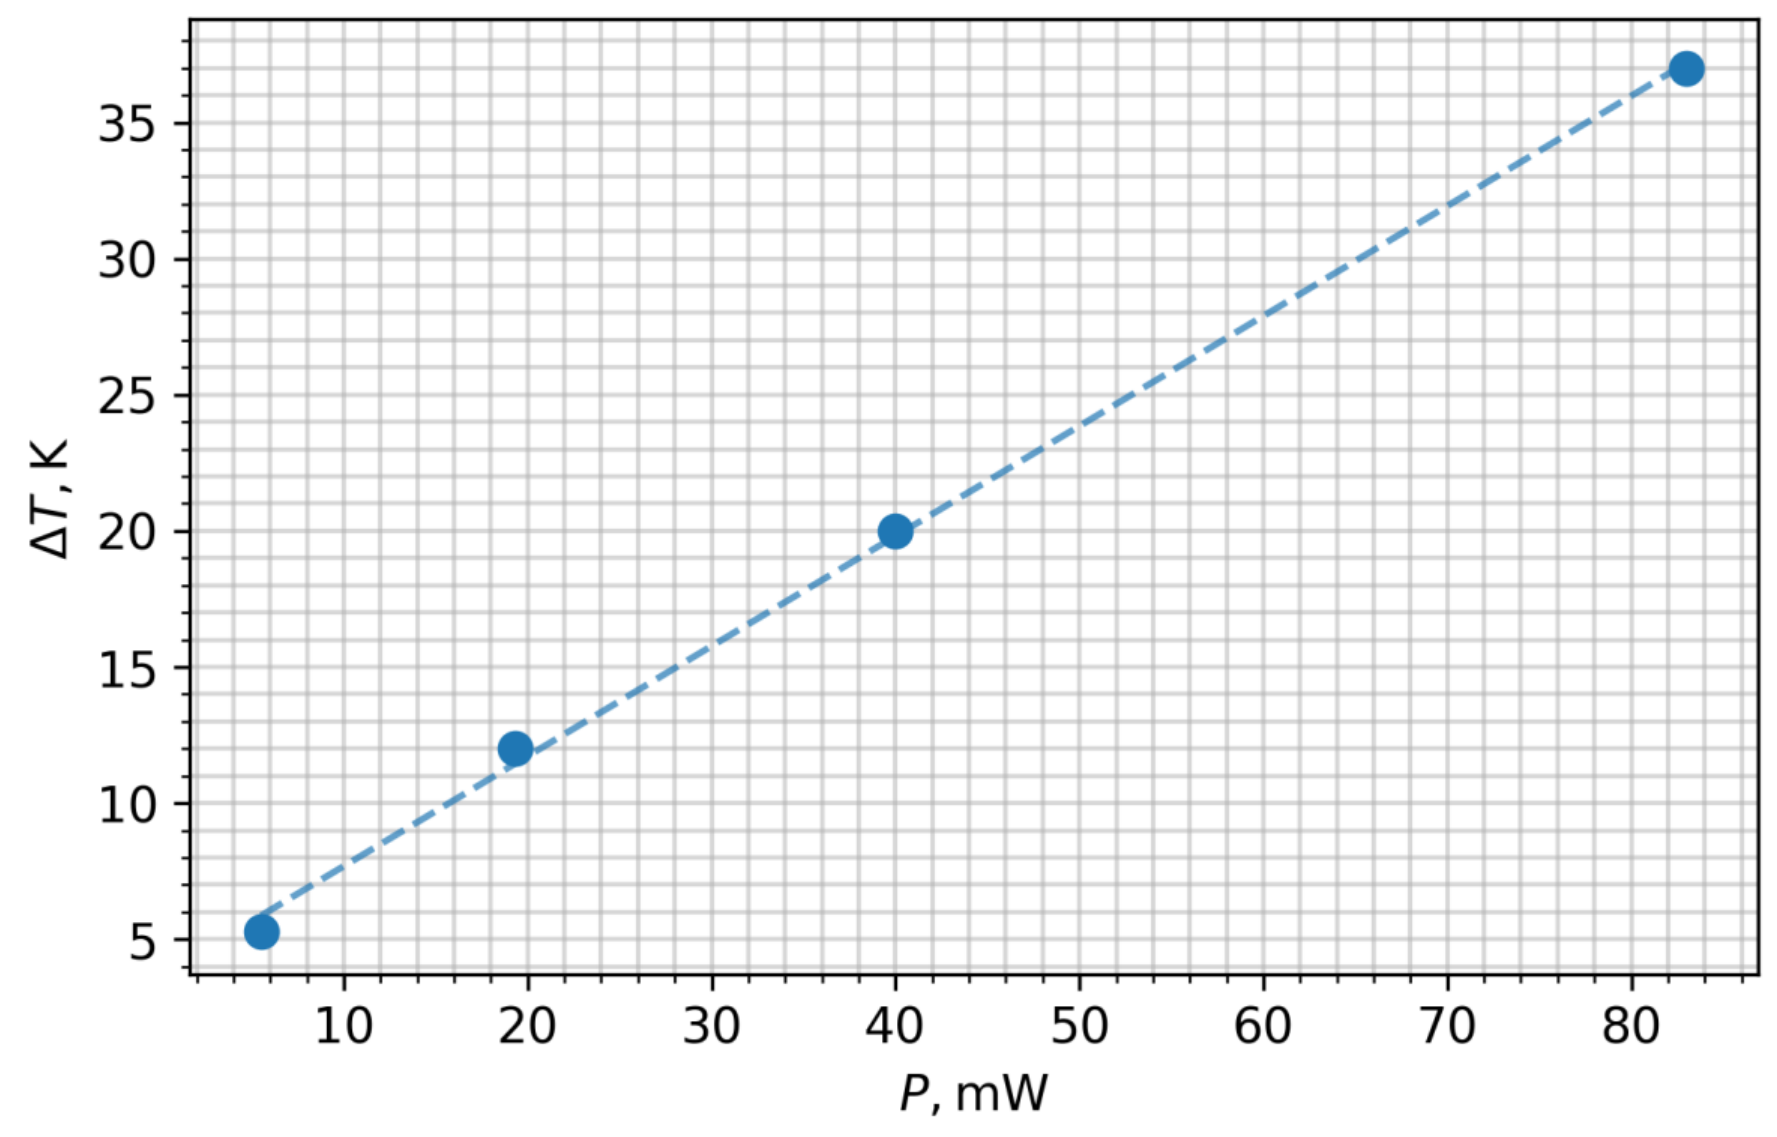
B.3 Calculate and graph the difference between the temperature of continuously operating semiconductor die () and temperature of the PCB () as a function of electrical power (at 3, 10, 20, and 40 mA). Calculate (approximate graphically) the linear LED thermal resistance , and write it in the answer sheet.
Note: Assume that all electrical energy consumed by LED is converted into the heat and the energy emitted as light can be ignored. [1,5 т.]
Part C. Calculation of the LED current drift due to the temperature (1.5 points)
In the Introduction, it was mentioned that LEDs are typically driven by the constant current, but not constant voltage. Assume that one decided to drive the LED at nominal current value of 20 mA with constant voltage value you have measured for 20 mA current in the task B.1.
C.1 Using the LED characteristics calculated in section B, estimate the actual current flowing through LED, if voltage is kept constant (voltage measured in B.1, ), but PCB temperature is at 0 °C and 40 °C. [1,5 т.]
Отговори
B.2 dI/dU ≈ 41.6 mA/V (3 mA), 100 mA/V (10 mA), 166.7 mA/V (20 mA), 400 mA/V (40 mA)
Values from the official solution; they depend on the individual LED.
B.3 400 K/W
Official solution: thermal resistance ≅ 400 K/W (measured value, depends on the LED).
C.1 ILED(U20mA, 0 °C) ≅ 10–15 mA; ILED(U20mA, 40 °C) ≅ 22 mA
Решение
Volt-Ampere characteristics of the LED have to be measured in two modes: pulsed (part A) and continuous (part B). Running LED continuously produces a noticeable amount of heat, while running it in the pulsed mode allows minimizing and neglecting self-heating effect.
Students have to be able to run the automated measurement procedure and extract the required point by visually interpolating data for required values of .
The temperature of PCB is controlled by changing the current of the heating circuit. The heating and temperature measurement parts of this Experiment are identical to the Experiment 1.
Part A: Volt-ampere characteristics at different temperatures (5.0 points)
A.1 (2.5 pt.)
Graph has to be accurate (in right range) and smooth.
A.2 (1.0 pt.)
:
| / | “Room” 22 °C | 40 °C | 60°C | 80°C |
|---|---|---|---|---|
| 3 mA | 1.844 V | 1.818 | 1.785 | 1.754 |
| 10 mA | 1.954 | 1.925 | 1.888 | 1.855 |
| 20 mA | 2.048 | 2.02 | 1.982 | 1.945 |
| 40 mA | 2.186 | 2.15 | 2.108 | 2.07 |
A.3 (1.5 pt.)
Graphed from A.2 data. should show clear linear trend and be approximated graphically. The slope should also be calculated.
| 3 mA | 10 mA | 20 mA | 40 mA | |
|---|---|---|---|---|
| -1.55 mV/K | -1.7 mV/K | -1.8 mV/K | -2.0 mV/K |
Part B: Measurement of the LED Volt-Ampere characteristics at continuous driving current (3.5 points)
B.1 (1.5 pt.)
Graph has to be accurate (in right range) and smooth.
| 3 mA | 10 mA | 20 mA | 40 mA | |
|---|---|---|---|---|
| 1.83 V | 1.93 V | 2.00 V | 2.08 V | |
| 0.014 V | 0.024 V | 0.048 V | 0.106 V | |
| ~ 32.3 °C | ~43 °C | ~49 °C | ~76.5 °C | |
| ~ 25–30 °C | ~ 30–35 °C | ~ 33–37 °C | ~ 35–40 °C |
are the most important parameters to be calculated in this section.
have to be calculated by matching the values of B section with calibration curves in A section at certain current values. This can be done by selecting the nearest points of A.3 and calculating (interpolating) the using the calculated coefficients. Graphical interpolation is also possible, but is not as accurate as the first one.
B.2 (0.5 pt.)
The dynamic resistance of the LED has to be calculated as derivative at the asked values of .
| 3 mA | 10 mA | 20 mA | 40 mA | |
|---|---|---|---|---|
| 41.6 mA/V | 100 mA/V | 166.7 mA/V | 400 mA/V |
B.3 (1.5 pt.)
Graphed .
for each has to be calculated as from the data of B.1.
Caution: during the measurement of B.1, the temperature of the PCB is not constant and rises up to ~7 °C above the “room” temperature at higher currents. This has to be taken into account when calculating .
The generated heat is taken as electrical power: . The energy emitted by the escaping light is neglected.
The graph should have a clear linear trend and approximated graphically. Thermal resistance is calculated as linear slope .
| 3 mA | 10 mA | 20 mA | 40 mA | |
|---|---|---|---|---|
| 5.0 K | 12 K | 20 K | 37 K |
Part C: Calculation of the LED current drift due to the temperature (1.5 points).
C.1 (1.5 pt)
Method 1:
The under constant is calculated (estimated):
To be accurate, we have to understand, that from B.1 involves the temperature increase of the PCB with rising current, but there is no technical capabilities to perform the measurements at constant PCB temperature. Furthermore, since the current is decreasing significantly, application of the derivatives at 20 mA is not very accurate.
Method 2:
The required values can be calculated by interpolating/extrapolating A.3 data with calculated using values from B.3. Accuracy in this way suffers a bit due to the dependence of electrical power on temperature.
, .
Оригинал в Архива: IPhO 2021 Exp Q2.pdf · официални решения: IPhO 2021 Exp S2.pdf