IPhO 2023, experiment — Задача 1. Thickness Measurements Using Birefringence (10 points)
Автор: Olympiads XYZ · транскрипция на официалните материали
Проверена срещу оригинала на 13.9.2026 от същия модел, който я е транскрибирал (без независима проверка)
Experiment — IPhO International Physics Olympiad 2023 Tokyo Japan — Q2 English (Official) · 10 юли 2023 г. · 10 т.
Внимание: Бележка към темата
Statement is truncated at the end of page 6 (setup procedure [5] continues on page 7, covered by the next window).
Условие
Uncertainty analysis is not required throughout this question.
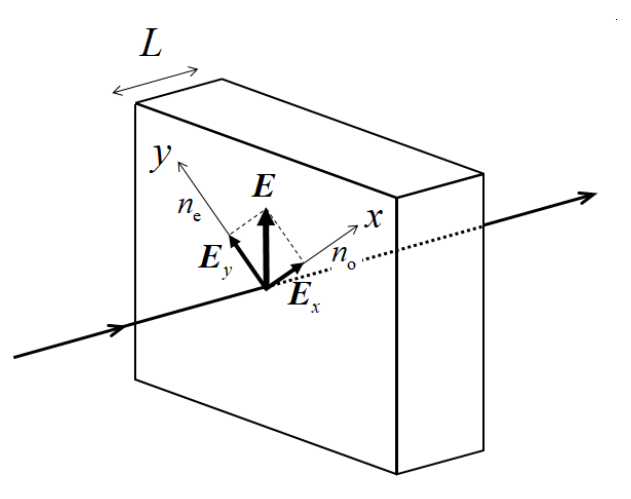
Birefringence is an optical property of a crystal that light propagates as two rays experiencing different refractive indices. When the orthogonal crystal axes and lie in the plane of the input face of a birefringent crystal (Fig. 1), the electric field of linearly polarized light at normal incidence on the crystal is decomposed into two orthogonal components and accompanied by refractive indices and , respectively. For a crystal of thickness , the phase shift of the -polarized light and that of the -polarized light as they pass through the crystal are respectively given by
where is the wavelength of light in vacuum.
The phase difference between the two rays is
where
is the birefringence. Since the electric field of light is the vectorial sum of and with a phase difference , the light after passing through the crystal has a polarization component perpendicular to the initial linear polarization of the incident light.
Let and denote the intensities of the components of the light after passing through the crystal which are parallel and perpendicular to the direction of the linear polarization of the incident light, respectively. Hereafter the direction of the linear polarization of the incident light ( in Fig. 1) is with respect to the axis. Then the normalized intensity of the perpendicular component is given by
where is the total transmitted light intensity, .
We can design an experiment such that oscillates between 0 and 1 as we vary the wavelength of the incident light. Let () be the wavelengths at which ; then we find the phase difference such that
This equation allows us to determine the crystal thickness if multiple 's can be measured for the known .
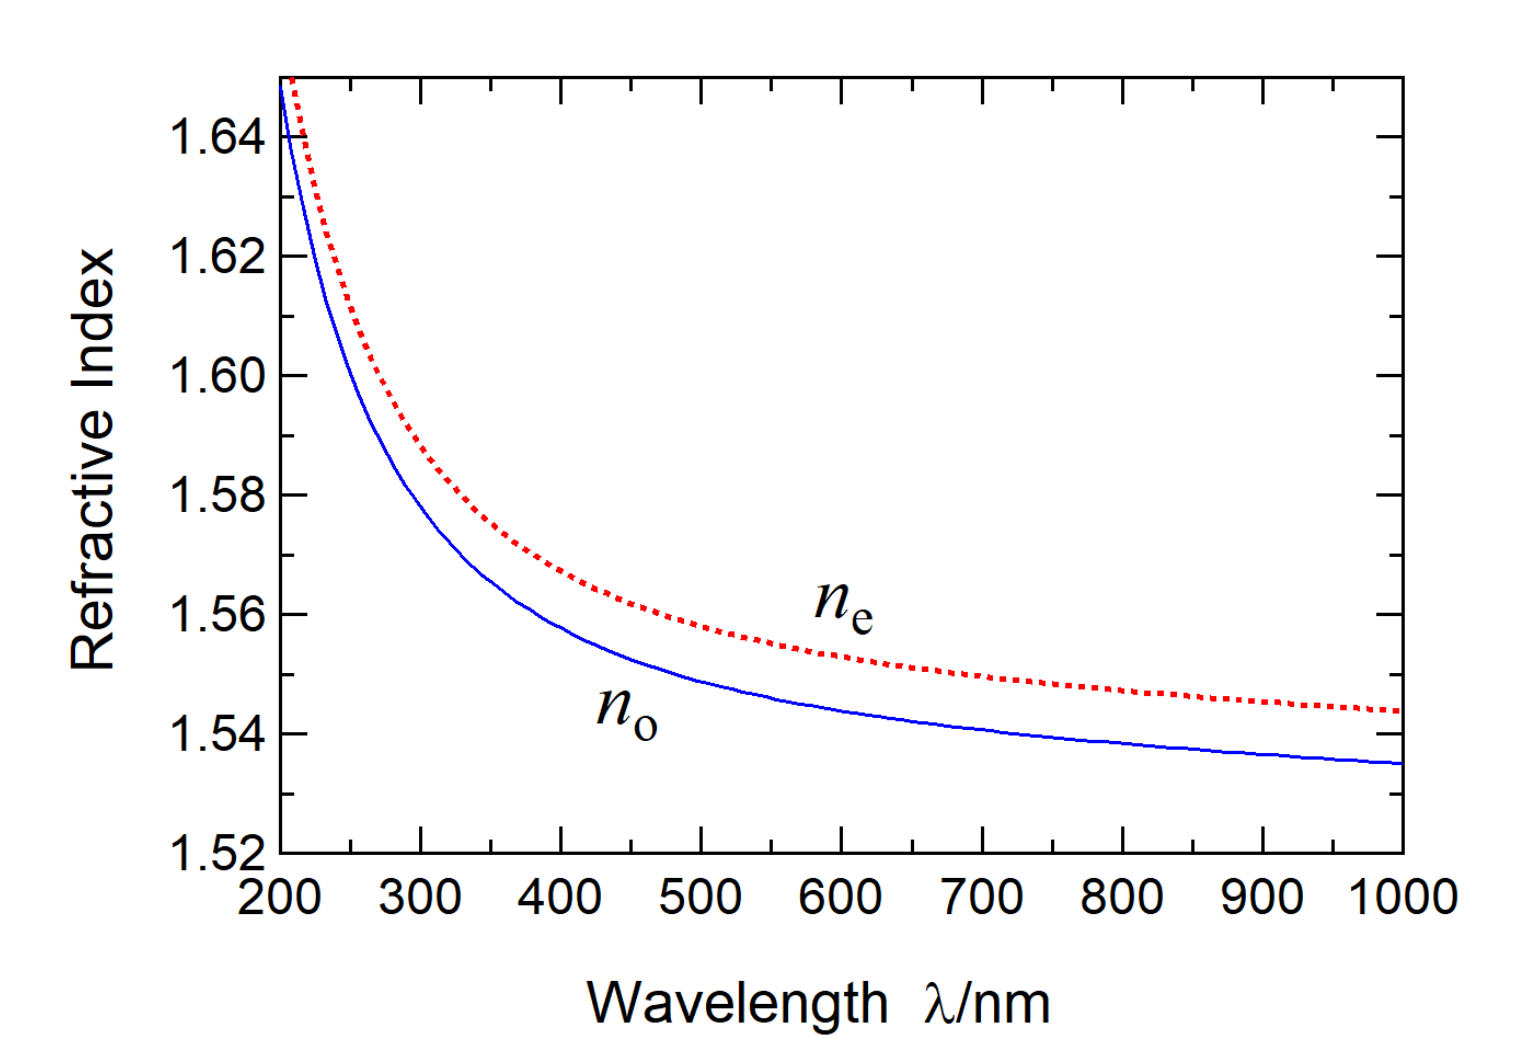
In this experiment, you will determine the thickness of the quartz plate. Quartz is birefringent with its refractive indices and depending on the wavelength of light in vacuum as shown in Fig. 2.
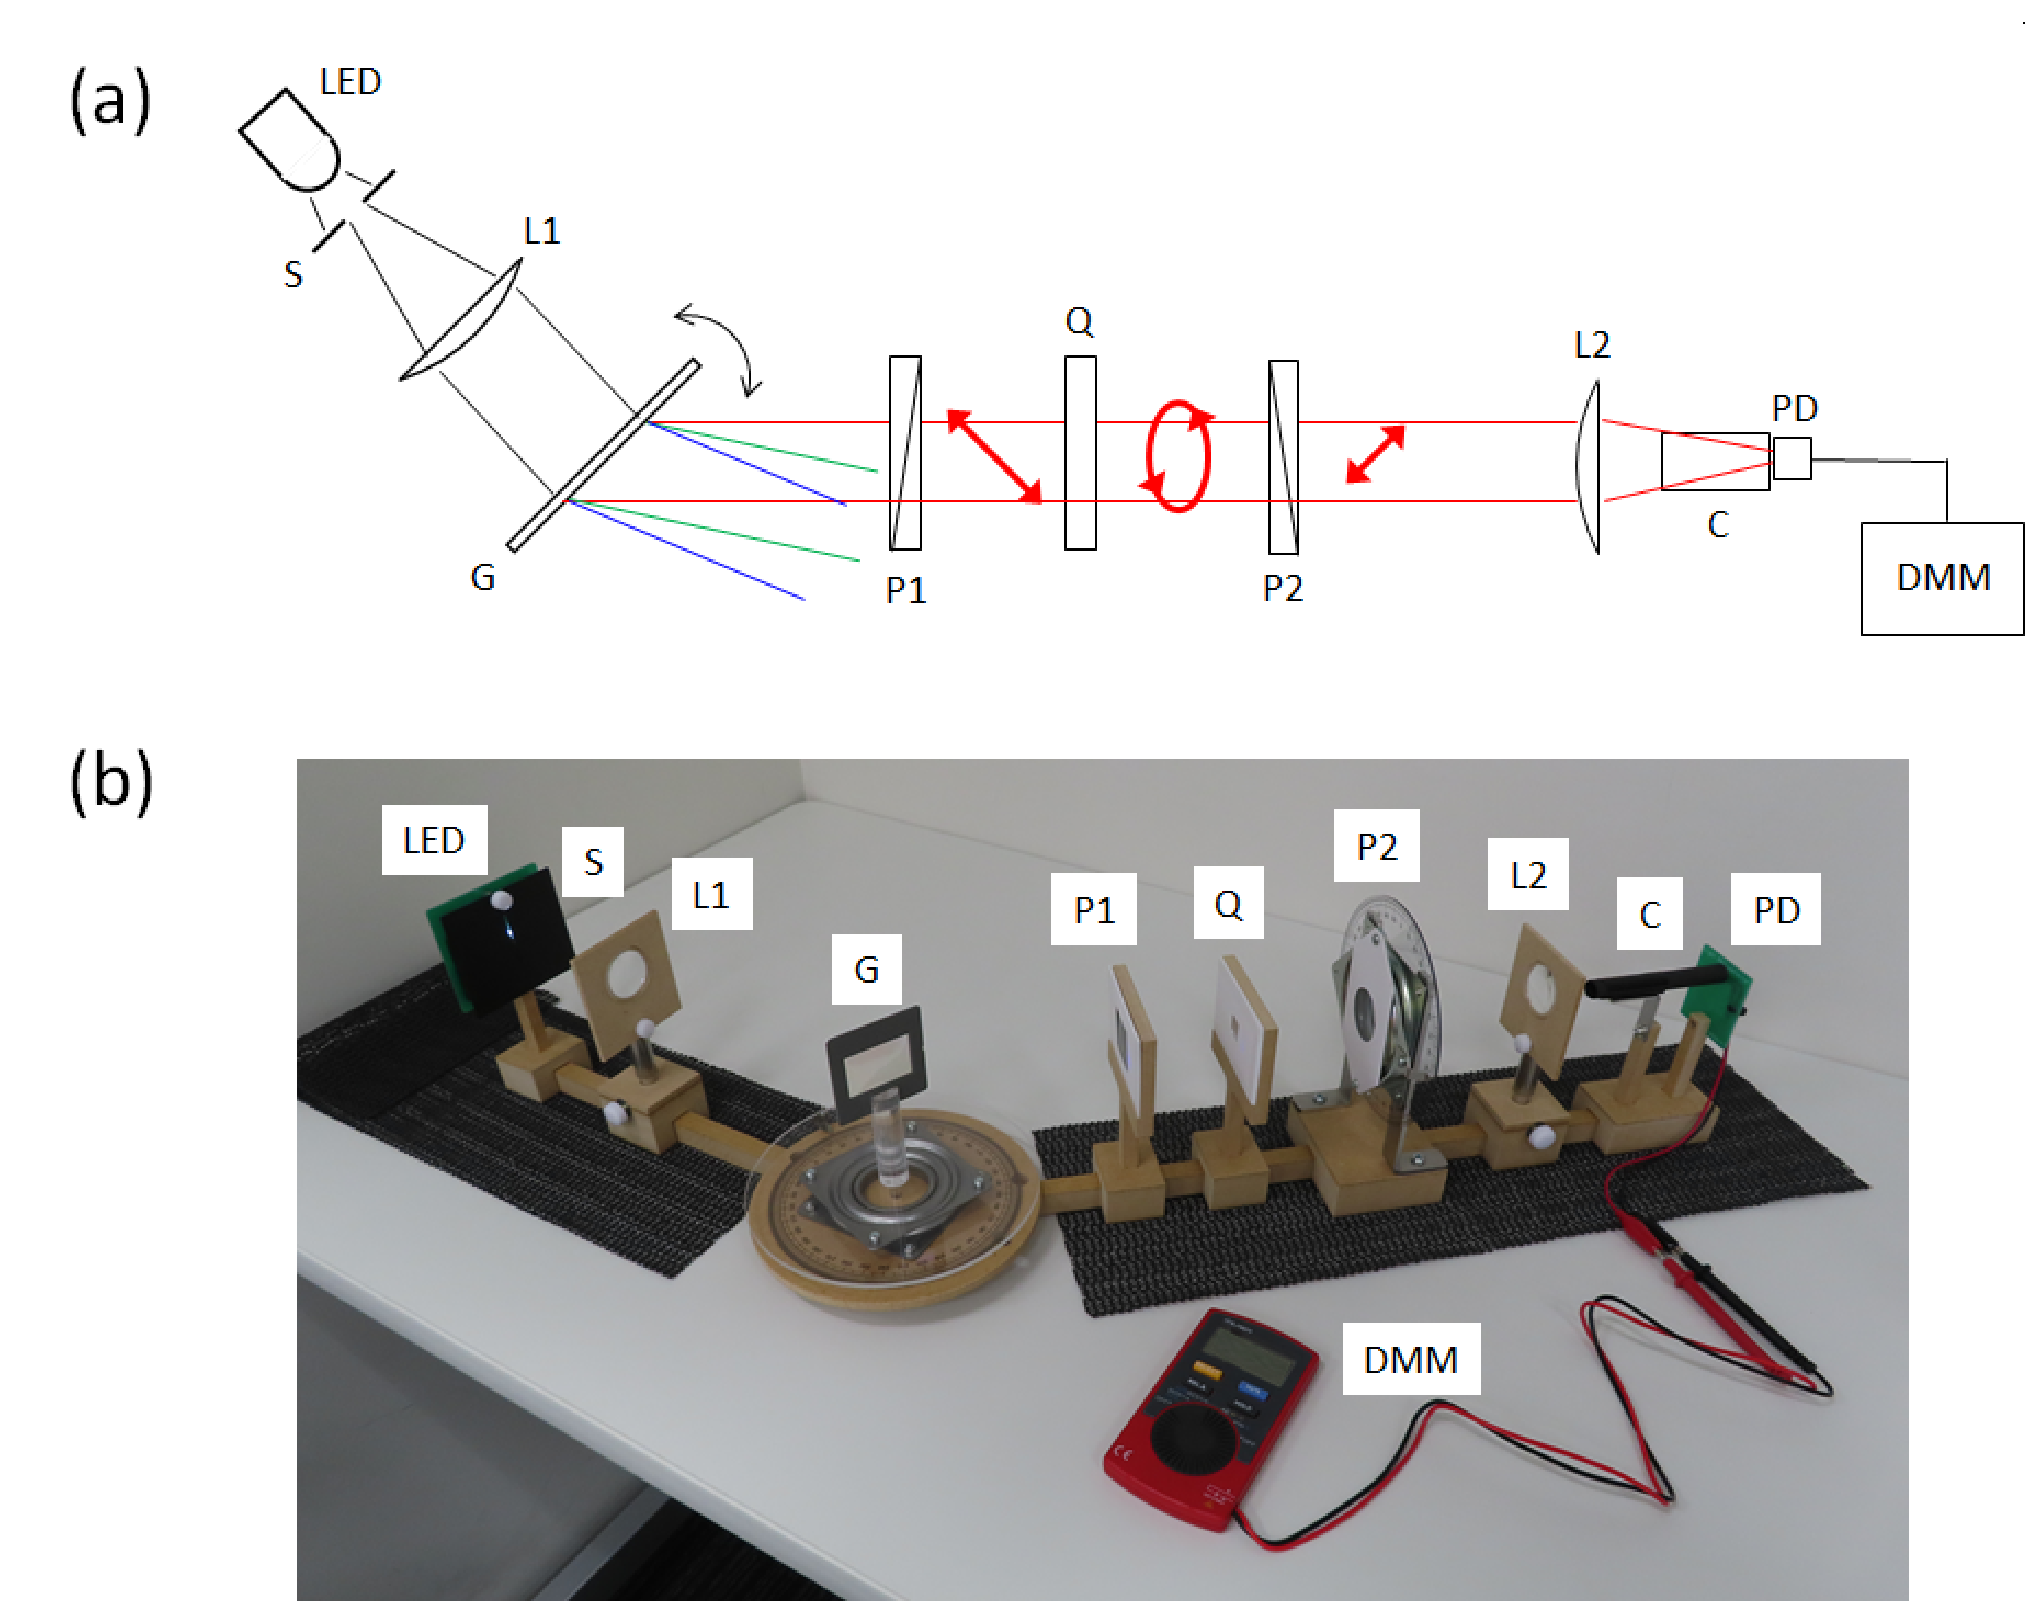
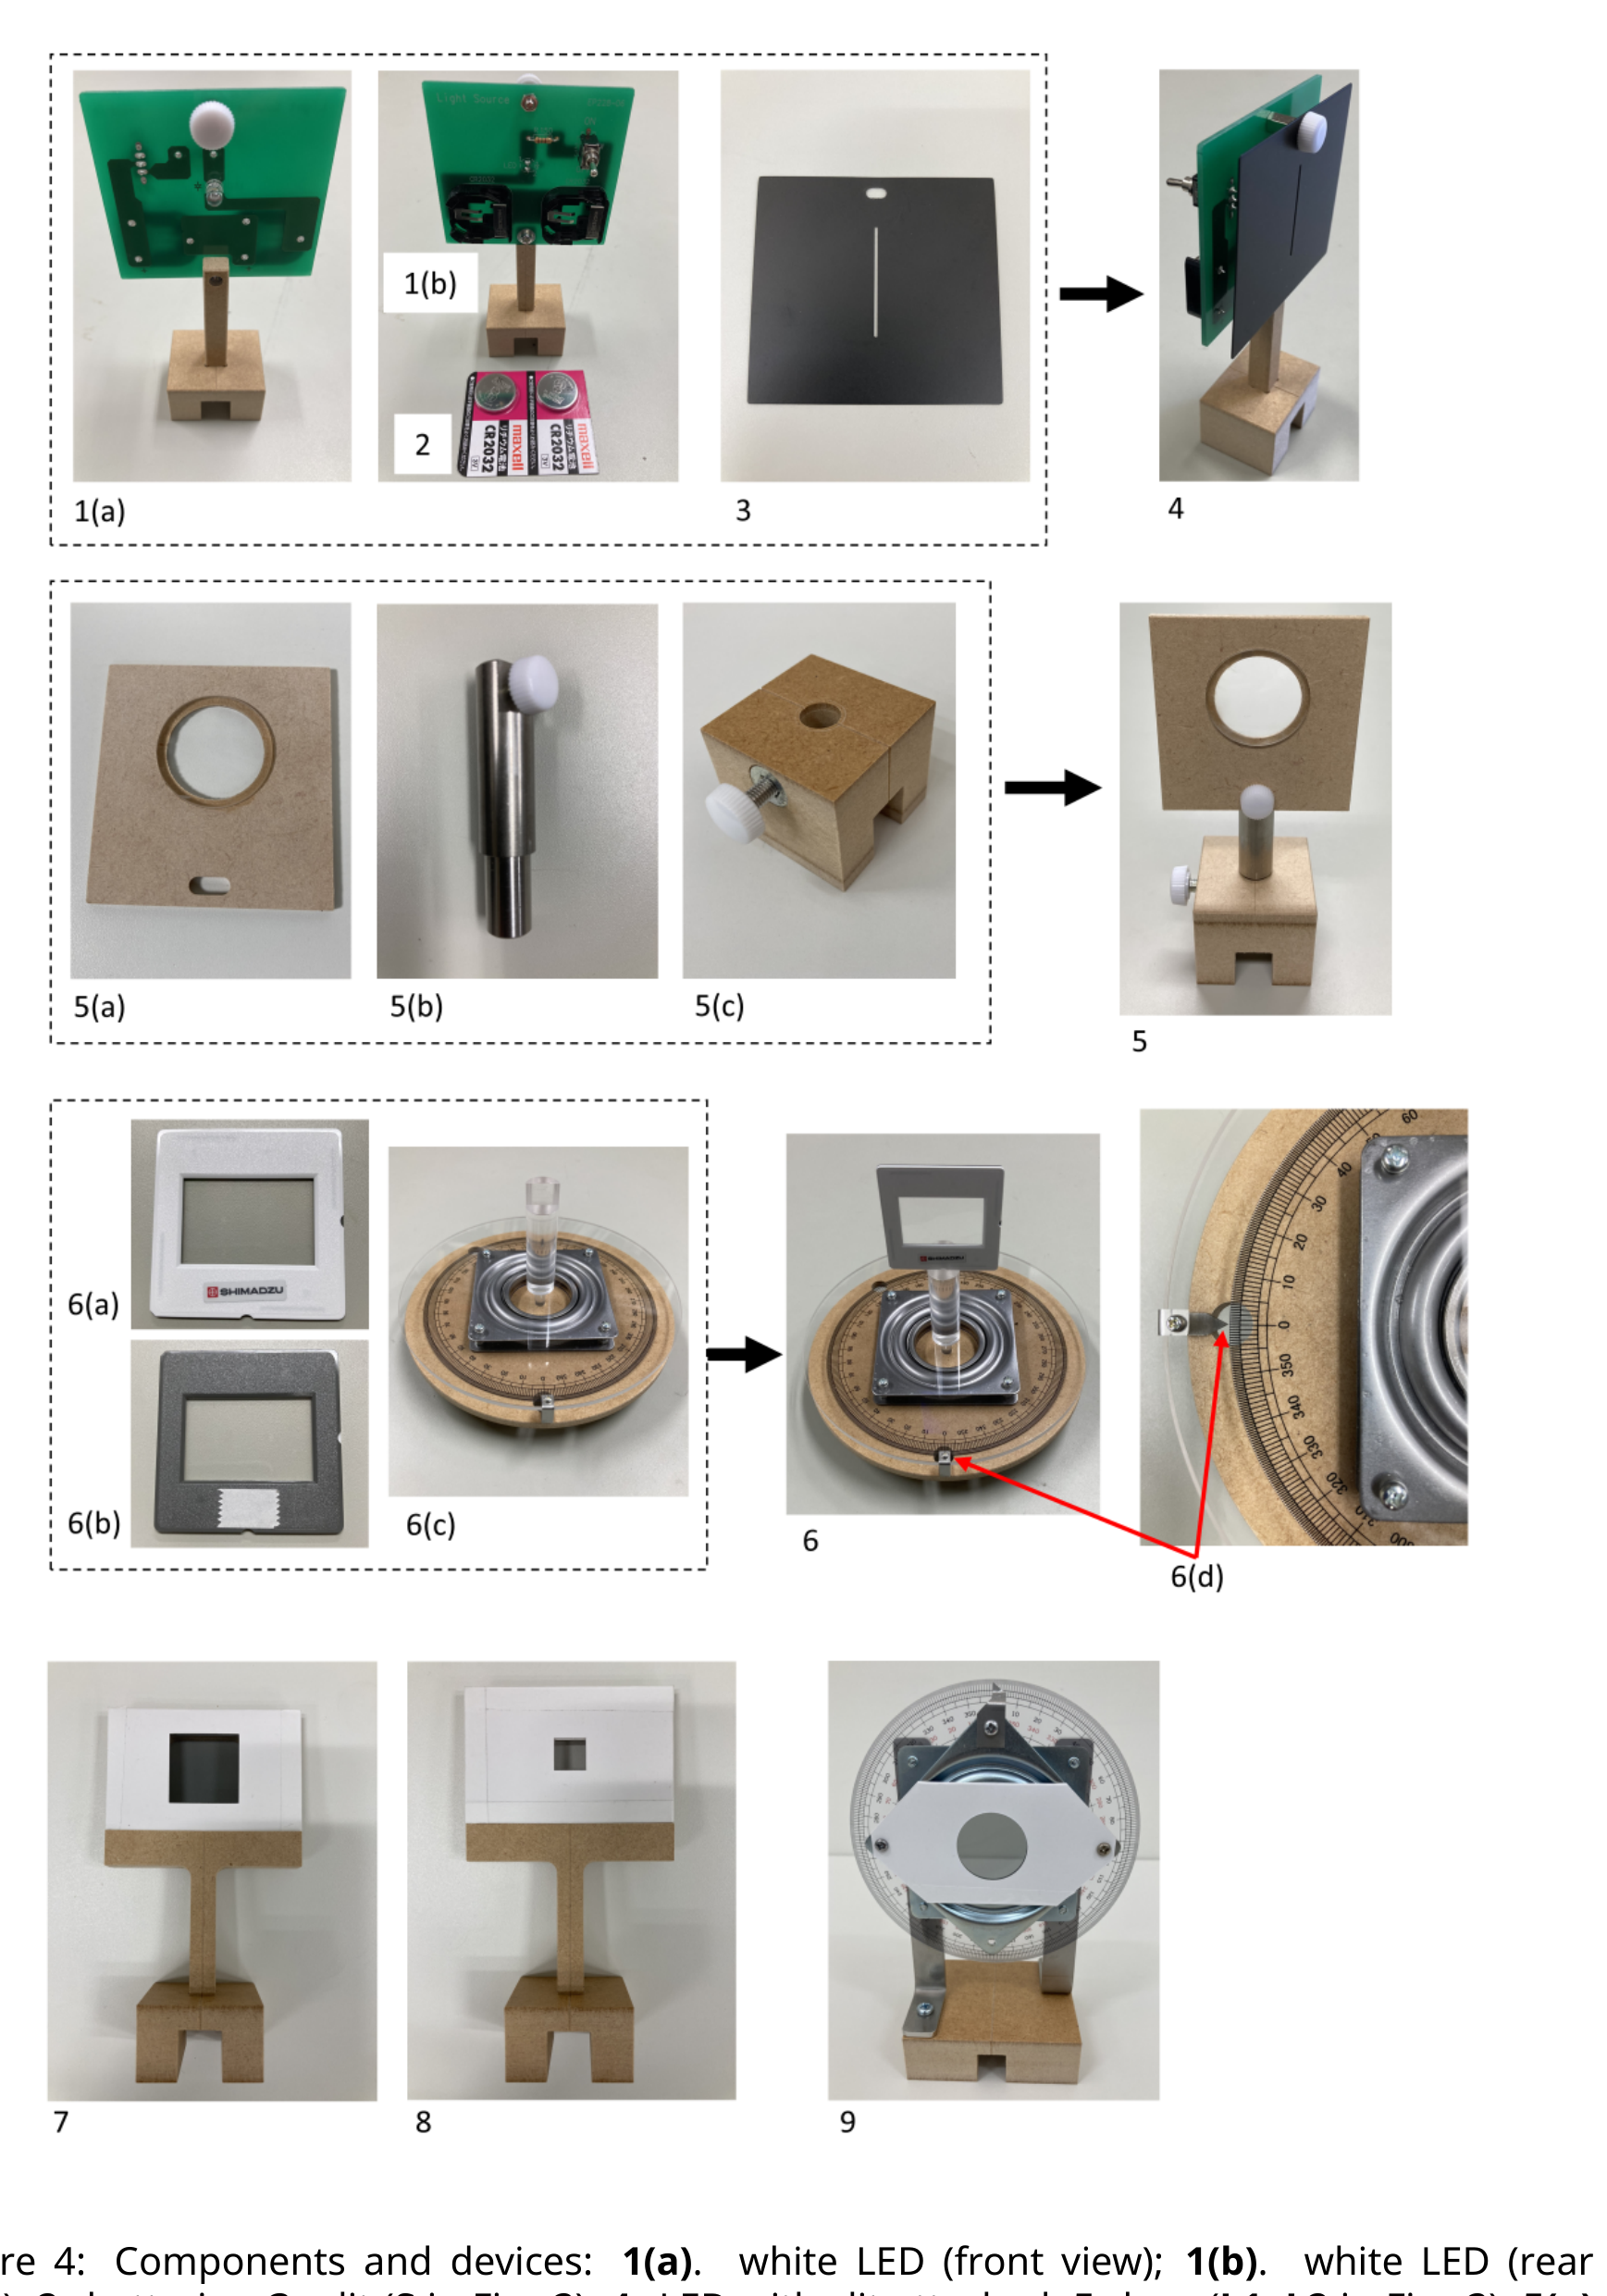
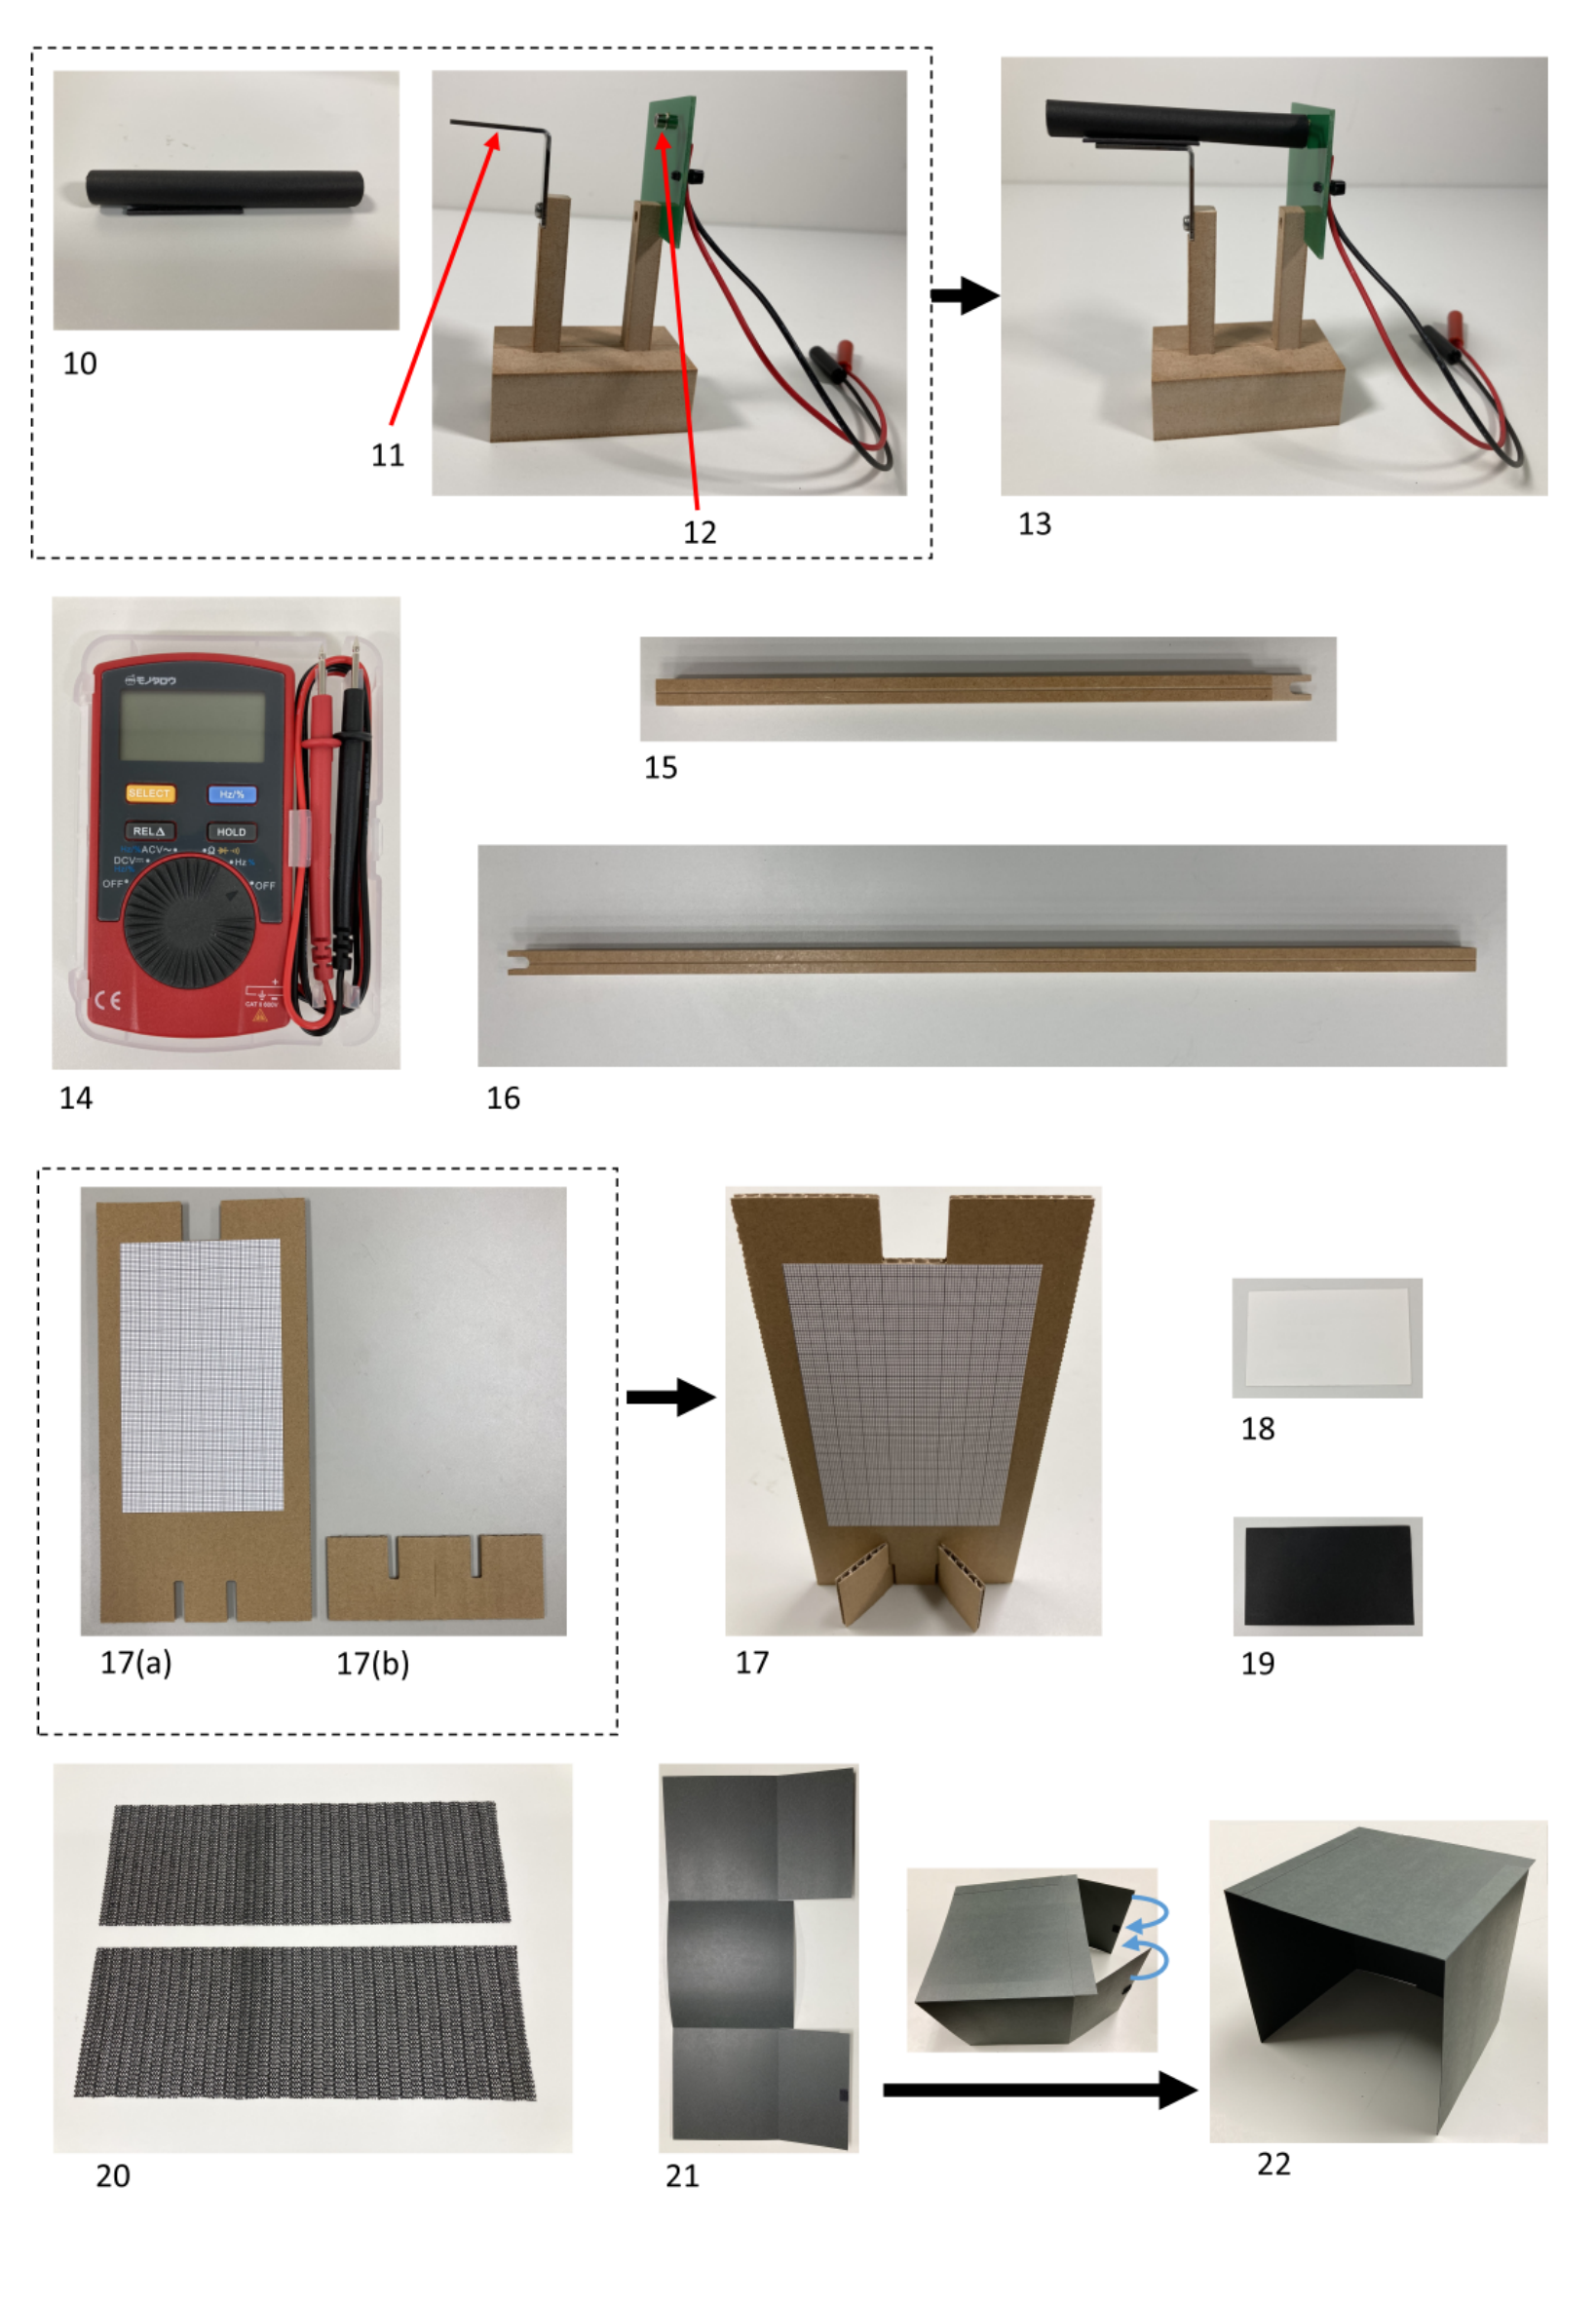
Figure 3 shows the thickness-measurement system. Shown in Figs. 4 and 5 are the optomechanical and photonic components and devices. A white light-emitting diode (LED) is used as the light source, which contains a blue LED and a phosphor. When light from the blue LED is irradiated onto the phosphor, white light is emitted with a continuous spectrum. Light from this white LED is dispersed, i.e., spectrally resolved, using the transmission diffraction grating , and linearly polarized by the polarizer . Its direction of polarization ( in Fig. 1) is off the -axis of the quartz plate . The polarization component of light after passing through , i.e., parallel and perpendicular to the direction of polarization of , is selected by rotating the polarizer . The photodetector measures the light intensity.
Part A. Measurement System Setup (2.3 points)
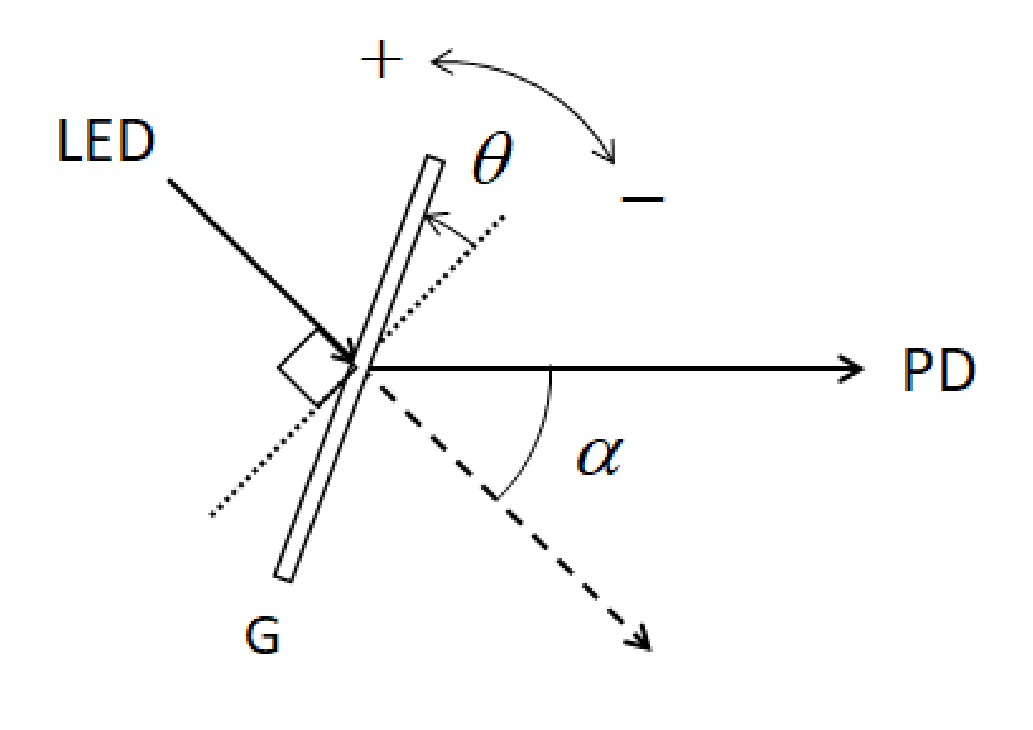
The LED output is incident on the grating surface (Fig. 6). The rotation angle of for normal incidence is defined as . The counterclockwise and clockwise rotations are denoted by and , respectively. The first-order diffraction angle is defined as illustrated. Using the groove period (or slit separation) of , the wavelength is given in terms of as
Hereafter use and the fixed diffraction angle .
Setup procedures for the measurement system are as follows.
[1] Stand the scale assembly upright (17 in Fig. 5) using the pedestal (17(b)).
[2] Set two batteries on the white LED module. The "+" sides must face toward you.
[3] Turn on the LED.
[4] Remove the screw on the front side of the LED module. Attach the slit to the LED module with the screw (4 in Fig. 4). Using the scale assembly, adjust the slit position to make the transmitted white light flux brightest, and measure the height of the beam center at the exit of the slit (for the procedure [9]).
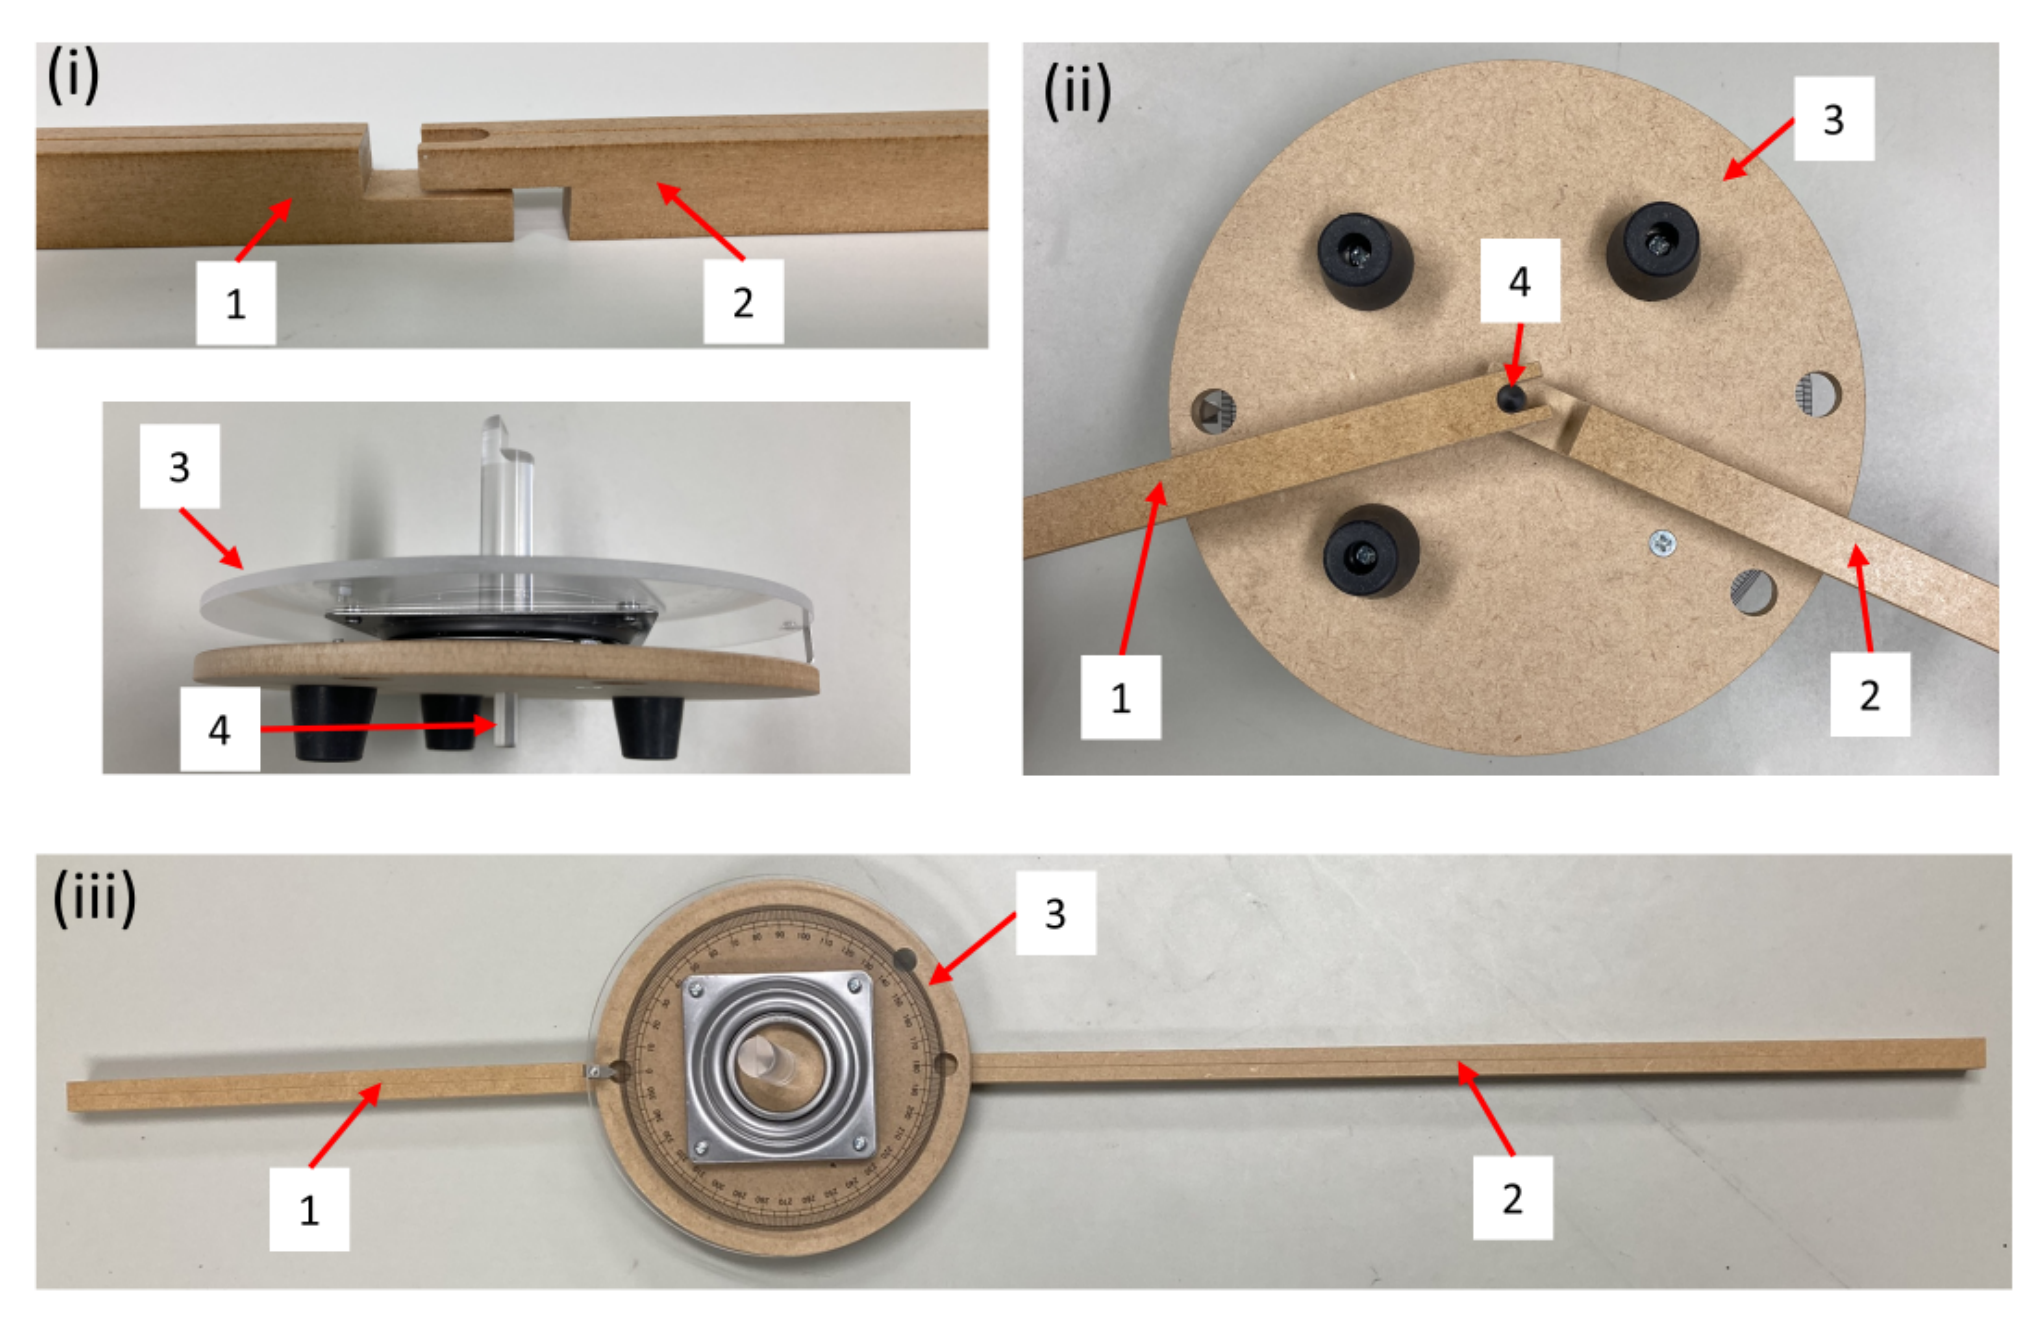
[5] Let the U-shaped open-slotted end of the long guide rail ride on that of the short one (Fig. 7(i)). Insert the rotation axle sticking out of the bottom face of the rotation stage into the 'virtual through-hole' made by the guide rails (Fig. 7(ii)). Ensure free and smooth rotation of both arms about the axle referring to Fig. 7(iii). Make sure that the long guide rail will stay on the table .
[6] Align the centerline of the short guide rail with on the scale of the rotation stage, and keep it in that place. You may put an anti-slip sheet under the short guide rail.
[7] Assemble the lenses (5 in Fig. 4).
[8] Place the white LED module with the slit and the lens (L1 in Fig. 3) on the short guide rail. Adjust the distance between the slit and L1 so that the light beam size after passing through L1 remains almost constant, i.e., collimated, over the flight path.
[9] Using the scale assembly, measure the beam height after L1. Adjust the level of L1 by loosening the setscrew of the post base and moving the post as necessary to keep the beam height almost the same as that right after the slit.
[10] Align the centerline of the long guide rail with on the angle scale on the rotation stage.
[11] Tweak the horizontal position of the lens mount (5(a) in Fig. 4) by loosening the setscrew and moving it right or left. The beam center after L1 should align with the center line of the long guide rail. You may put the scale assembly upside down over the long rail.
[12] Expose the second surface of the double-sided adhesive tape on the rear side of the transmission diffraction grating (6(b) in Fig. 4) and affix it to the axle top of the rotation stage (6 in Fig. 4).
[13] Face the front side of the grating towards the light source, and rotate the stage so that the reflected light enters the slit, i.e., (normal incidence). Record the angle of the rotation stage. It will be used in B.1.
[14] Move the long guide rail around the axle so that (Fig. 6). Once fixed, you may place another anti-slip sheet thereafter to prevent accidental misalignment.
[15] Place the lens (L2 in Fig. 3) and the photodetector (PD in Fig. 3) with the cylinder mount on the long rail. To focus the diffracted light onto PD, adjust the distance between PD and L2 along the long rail, and also the height of L2. The vertical beam diameter is thereby minimized. Check the beam diameter with the white card. In case it is too weak to recognize with the naked eye, use the light-shield box to cover PD.
[16] Set the light-shield cylinder to the mount (13 in Fig. 5). The light shield minimizes the unwanted light to be detected.
[17] Connect PD to the DMM. The red (black) jump wire goes to red (black) terminal. Set the multimeter to the DC voltage measurement mode.
[18] Adjust the height of L2 to maximize the DMM readings. Hereafter the intensity of light is identified with the voltage values on the DMM.
A.1 Calculate the longest wavelength that can be measured and the associated . [0,3 т.]
A.2 Calculate the numeric values of for . [0,2 т.]
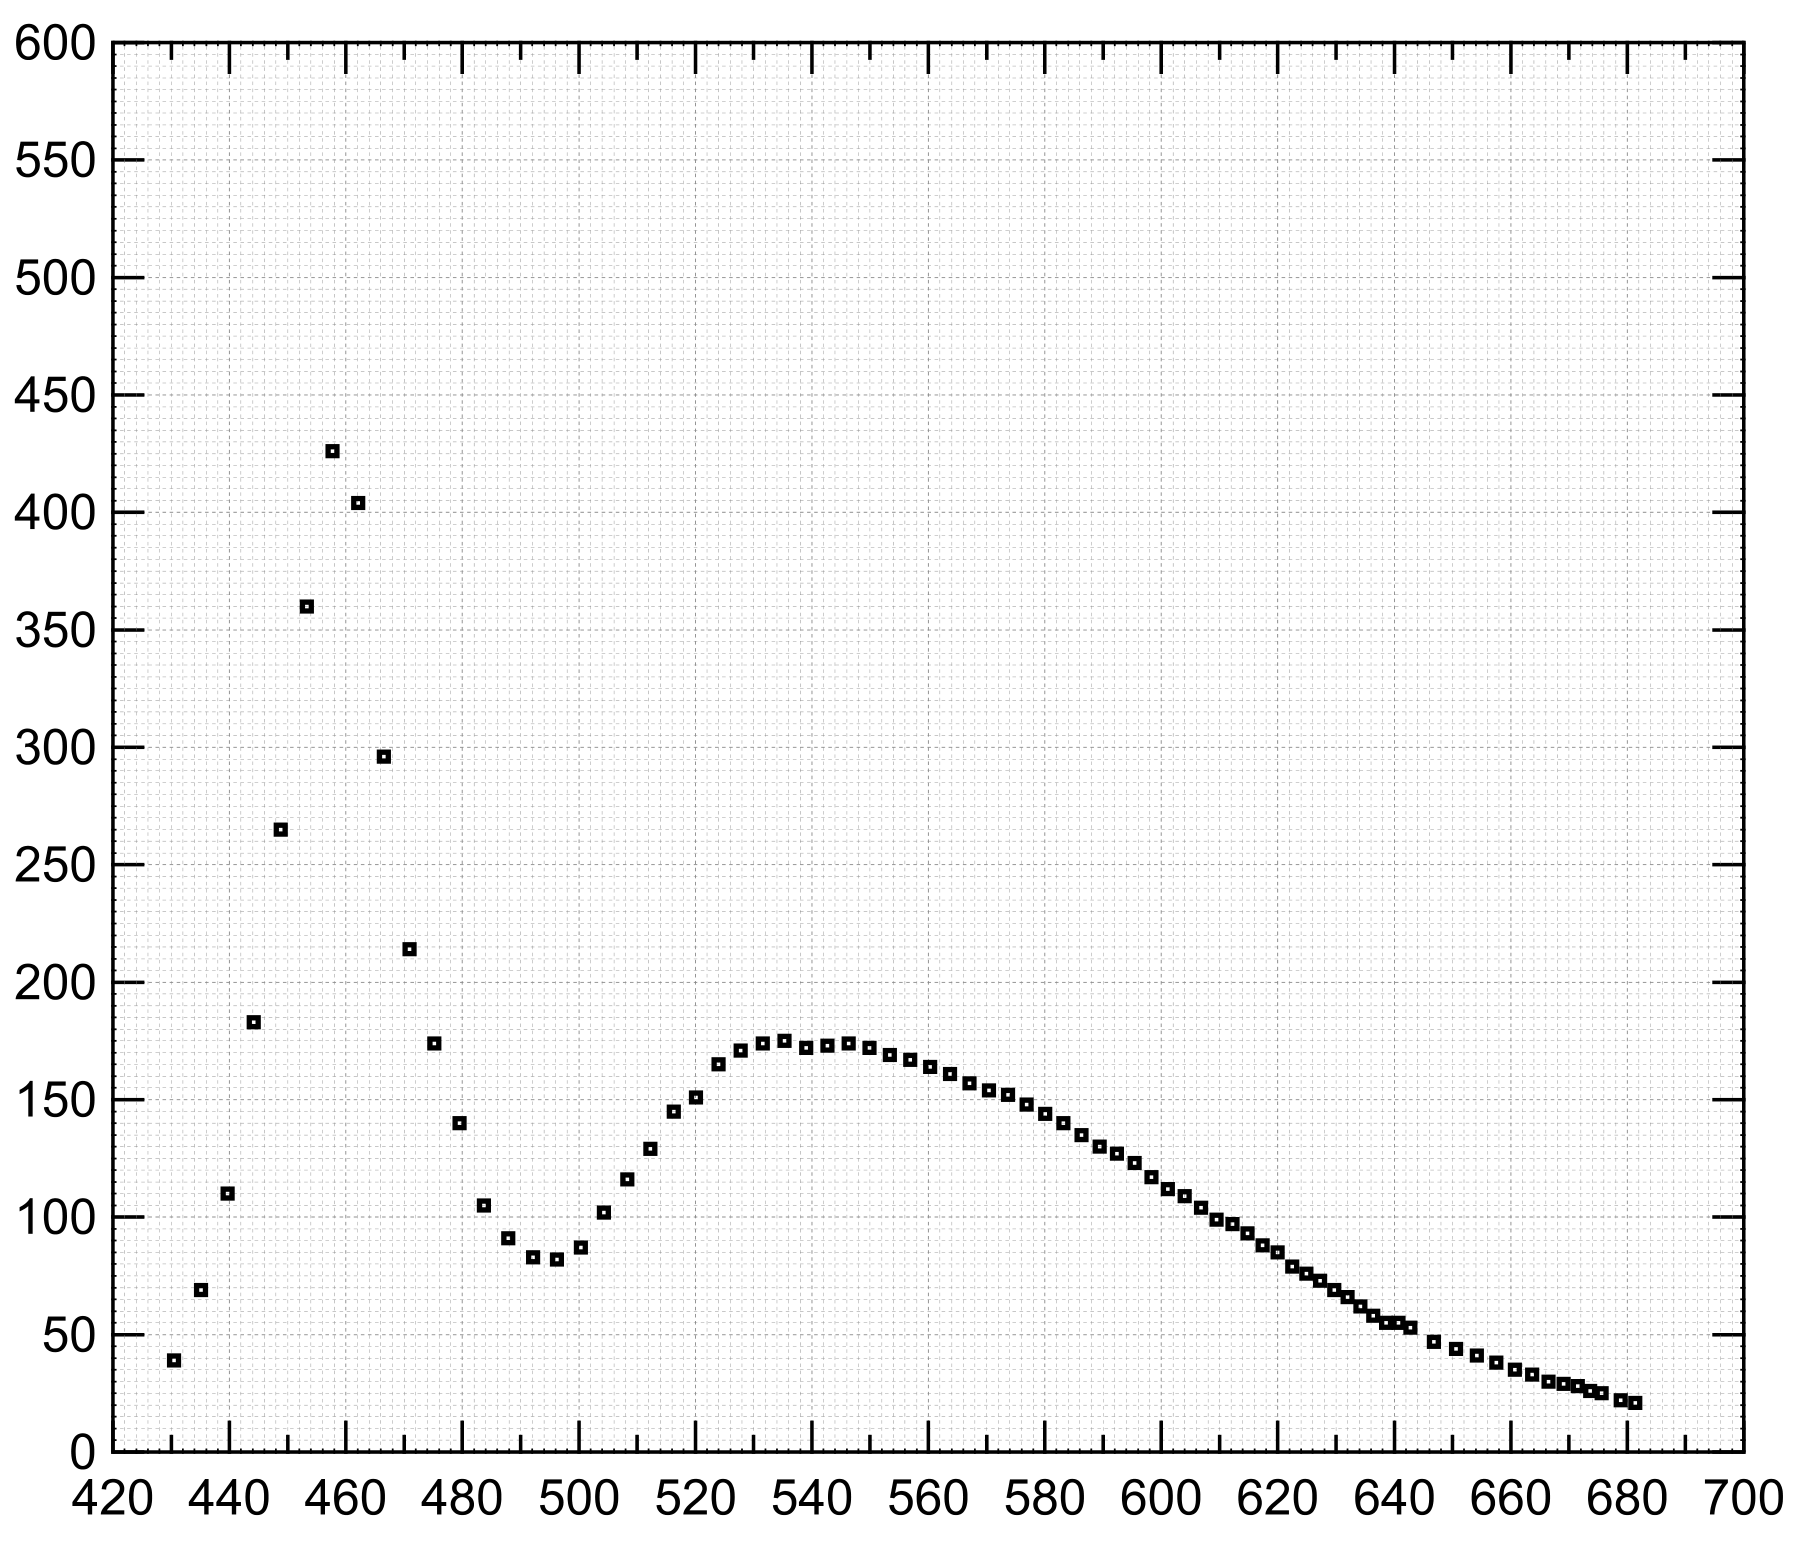
A.3 Rotate the rotation stage and find the angle and the corresponding wavelength at which the blue LED spectral density is maximized, assuming that . If your answer for is between 450 and 460 nm, your apparatus is properly aligned; write down on the answer sheet and continue. Otherwise, you will have to find the true value of . Without changing anything, including your original value for , find a corrected value for which would make fall in the appropriate range. Record this on the answer sheet and use it for the rest of the problem. [0,8 т.]
A.4 Set the rotation stage to the position. Watch the readings on the DMM and find the angle of the rotation mount of the polarizer P2 such that its polarization direction is perpendicular to that of the light transmitted through the polarizer P1. From this result, find the angle of the rotation mount of the polarizer P2 when its polarization direction is parallel to that of the polarizer P1. [0,3 т.]
A.5 Block the light through the slit by placing the black card in front of the slit. By doing so, you can evaluate the system background, i.e., the offset of the intensity from zero. We define the light intensities and when the angles of the rotation mount of the polarizer P2 are and , respectively. Measure the offsets and . Note that and are due to light other than the light source. They should be eliminated by subtraction to determine the true contribution from the light source. [0,2 т.]
A.6 and refer to the light intensities from the light source when the angles of the rotation mount of the polarizer P2 are and , respectively. Measure the light intensities and for . [0,5 т.]
B.1 Place the quartz plate between polarizers P1 and P2 and measure the transmitted light intensities and at various angles . Your measurements should fully cover the wavelength range of 440 nm to 660 nm. Tabulate the following parameters: (angle readings of the rotation stage), , , , , , . Note that when the value of increases, the value of decreases with the same value, and vice versa. You do not have to use every row of the provided table, but you should take enough data to obtain accurate results. [2 т.]
B.2 Plot the spectrum of the white LED, i.e., , versus wavelength on the graph. [1 т.]
B.3 Find the full width at half maximum of the spectrum of the blue LED built in the white LED. It is the width of a peak measured between those points which are at half the maximum amplitude [0,2 т.]
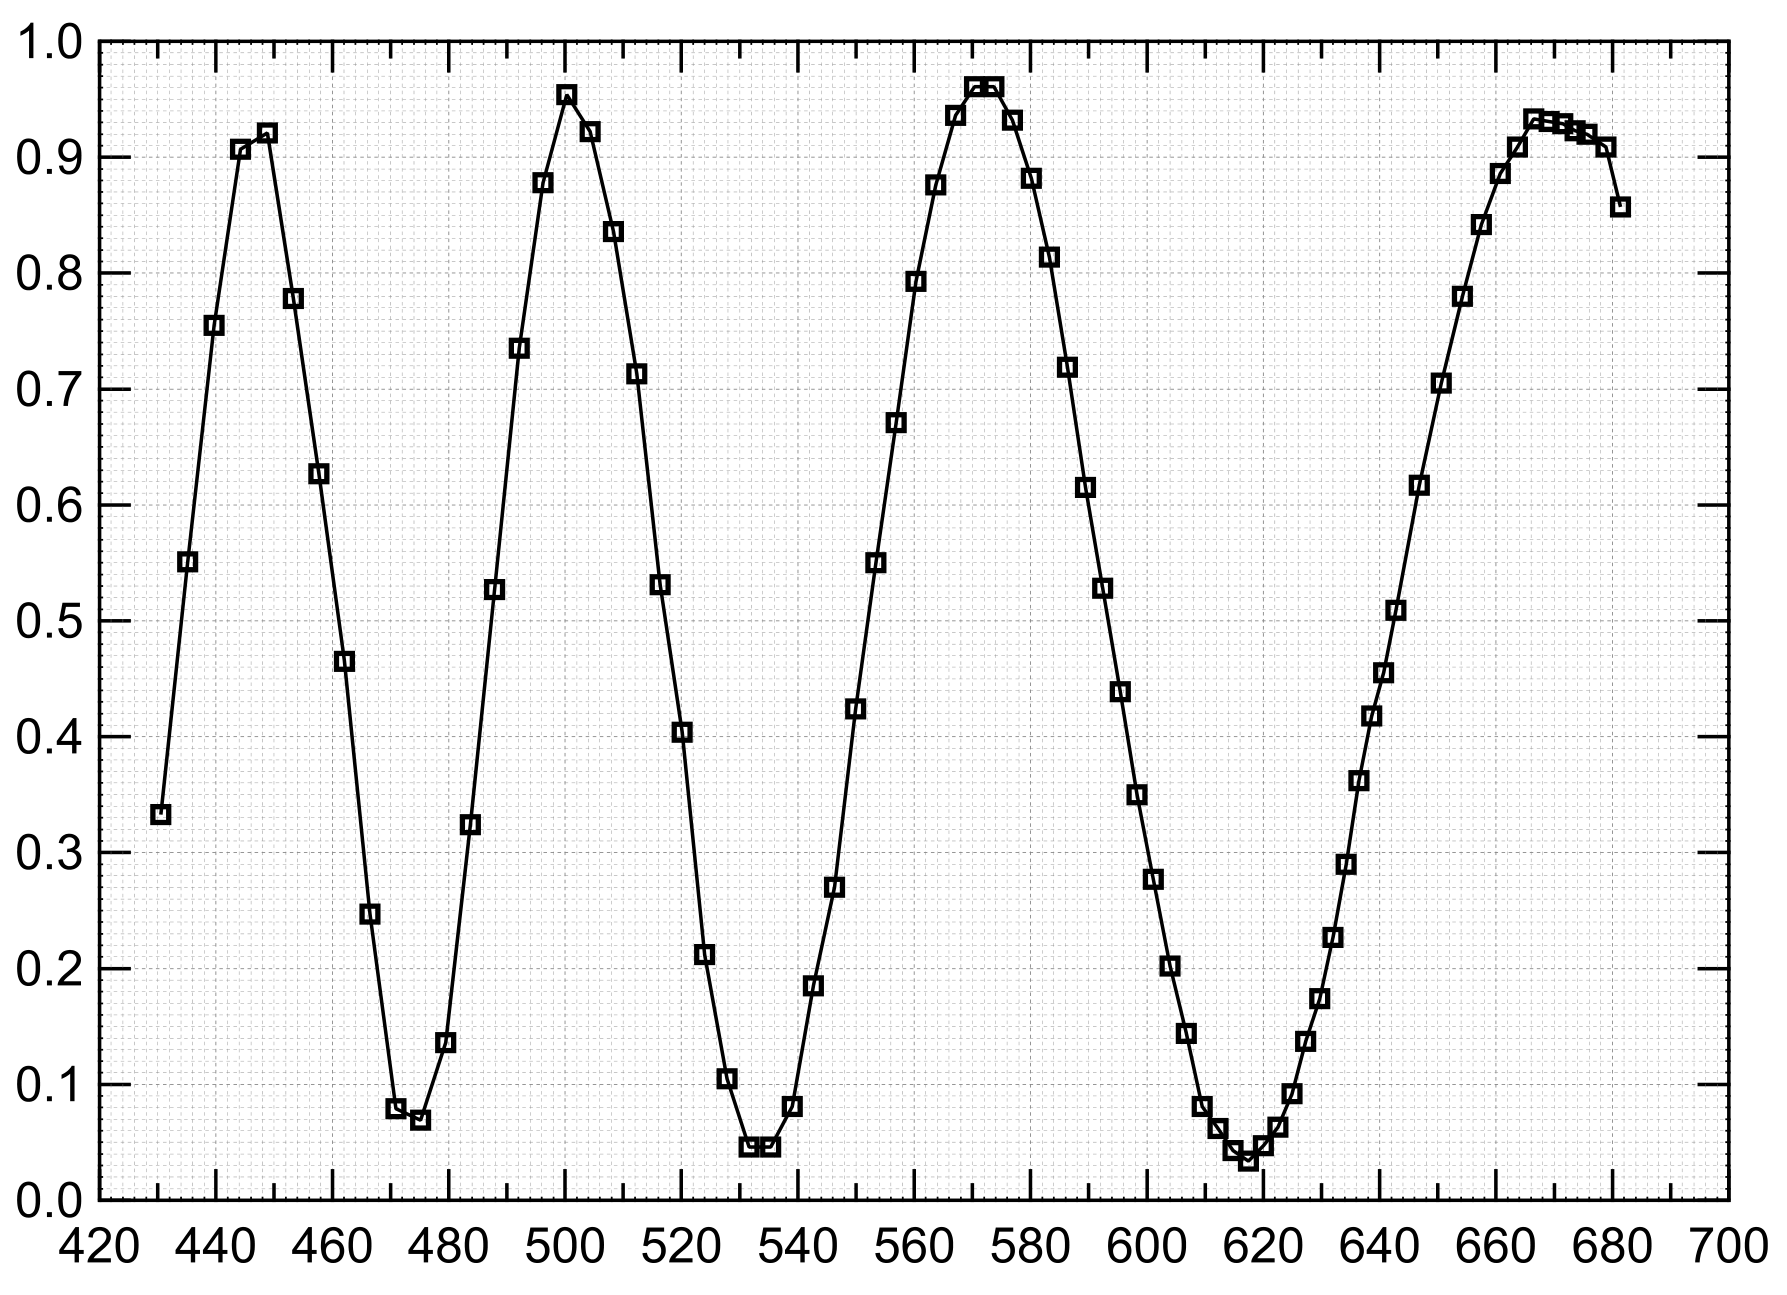
B.4 Plot the spectrum of on the graph. [1,5 т.]
C.1 From the graph, find all the wavelengths at which the intensities go through local minima. The associated order number according to Eq. (6) must be given below the corresponding wavelength. To determine the birefringence , use the values of and given in Table 1. [1,5 т.]
C.2 Obtain the sample thickness . [1,5 т.]
Решение
Покажи официалното решение
Оригинал в Архива: IPhO_2023_Q5.pdf · официални решения: IPhO_2023_S5.pdf