IPhO 2025, experiment — Задача 1. Sand craters and dunes (10.0 points)
Автор: Olympiads XYZ · транскрипция на официалните материали
Проверена срещу оригинала на 13.9.2026 от същия модел, който я е транскрибирал (без независима проверка)
Experiment — Q2 — Sand craters and dunes (10.0 points) — English (Official) · 10 т.
Условие
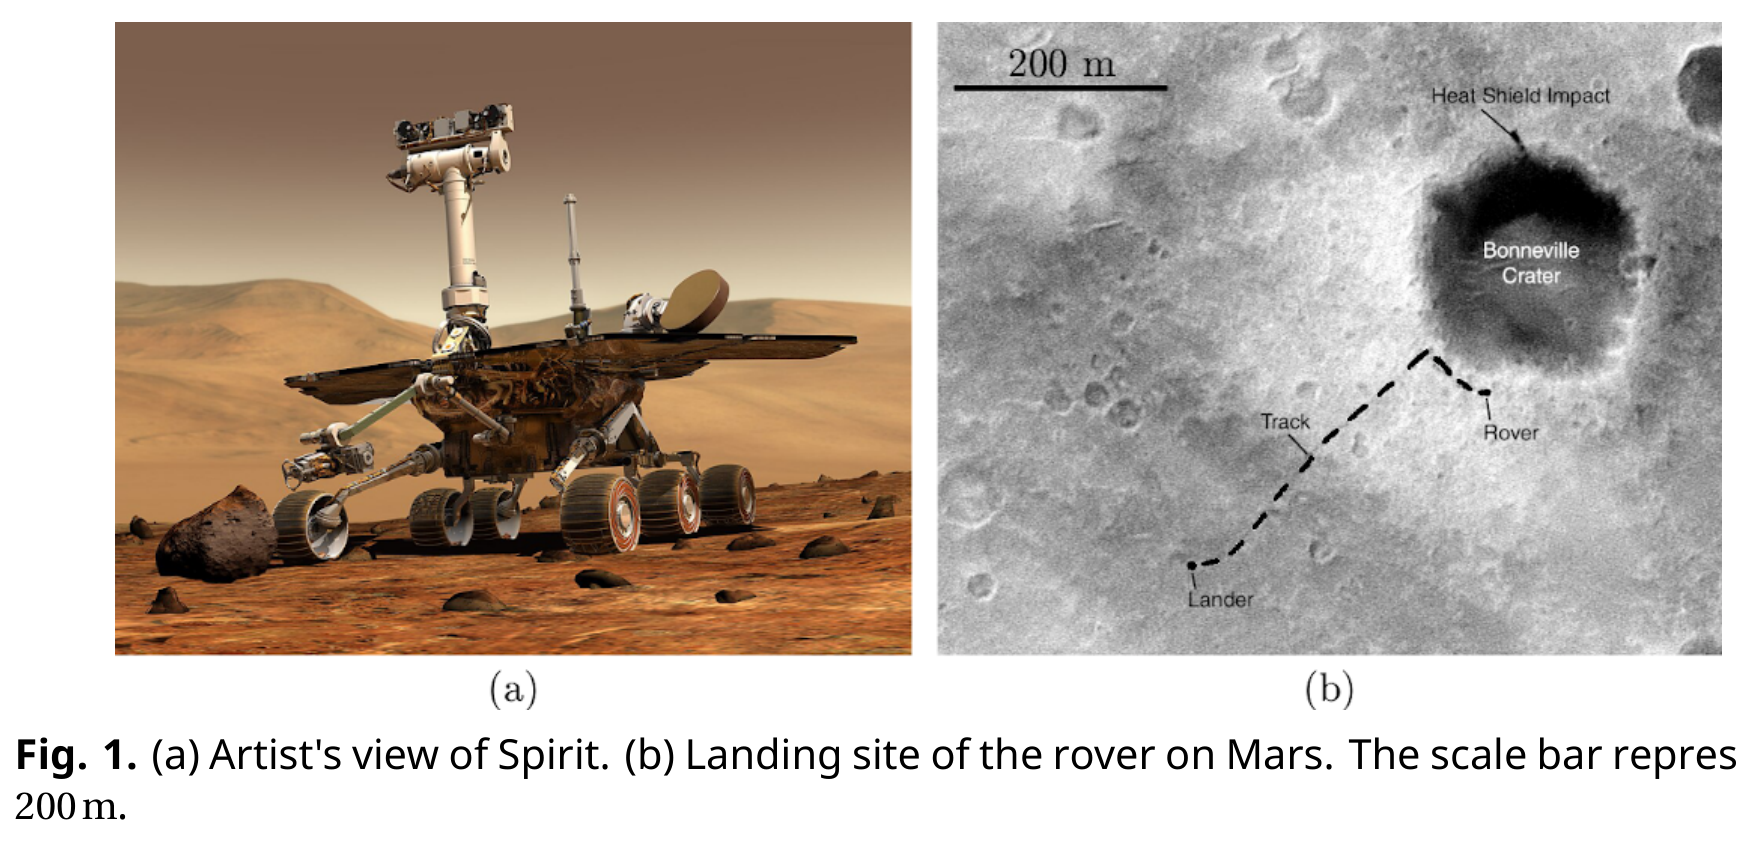
NASA's Spirit rover (Fig. 1.(a)) landed on Mars in 2004 to study its geology and potential presence of water. The landing site (Fig. 1.(b)) is surrounded by craters of various sizes and sand dunes. During exploration, the rover must avoid getting stuck in the sand dunes of Mars.
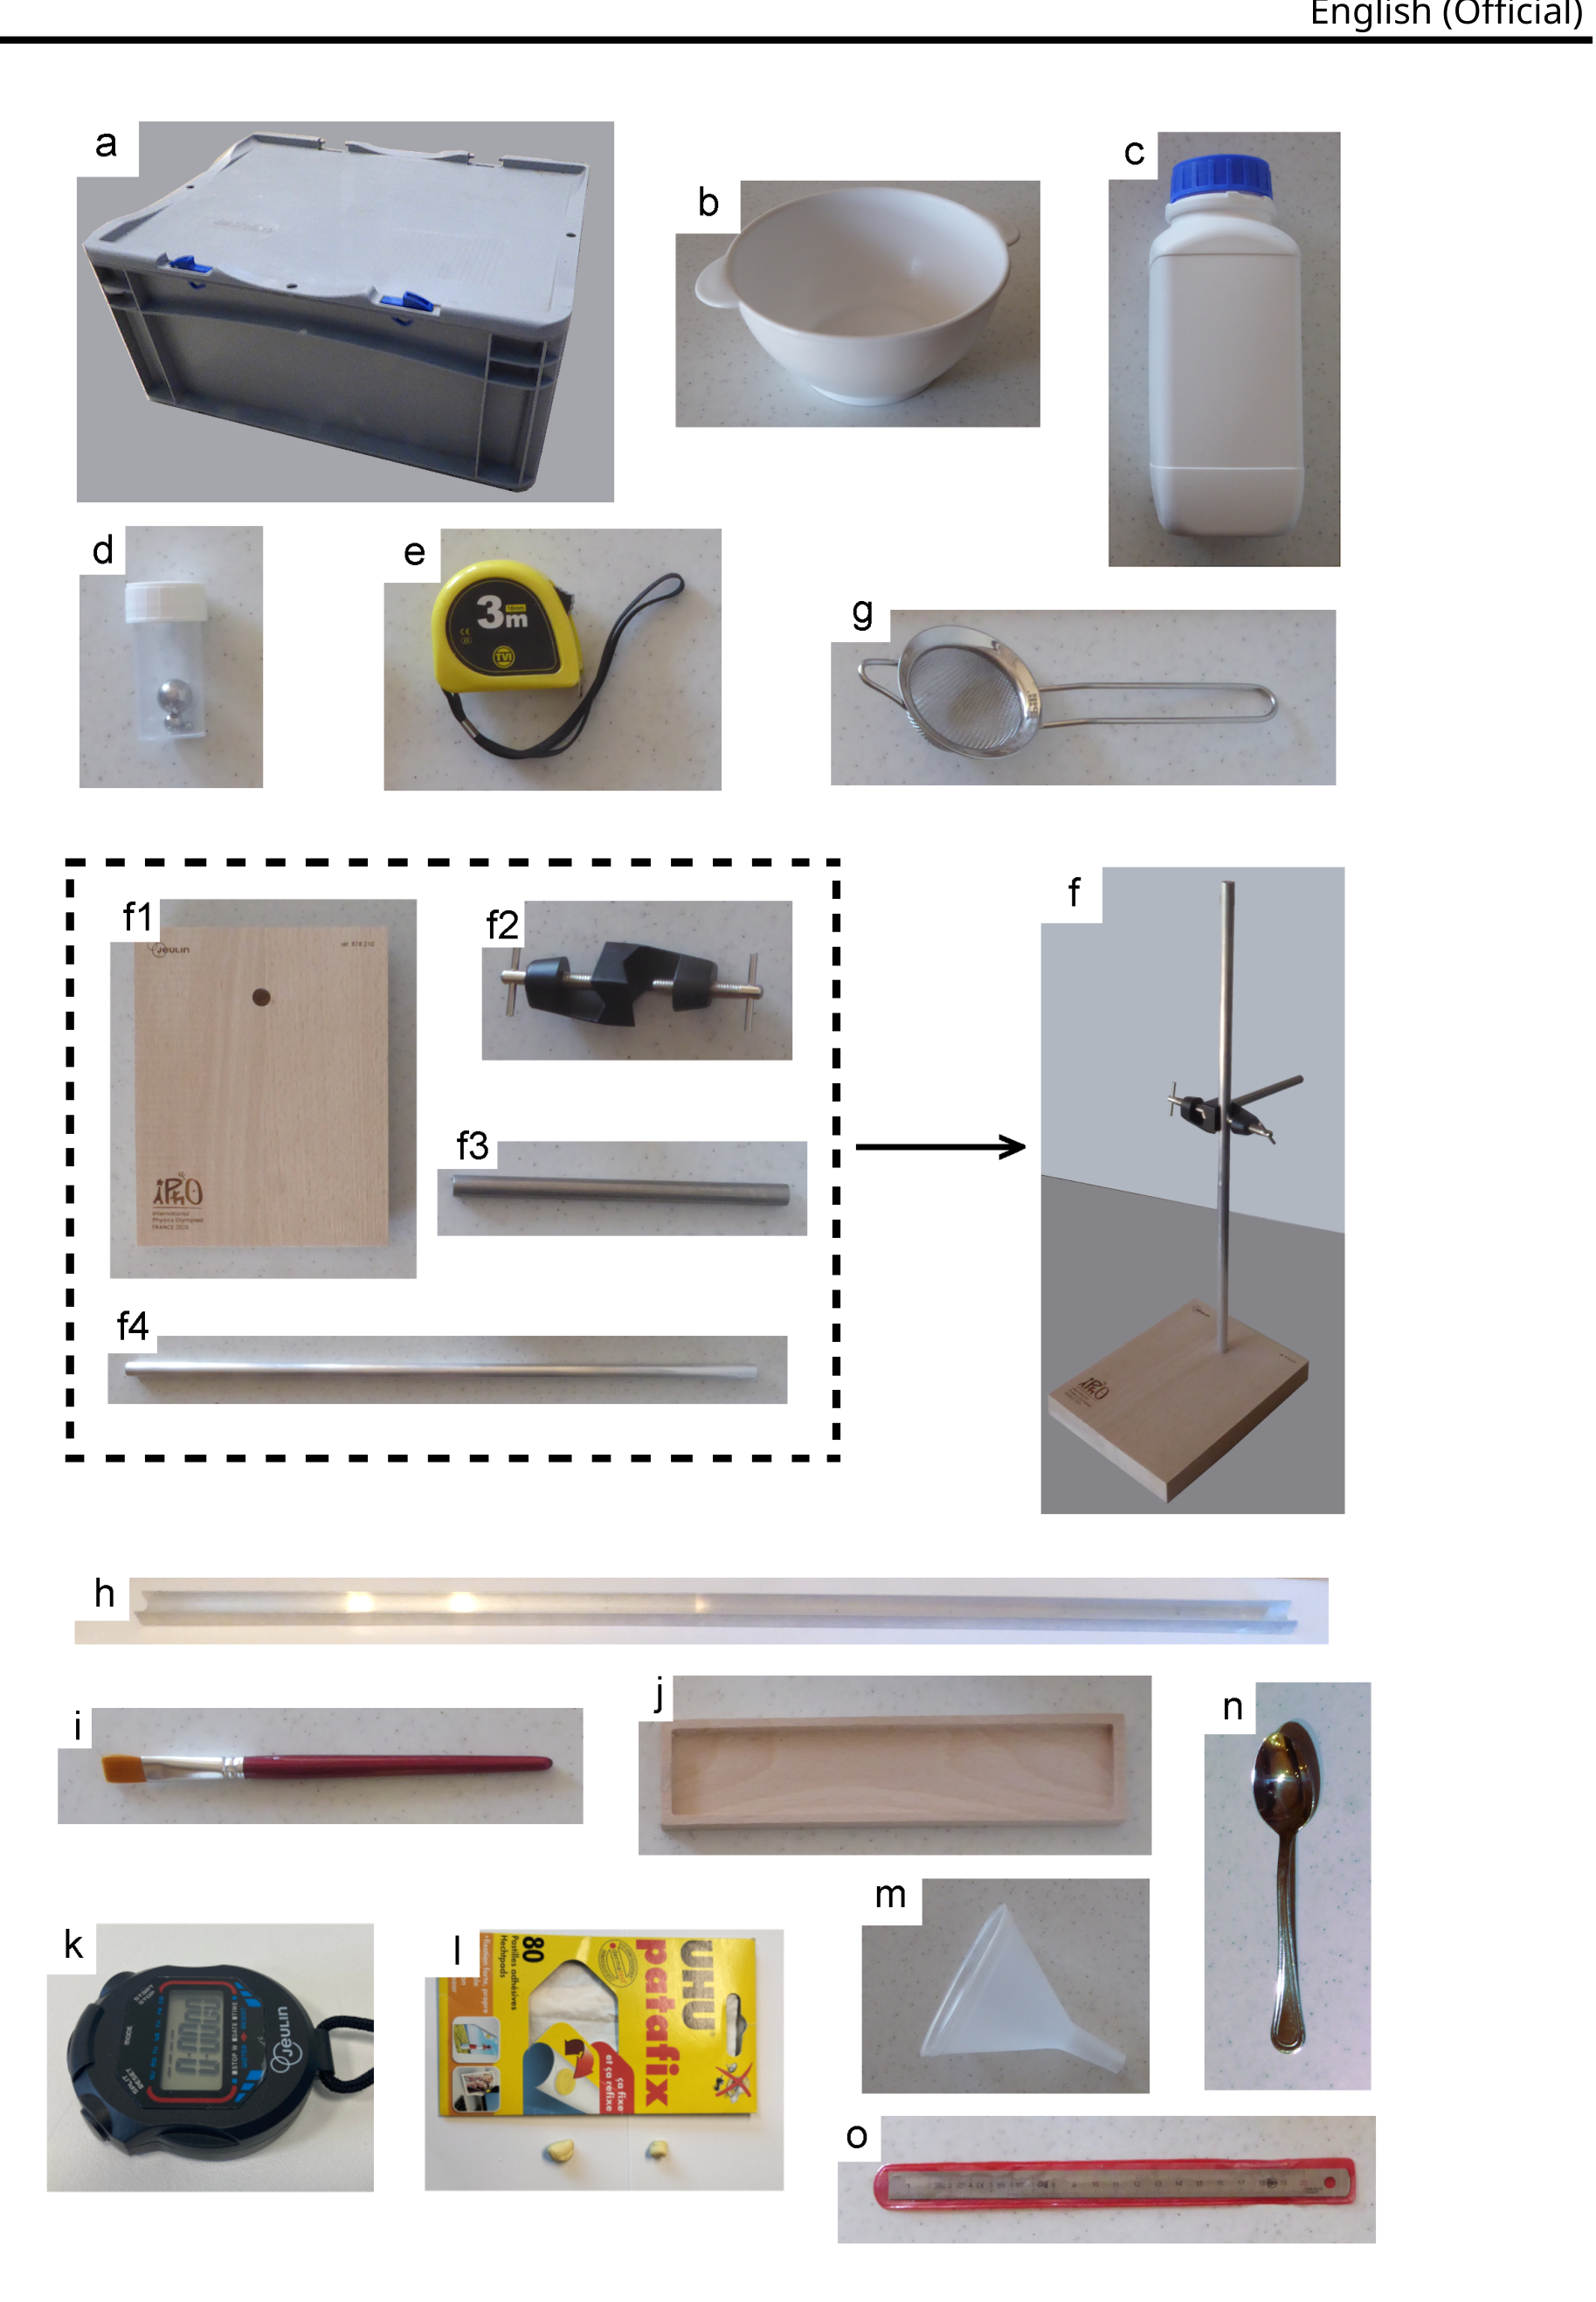
The problem has two independent parts A (crater formation) and B (sand trapping) that can be treated in any order. The list of equipment is given below and illustrated in Fig. 2.
- (a) Plastic box, needs to be emptied. The empty box will be used to collect the overflowing sand during experiments.
- (b) Bowl.
- (c) Bottle of sand.
- (d) 6 steel balls in a container. The balls have 4 different diameters. The three smallest ones are identical.
- (e) Tape measure.
- (f) Holding device consisting of a wooden tray with rubber feet (f1), a vertical rod (f4), clamping screw (f2) and horizontal rod (f3). The different elements must be assembled as shown in the photo (f).
- (g) Sieve, used to find the small ball if it gets lost in the sand.
- (h) Aluminium rail, 1 m long.
- (i) Brush to clean the rail and balls of sand if necessary.
- (j) Wooden track.
- (k) Chronometer.
- (l) Adhesive putty.
- (m) Funnel to help to put the sand back into the box at the end.
- (n) Spoon.
- (o) Ruler.
A. Impact craters
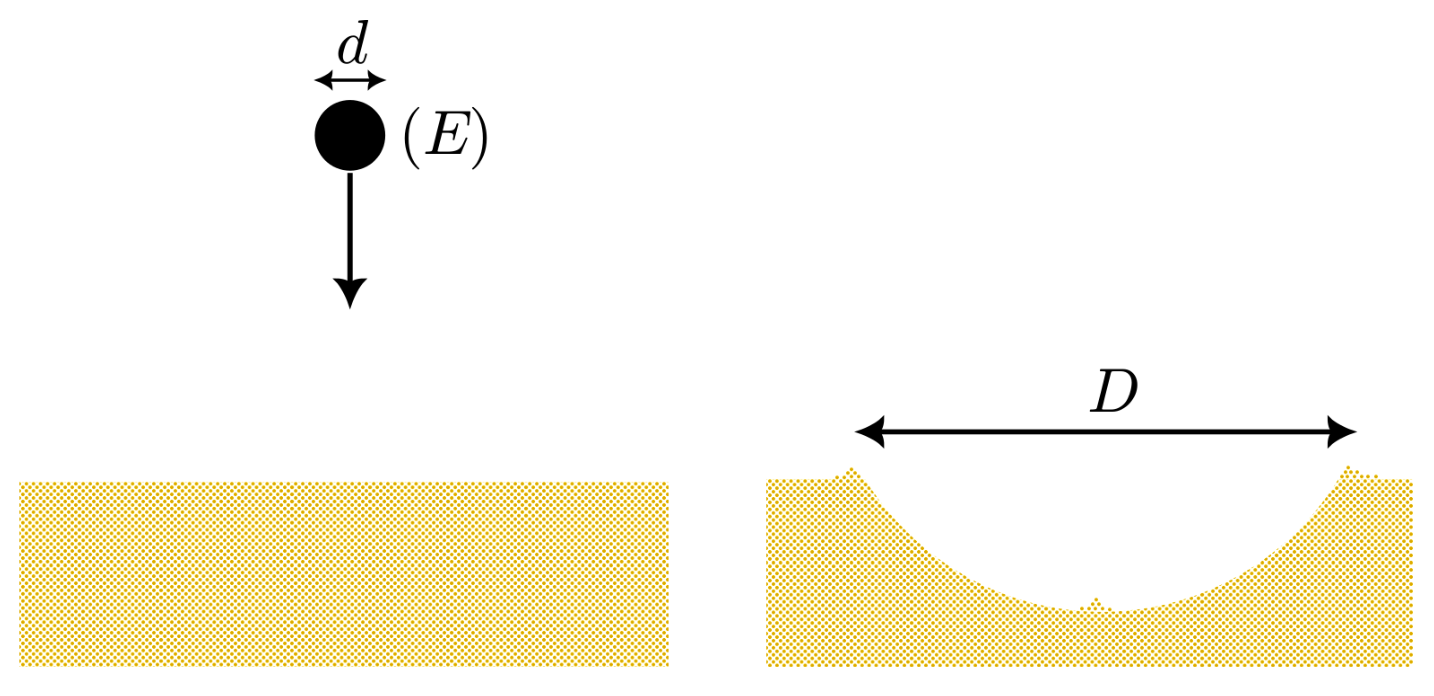
Craters on Mars, whose diameter varies from about to several hundreds of km, result from the impact of meteorites. Different models predict how depends on the impact parameters: impactor diameter , energy (Fig. 3).
Model 1: depends only on the impactor diameter
(1)
where is a dimensionless number independent of and .
Model 2: the meteorite energy is converted through volumic processes during the impact. This model predicts that is proportional to
(2)
where is a parameter independent of and .
Model 3: is used to eject material outside the crater. Under this assumption
(3)
where is a parameter independent of and .
Here, we perform experiments on crater formation at a centimeter scale to compare the three models. Steel balls of different diameters and masses , with a density (item (d) of the equipment list), act as the meteorites.
| Ball #1 | ||
|---|---|---|
| Ball #2 | ||
| Ball #3 | ||
| Ball #4 |
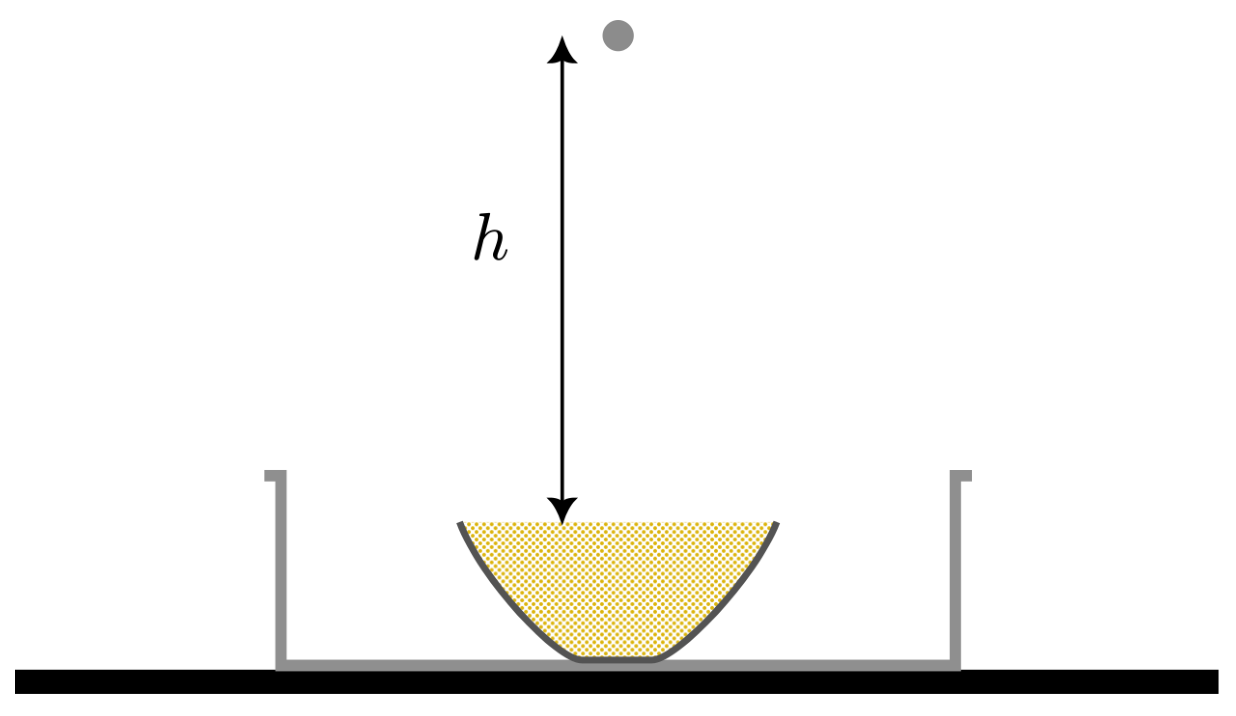
The bowl (b) filled with sand (c) is placed inside the emptied plastic box (a) that will help collect the excess sand. The bowl is filled completely with sand and the surface is carefully leveled with the edge of the ruler (o). Avoid compacting the sand! To release the ball above the bowl, one can use the stand equipped with a rod and thumbscrew (f). The rod serves as a guide to release the ball directly above the bowl and also to measure the drop height above the surface, which will be measured using the tape measure (e).
Drop ball #3 from a height and measure the diameter of the crater formed. Repeat the experiment 5 times. After each impact, mix the sand with the spoon (n), and level it carefully with the edge of ruler (o). Avoid compacting the sand! If needed, use the sieve (g) to find the ball if it gets lost in the sand.
During the fall, the air drag force is
(4)
where is the ball velocity, is the air density and is a dimensionless coefficient of order unity.
The air drag force is negligible if the ball is dropped from a height less than the maximum drop height , defined as the height at which the air drag force remains less than 10 % of the weight throughout the fall.
Investigate the relationship between and experimentally in order to compare the three power laws presented in the introduction. Find out if the exponent changes across the range of energies tested. To achieve this, take a series of measurements by dropping the balls from different heights. A wide range of energies must be covered. The balls can be dropped from heights of up to in order to reach high values of while respecting the condition established in A.2. For each set of parameters, repeat the experiment only twice, and compute the mean value .
B. Rolling and bogging in sand
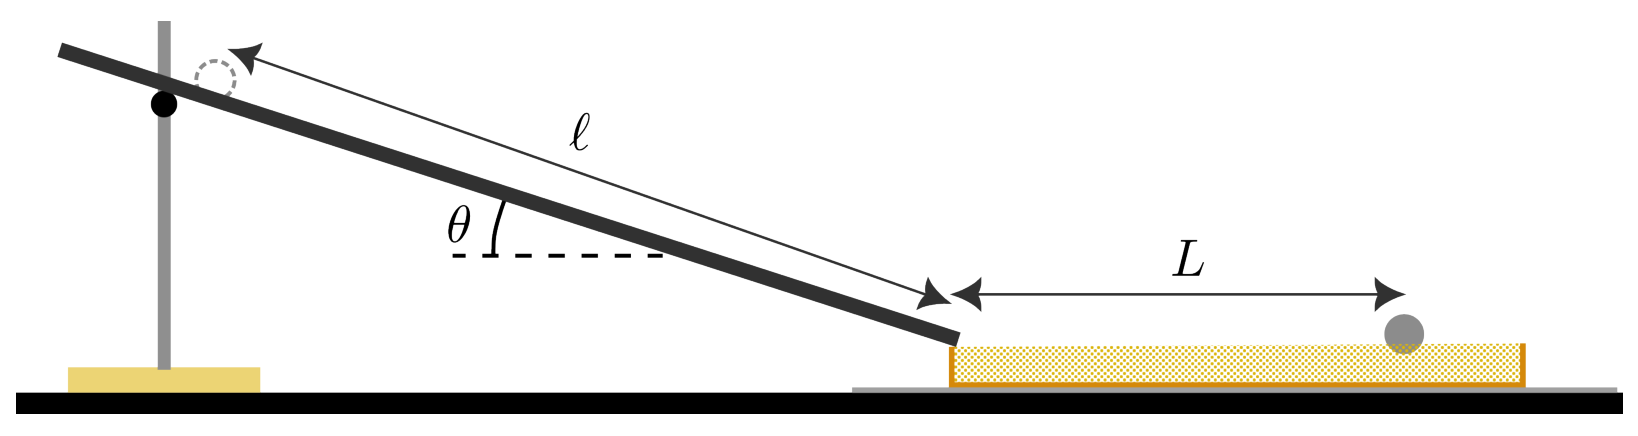
Five years after landing, the rover Spirit bogs in the sands of a Martian dune for good. Rolling in sand is particularly delicate as the motion of grains dissipates a lot of energy. Here, we study the braking of a ball rolling in sand. The ball, initially at rest, is first accelerated on a rail inclined at an angle , then slowed down on a bed of sand.
Ball motion along the rail
Ball #4 is released with no initial speed from an arbitrary point on the rail (h), chosen as the origin of the -axis ( ) (Fig. 5). Let denote the position of the ball along the rail. The moment of inertia of a ball of mass and diameter with respect to an axis passing through it center is given by . The kinetic energy of a ball moving at speed while rotating at angular speed is
(5)
We assume that the ball rolls on the rail without slipping and neglect any energy dissipation.
One end of the rail (h) rests on the edge of the wooden track (j), which is at this point empty of sand. The other end of the rail is supported by the stand (f) in such a way that it forms an angle of inclination with the horizontal. Make sure to perform this adjustment carefully. The rail is secured in place (on both sides) using adhesive putty (l).
Use a chronometer (k) to measure the time taken by the ball to travel a distance along the rail.
Measure with the order of magnitude of its statistical uncertainty for at least 8 different values of .
Motion of the ball in sand
We note the distance travelled by the ball on the rail. On the sand, the ball comes to a stop after travelling a distance as defined in Fig. 6.
It is thus slowed down by a drag force which may have two possible origins:
- Model #1 (solid friction): as between two solids in relative motion, the sand exerts on the ball a constant drag force , where is the effective drag coefficient of the ball-sand contact and is the mass of the ball.
- Model #2 (fluid drag): the drag force depends linearly on the ball velocity, where is a constant and the norm of the velocity.
The goal here is to determine which proposition best describes the observed braking behavior.
When moving in sand, the ball is modelled as a point mass. Given the small value of the slope of the rail, we neglect any energy loss in the transition between the rail and the sand track. Establish the theoretical law linking to in each of the two situations (solid friction or fluid drag). The two suggestions lead to a power law of the form in which the exponent takes two different values.
Place the wooden track (j) on a sheet of paper. Fill the track with sand and prepare a uniform layer by carefully scraping the surface with the ruler. Avoid compacting the sand! Adjust again carefully the angle of the rail to . Release ball #4 () on the inclined rail so that the distance travelled on the rail is .
Before each run, stir the sand, refill the track and scrape the surface again. Clean the rail and the ball from sand by using the brush (i). At the end of the experiment, use the sheet of paper as a funnel to put the sand in excess back in the bottle.

A.1 Present your results in a table and give with its uncertainty. [0,6 т.]
A.2 Determine the theoretical expression for the maximum drop height . Calculate numerically for the four available balls. [0,5 т.]
A.3 Present your results in a table: mass of the ball , drop height , impact energy , crater diameter . [1,7 т.]
A.4 Plot your results on the graph paper of your choice (logarithmic or linear). On the graph representation, add lines corresponding to models 1, 2 and 3. State which of the three theoretical models best fits the experimental data. [1,2 т.]
B.1 Express the position of the ball as a function of time , angle and acceleration of gravity . [0,4 т.]
B.2 Take 5 measurements and present the result along with the order of magnitude of its statistical uncertainty. [0,7 т.]
B.3 Present your results in a table. [0,8 т.]
B.4 Plot your results with error bars to confirm the law established at question B.1. Deduce an experimental estimate of the constant with its uncertainty. [1 т.]
B.5 For model 1 and model 2, give the relationship between and and the value of . [0,6 т.]
B.6 Measure the distance travelled in the sand until the ball comes to a stop. Perform several measurements (at least 5) to determine along with its unit and uncertainty. [0,8 т.]
B.7 After several measurements for at least 8 values of (keeping ), plot with its error bars as a function of and conclude which model best describes the drag force . [1,5 т.]
B.8 Based on the chosen model, specify the value of the coefficient or that characterizes the force . [0,2 т.]
Решение
Внимание: Непълно решение
The solution of the top-level problem continues on solutions pages 12–13 (beyond this window); pages 6–11 are transcribed here.
Покажи официалното решение
Оригинал в Архива: IPhO_2025_Q5.pdf · официални решения: IPhO_2025_S5.pdf