ISPhO 2024, Експеримент — Задача 1. E1. Absorption spectroscopy and chemical kinetics
E1. Absorption spectroscopy and chemical kinetics
Условие
Chemical kinetics is a branch of physical chemistry that studies the rates of chemical reactions over time. The main purpose of chemical kinetics is to study all factors that affect the rate of both the overall process and all intermediate stages. There are many methods in this science that allow determining the chemical composition of substances and solutions based on indirect measurement results. The method used in this problem is called absorption spectroscopy. It involves investigating how light of different wavelengths is absorbed by a substance or solution.
ATTENTION! You have been provided with NaOH granules! This substance is extremely caustic! Follow these safety rules when working with it:
- Do not touch NaOH granules with naked hands!
- Avoid contact of NaOH granules and solution with skin and face!
- Store NaOH in containers with a closed tubes.
- If NaOH comes into contact with skin or face, immediately contact the organizers!
Equipment (optical)
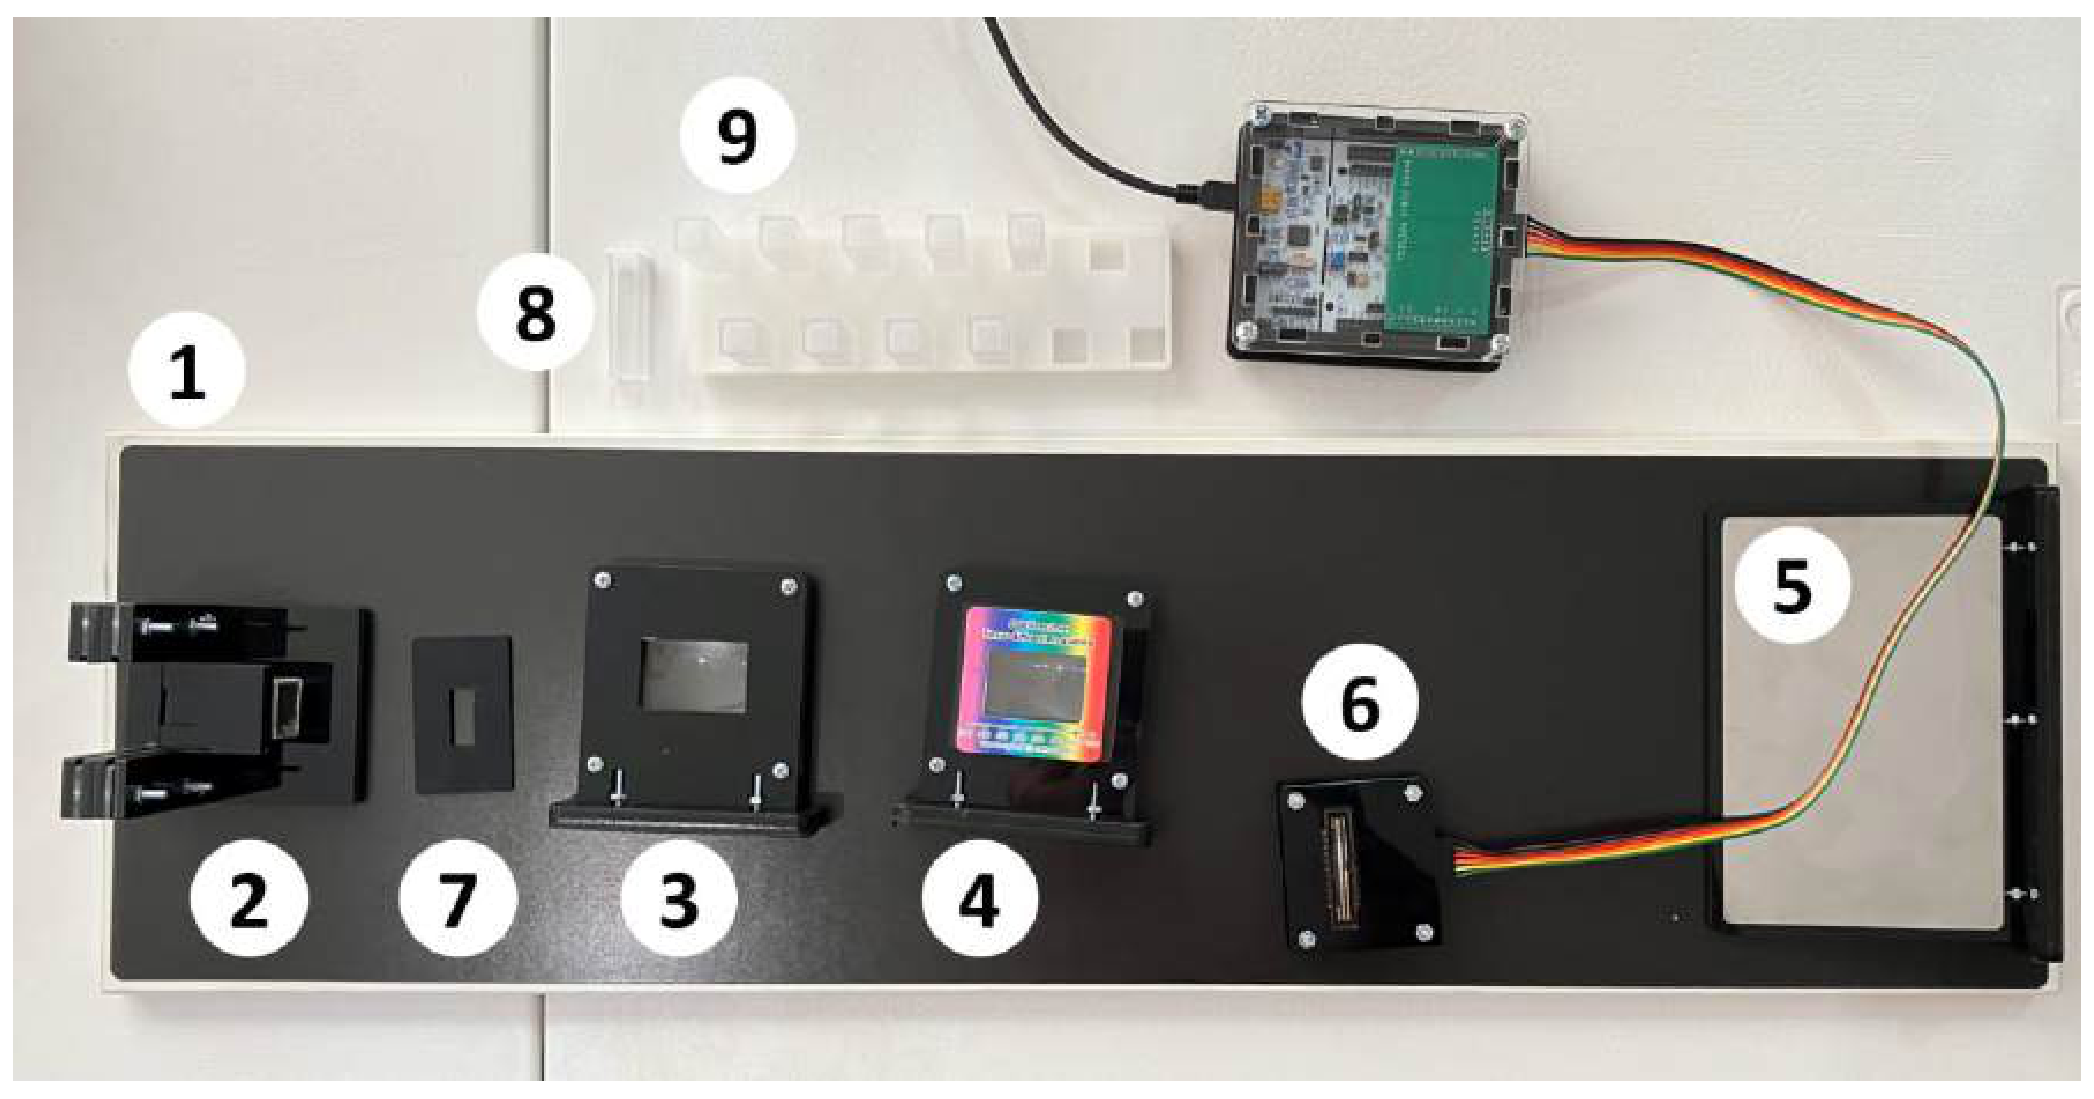
- Optical table.
- Holder for light source.
- Lens .
- Lens with diffraction grating on a magnet.
- Screen.
- Photodetector CCD array connected to a computer (hereinafter - sensor).
- Diaphragm.
- Optical cuvette with cap - 10 pcs.
- Holder for optical cuvettes.
Equipment (electrical)
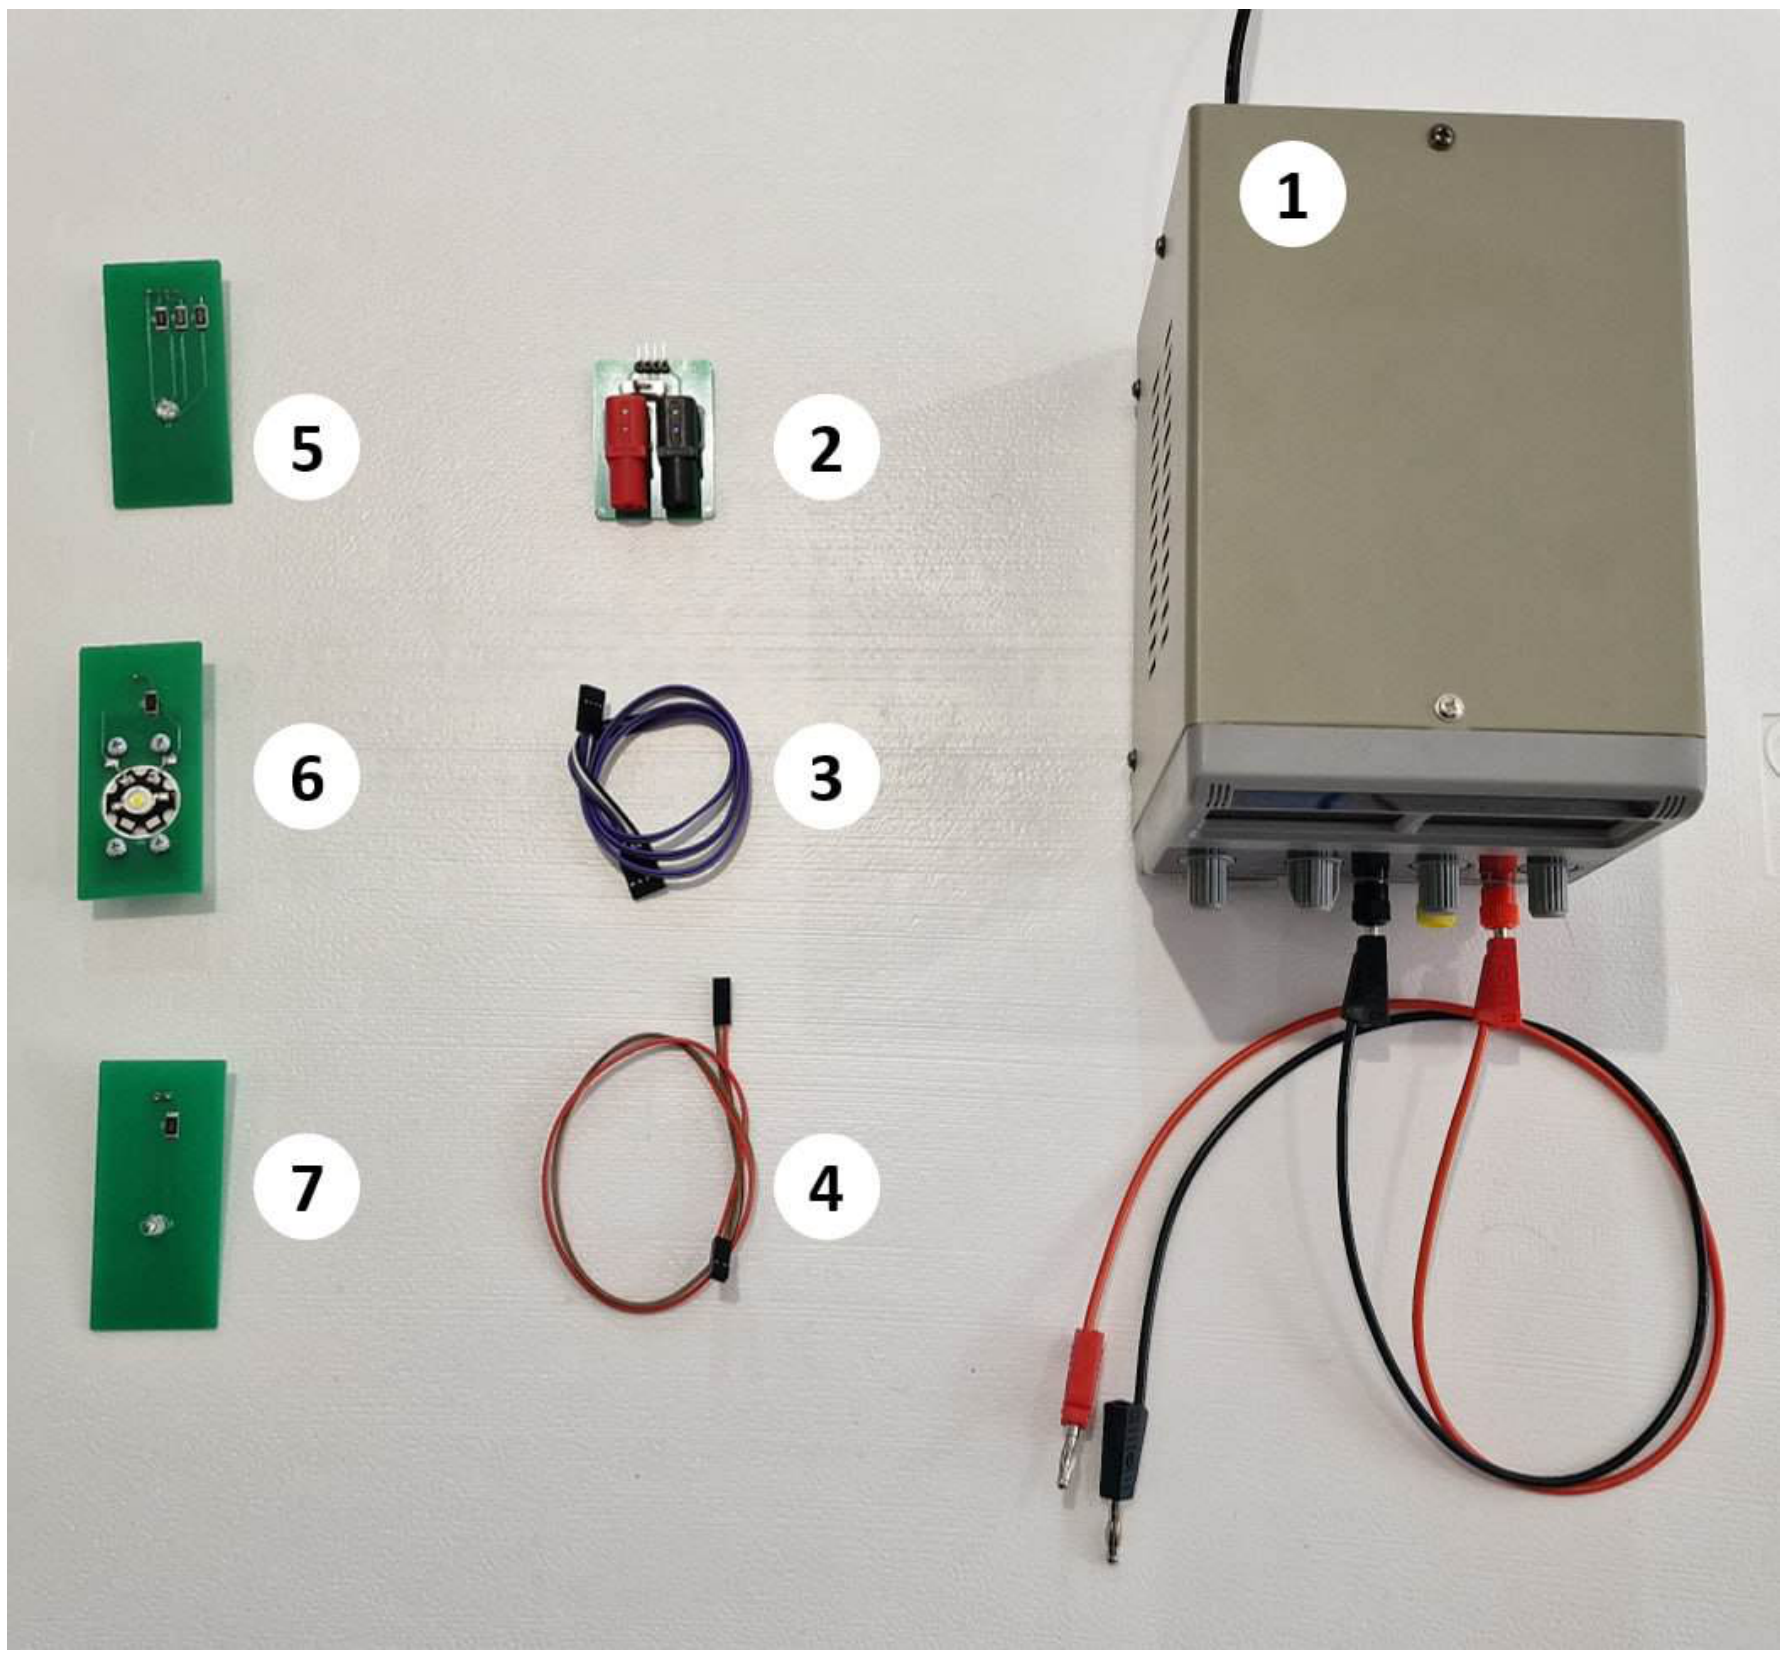
- DC power supply up to 15 V.
- Adapter with switch.
- Connector with 4 outputs.
- Connector with 2 outputs.
- Three-color LED ”LED-RGB”.
- Full spectrum LED ”LED-CON”.
- Unknown color LED ”LED-UNK”.
Equipment (chemical)
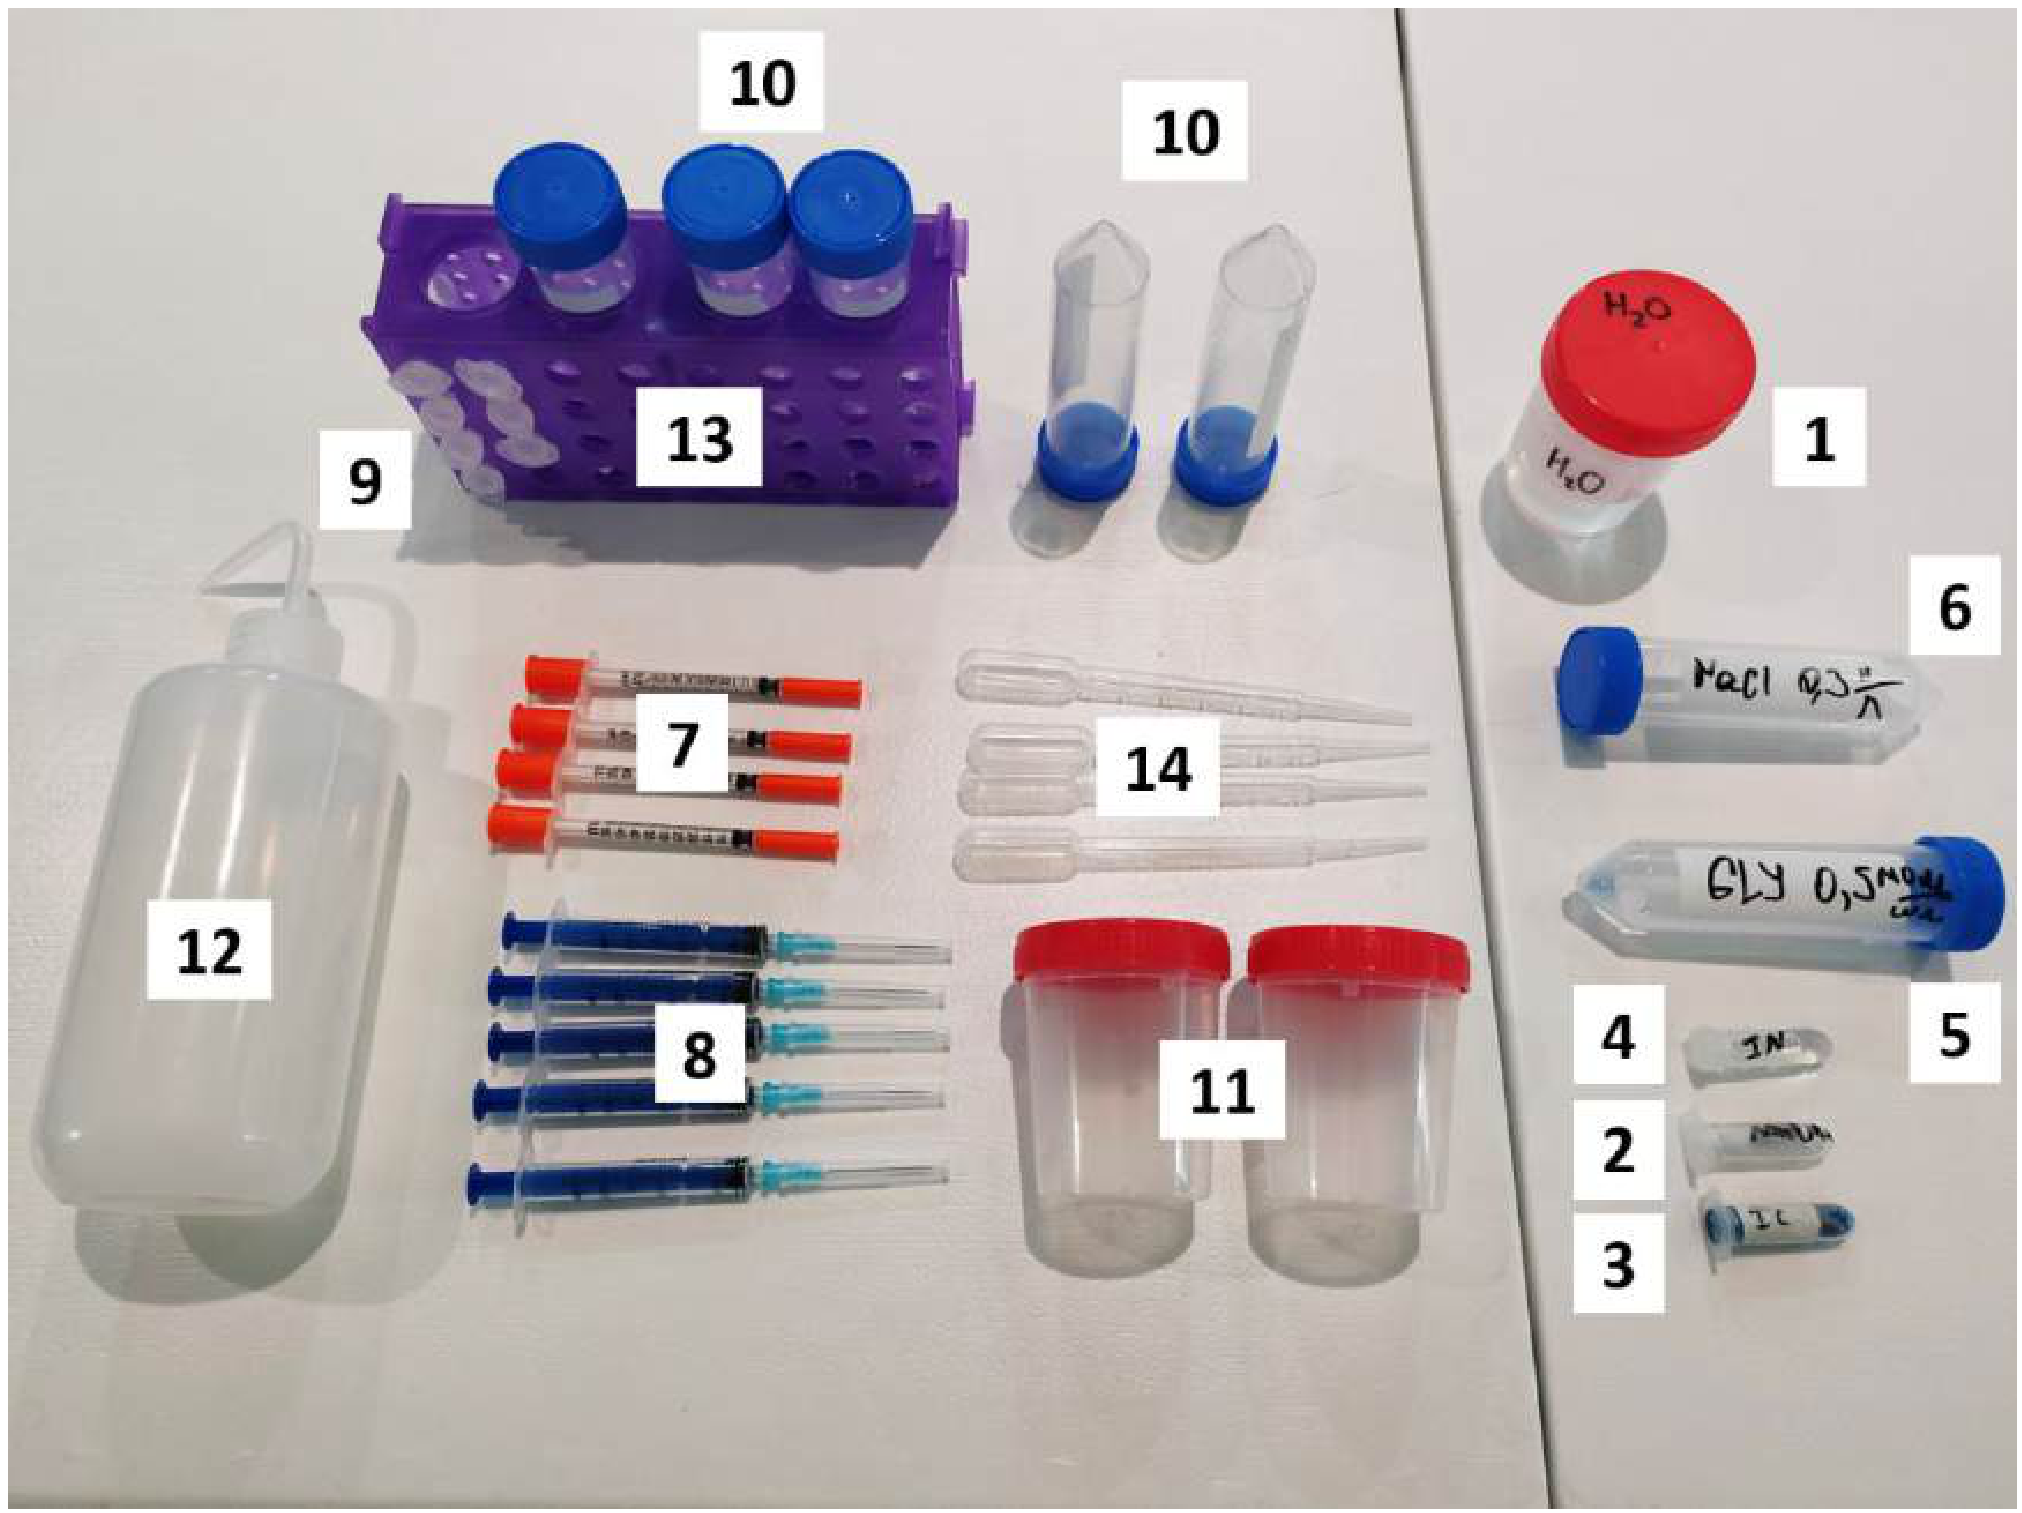
- Distilled water HO.
- Solid NaOH granules. The total mass of the provided NaOH is indicated on the microtube in grams.
- Indigo carmine IC solution with concentration 0.70 mg/ml in a microtube.
- Phenolphthalein In solution in a microtube.
- Glucose Gl solution in a conical tube with concentration 0.50 mol/l.
- Sodium chloride NaCl solution with concentration 0.30 mol/l in a conical tube.
- Insulin syringe 0.50 ml - 4 pcs.
- Syringe 3 ml - 5 pcs.
- Microtube 2 ml with graduations - 7 pcs.
- Conical tube 50 ml - 5 pcs.
- Container 100 ml with screw cap - 2 pcs.
- Wash bottle 500 ml.
- Test tube rack.
- Pasteur pipette - 5 pcs.
Equipment (other)
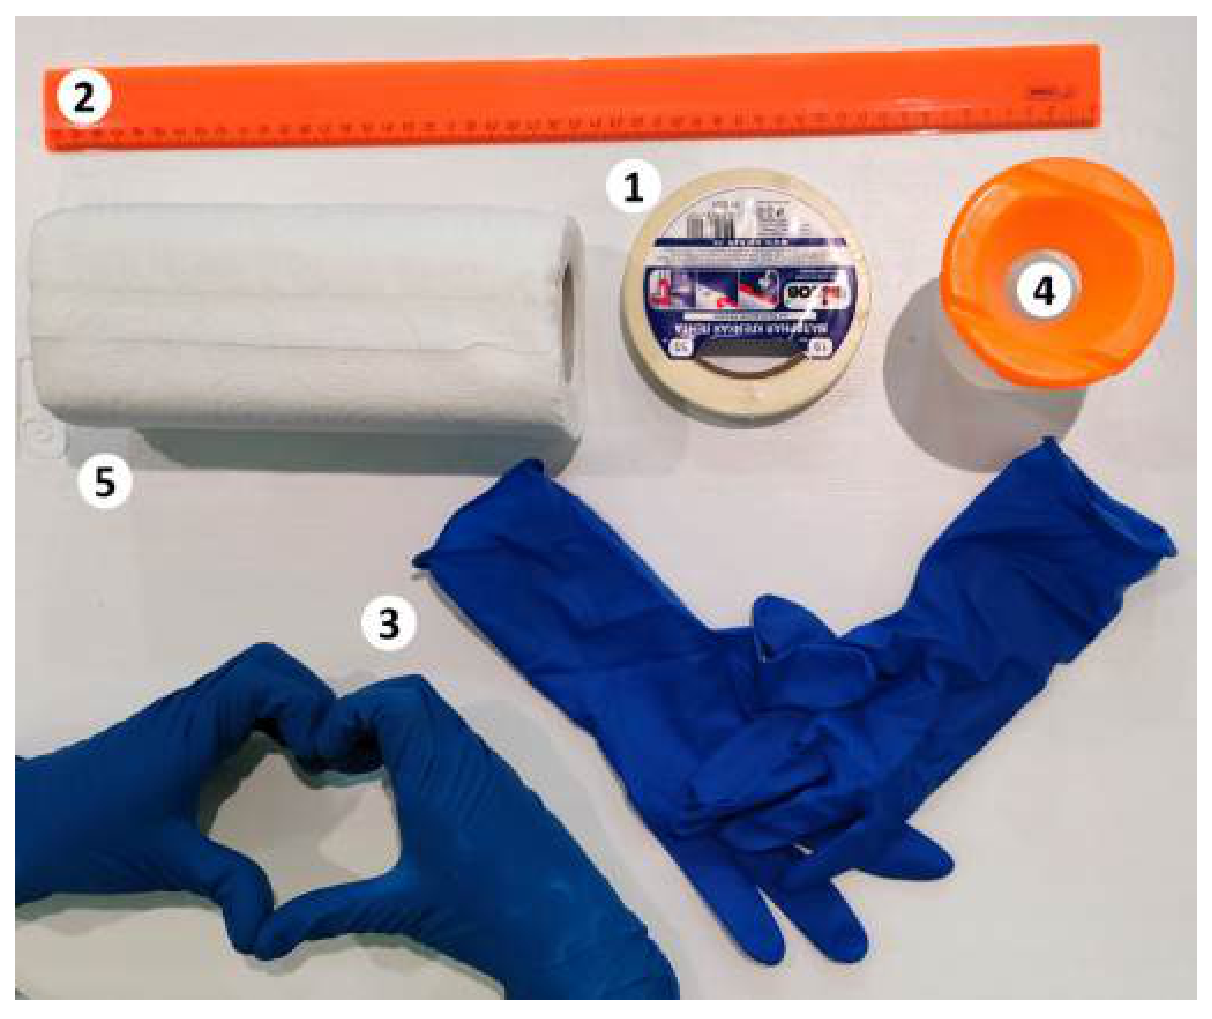
- Masking tape.
- Ruler 50 cm plastic.
- Pair of gloves.
- Container for used reagents.
- Wipes.
- Sunshield (shown in the extra image)
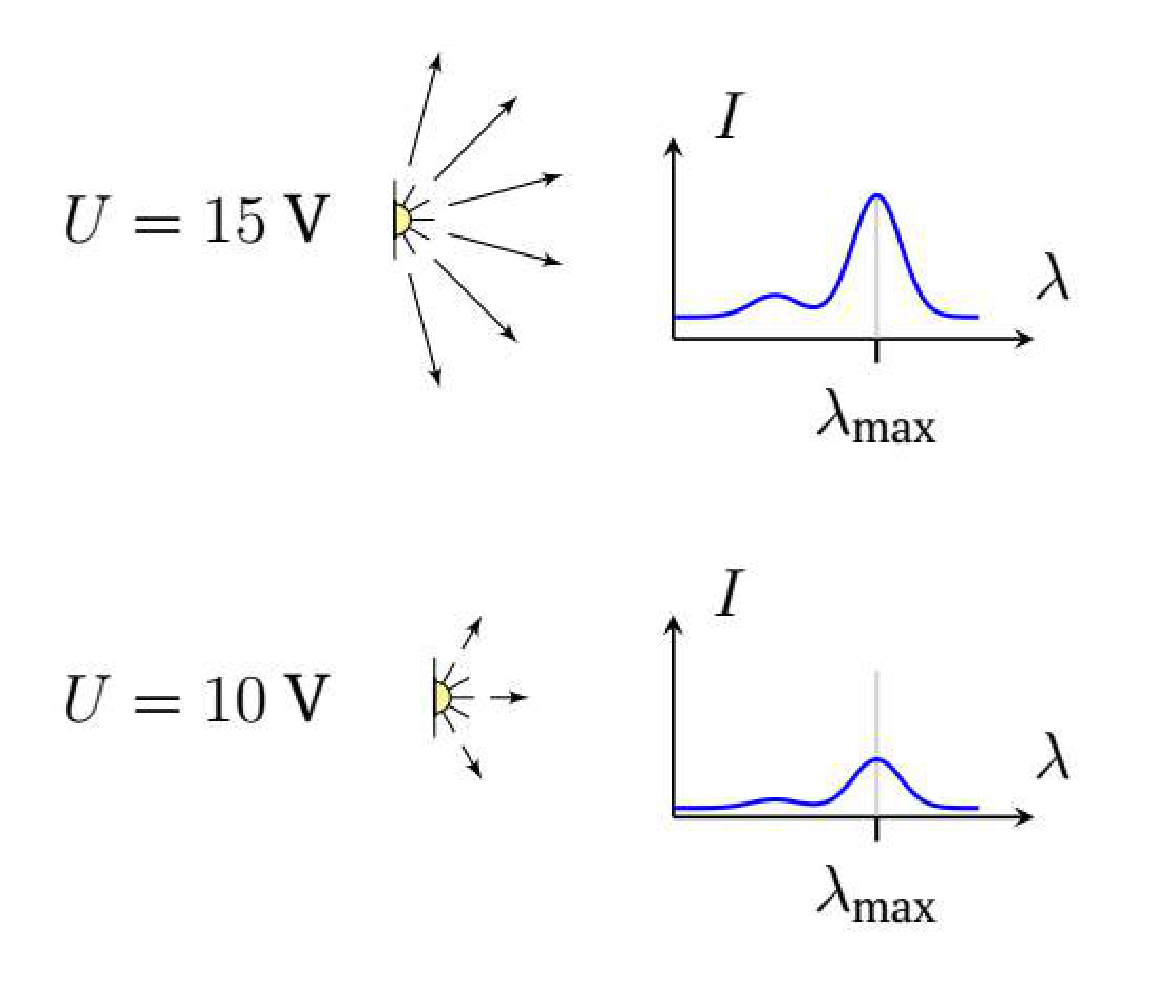
Note. Each of the light sources can be supplied with a voltage in the range V. Assume that when the voltage on the light source changes, its total light intensity changes, but the spectrum remains the same (see figure).
Attention! You are provided with three instructions that you should read before starting work:
- Instructions for electrical equipment.
- Instructions for chemical equipment.
- Instructions for the Spectroscopy.bat program.
Note. A mole of a substance is the amount of a substance containing molecules. The molar mass is the mass of one mole of the substance. The required molar masses are listed below. The molar concentration is the number of moles of a substance in a unit volume (its unit is mol/l).
| Substance | , g/mol |
|---|---|
| NaOH | 40.0 |
| IC | 466.4 |
| Gl | 180.0 |
| NaCl | 58.4 |
Note. It’s strongly recommended to use a separate container for each solution (including separate syringes and pipettes). If you need to label a container, stick masking tape on it and make the necessary markings on the tape. If necessary, wash the used tubes with a wash bottle.
On the desktop of your computer, there is a folder ”Results” with subfolders ”Part A”, ”Part B”, ”Part C”, ”Part D”, ”Recalibrate”. Save all files obtained during the work in the corresponding folders. Also, in the ”Results” folder, there is a ”Report.docx” file with a table. Save all graphs that are explicitly required to this table. You can also optionally add any other graphs to the report in the rows corresponding to the question items.
Error estimation is not required in the problem!
Part A. Calibration
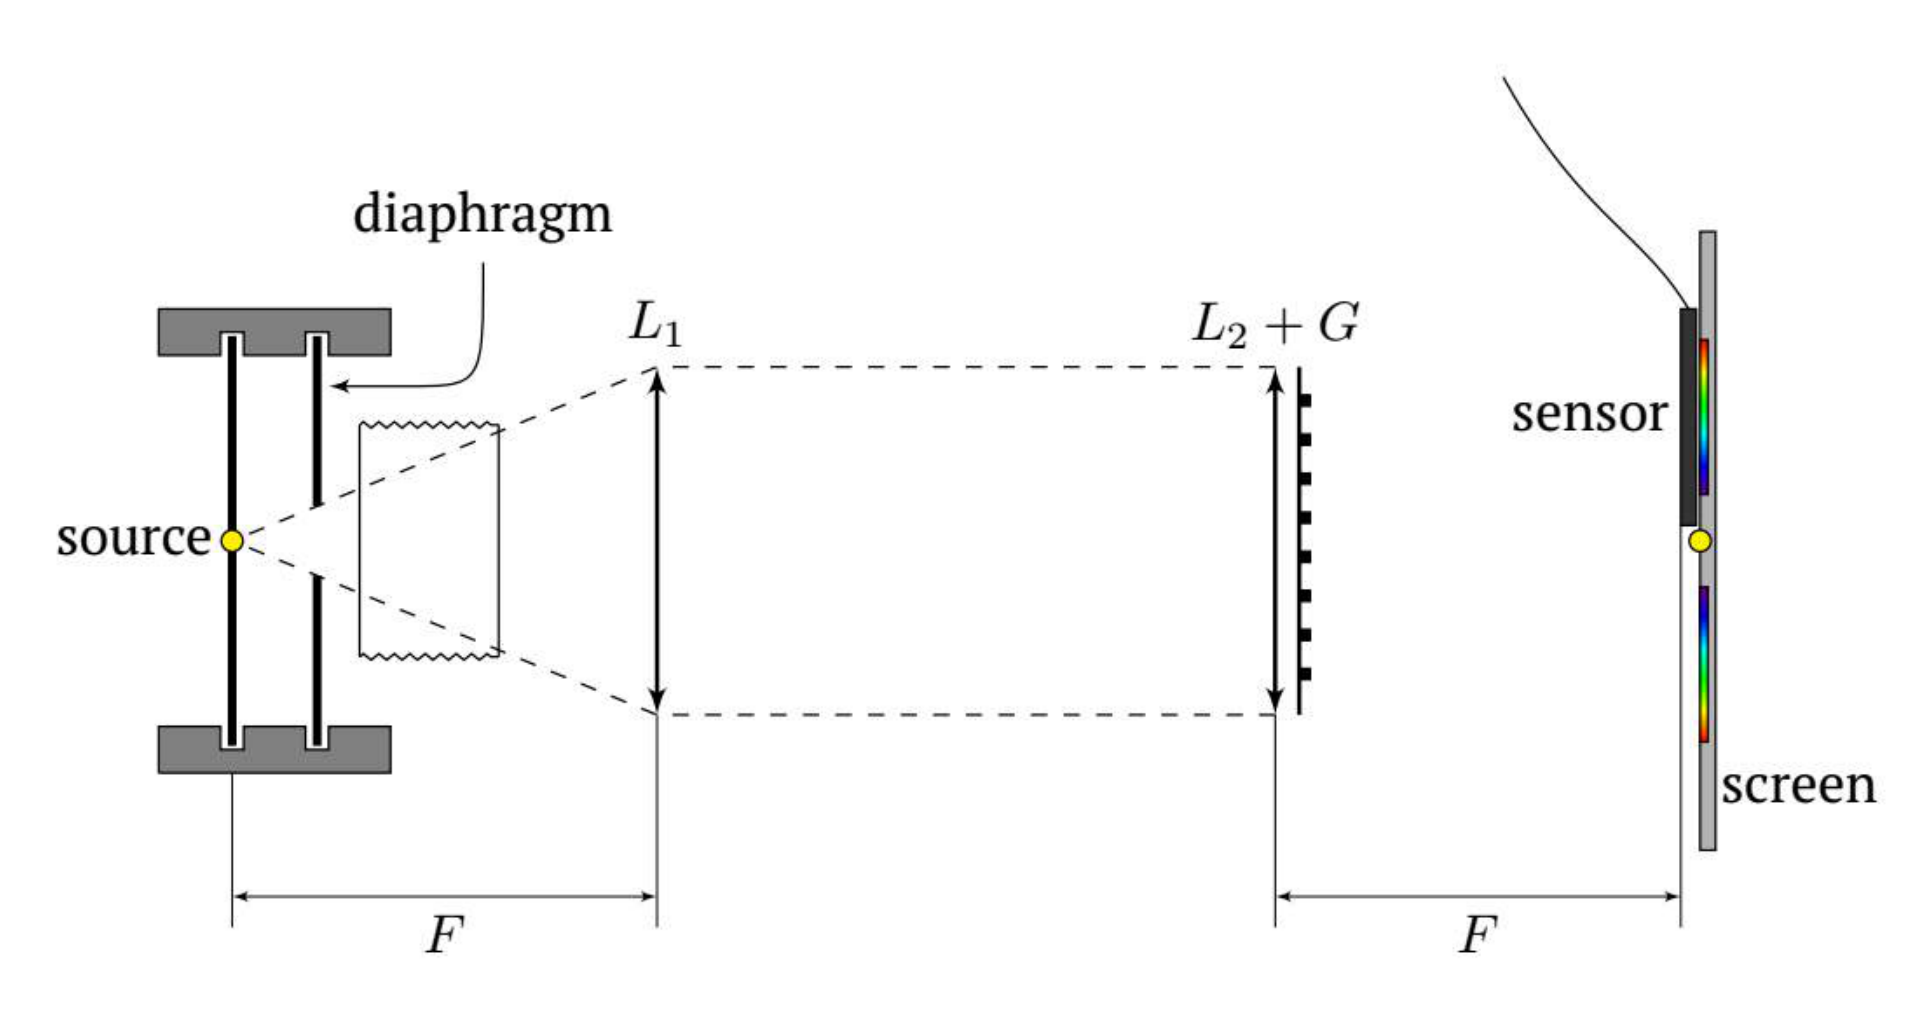
This part of the task requires assembling the optical setup according to the schematic (it is shown below) and calibrating the sensor.
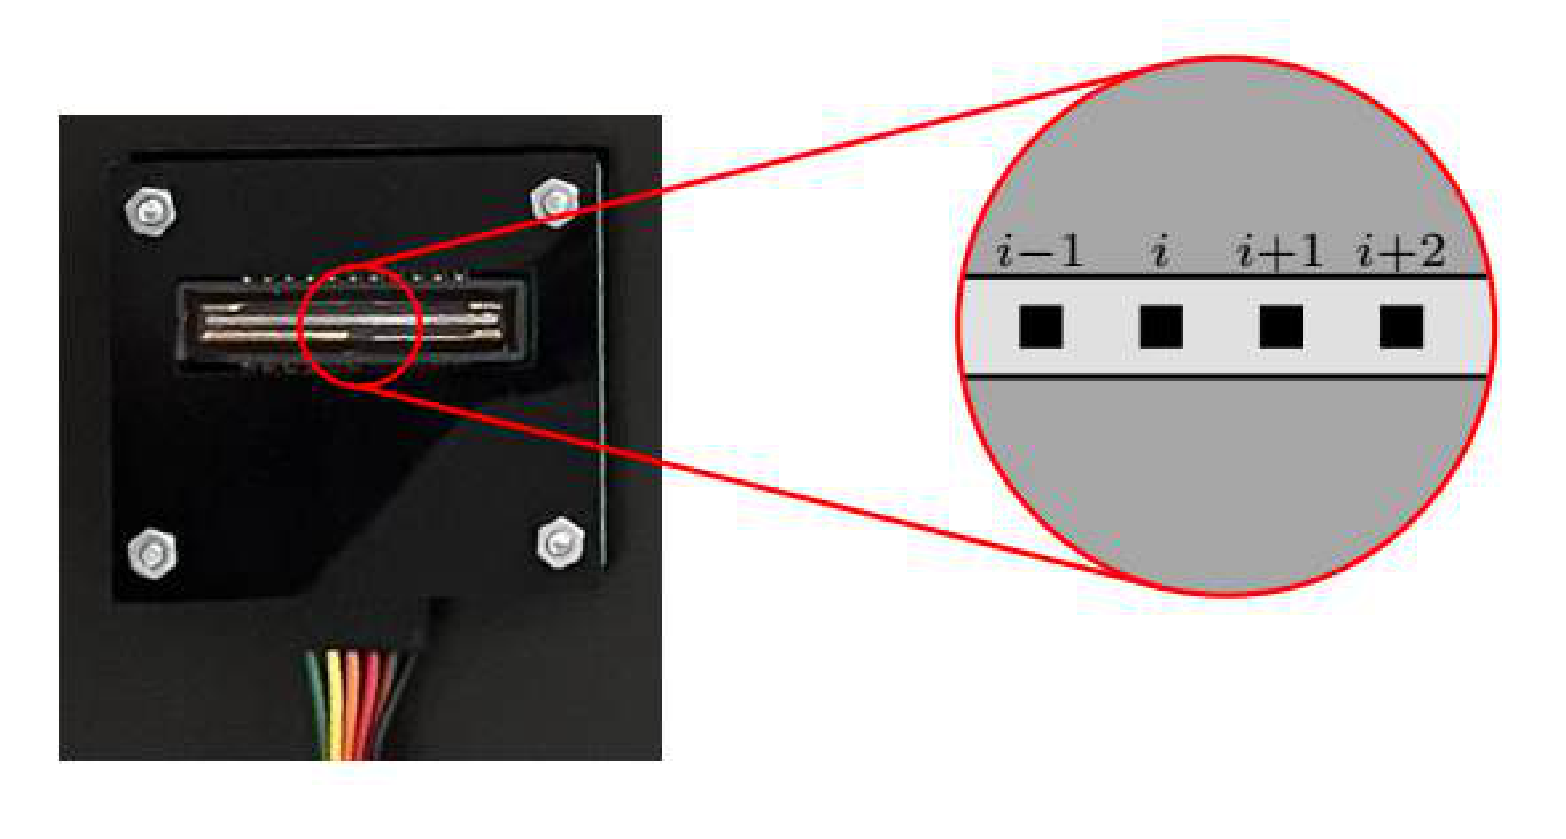
The photosensitive part of the sensor consists of about 3650 of identical photodiodes called pixels (see Fig.). A computer program processes the data from the sensor and the result is the dependence of the illumination intensity of each pixel on its number. The intensity is measured by the sensor in arbitrary units.
The light of any real source consists of a continuous set of components of different wavelengths, called the emission spectrum. With the proposed optical scheme it is possible to ”separate” the components of the spectrum spatially. In this way, it can be achieved that each pixel of the sensor receives almost monochromatic radiation. Calibration consists in matching the pixel number with its corresponding wavelength. After calibration, do not perform any operations on the setup other than inserting and removing the light source, the cuvette and the diaphragm. Moving other elements of the setup will cause the calibration to fail and the calibration must be repeated! Note that connecting wires to the light source while it is in the holder will also cause the calibration to fail. Assemble the setup so that the light source is in the focus of the first lens . Place the screen with the sensor attached to it approximately in the focus of the second lens . Place a cuvette with clean water in the holder.
Warning! Any light whose spectrum you are studying in this exercise must pass through the plane (not grooved) edges of the cuvette. Use the LED-CON as the light source. By slightly changing the position of the second lens and the sensor, achieve a clear diffraction pattern (” multicolored strip”) on the sensitive part of the sensor.
A1 Save the obtained spectrum in the file ”LED-CON.csv”.
A2 Turn off the LED-CON and obtain the background spectrum. Save the result in the file ”dark-A.csv”.
A3 Change the source to LED-RGB and get the spectra of all three LEDs. Save the results in files ”R-0.csv” ”G-0.csv” and ”B-0.csv” (R – red, G – green, B – blue).
Each LED-RGB LED emits at maximum intensity at a certain wavelength . The values of values for all LED-RGB LEDs are shown in the table below.
| LED color | , nm |
|---|---|
| Red | 620 |
| Green | 520 |
| Blue | 460 |
In the assembled optical setup, the wavelength of light corresponding to the sensor pixel with number depends linearly on :
A4 Using the results of A3, find the values of pixel numbers corresponding to . Calculate the parameters and .
A5 Change the source to LED-UNK, obtain its spectrum and save the result in the file ”unk.csv”. Find for this LED.
For all other parts, use only LED-CON as the light source.
If you change the position of any element of the setup while solving further tasks, you will need to recalibrate. When you run the calibration for the -th time, be sure to save the spectra ”R-.csv”, ”G-.csv”, ”B-.csv” in the ”Recalibrate” folder and find the values of and . Also in the ”Calibration.docx” file, in the table, indicate which questions are made with the calibration number ! By default it is assumed that all questions are made with the original calibration.
Part B. Beer–Lambert law
To describe the adsorption of light by matter, the Beer–Lambert law is used: the intensity of each monochromatic component of the light decays exponentially with the path in the matter:
where is the intensity of light of wavelength incident on the matter, is the intensity of light passed the distance through the matter, is some coefficient depending on the wavelength.
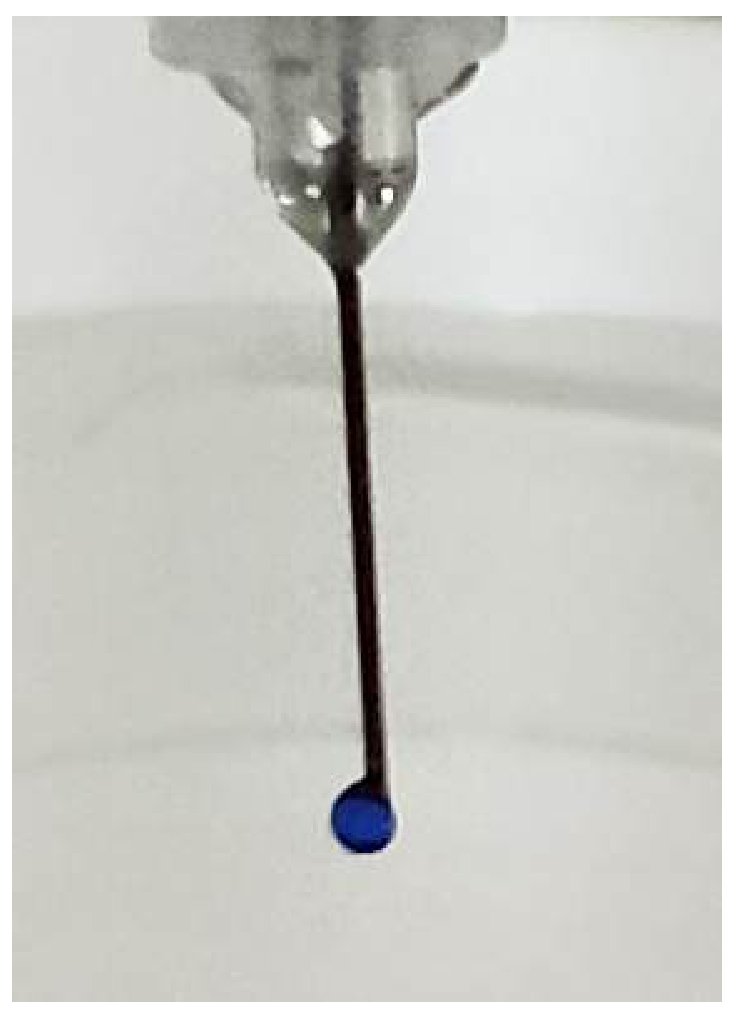
In this part we will study the adsorption of light of different wavelengths by indigo carmine IC. You have been provided a solution of IC with a concentration 0.70 mg/ml. You will need to get the droplets of IC solution with the same and known volume. If we hold the syringe with the volume 0.5 ml vertically and push the piston smoothly, the droplet will appear on the tip of the needle. This droplets comes off the needle after reaching some critical
Use a 0.5 ml syringe to obtain drops.
B1 Determine the average volume of drops of the solution IC formed when it is squeezed through the needle of the syringe.
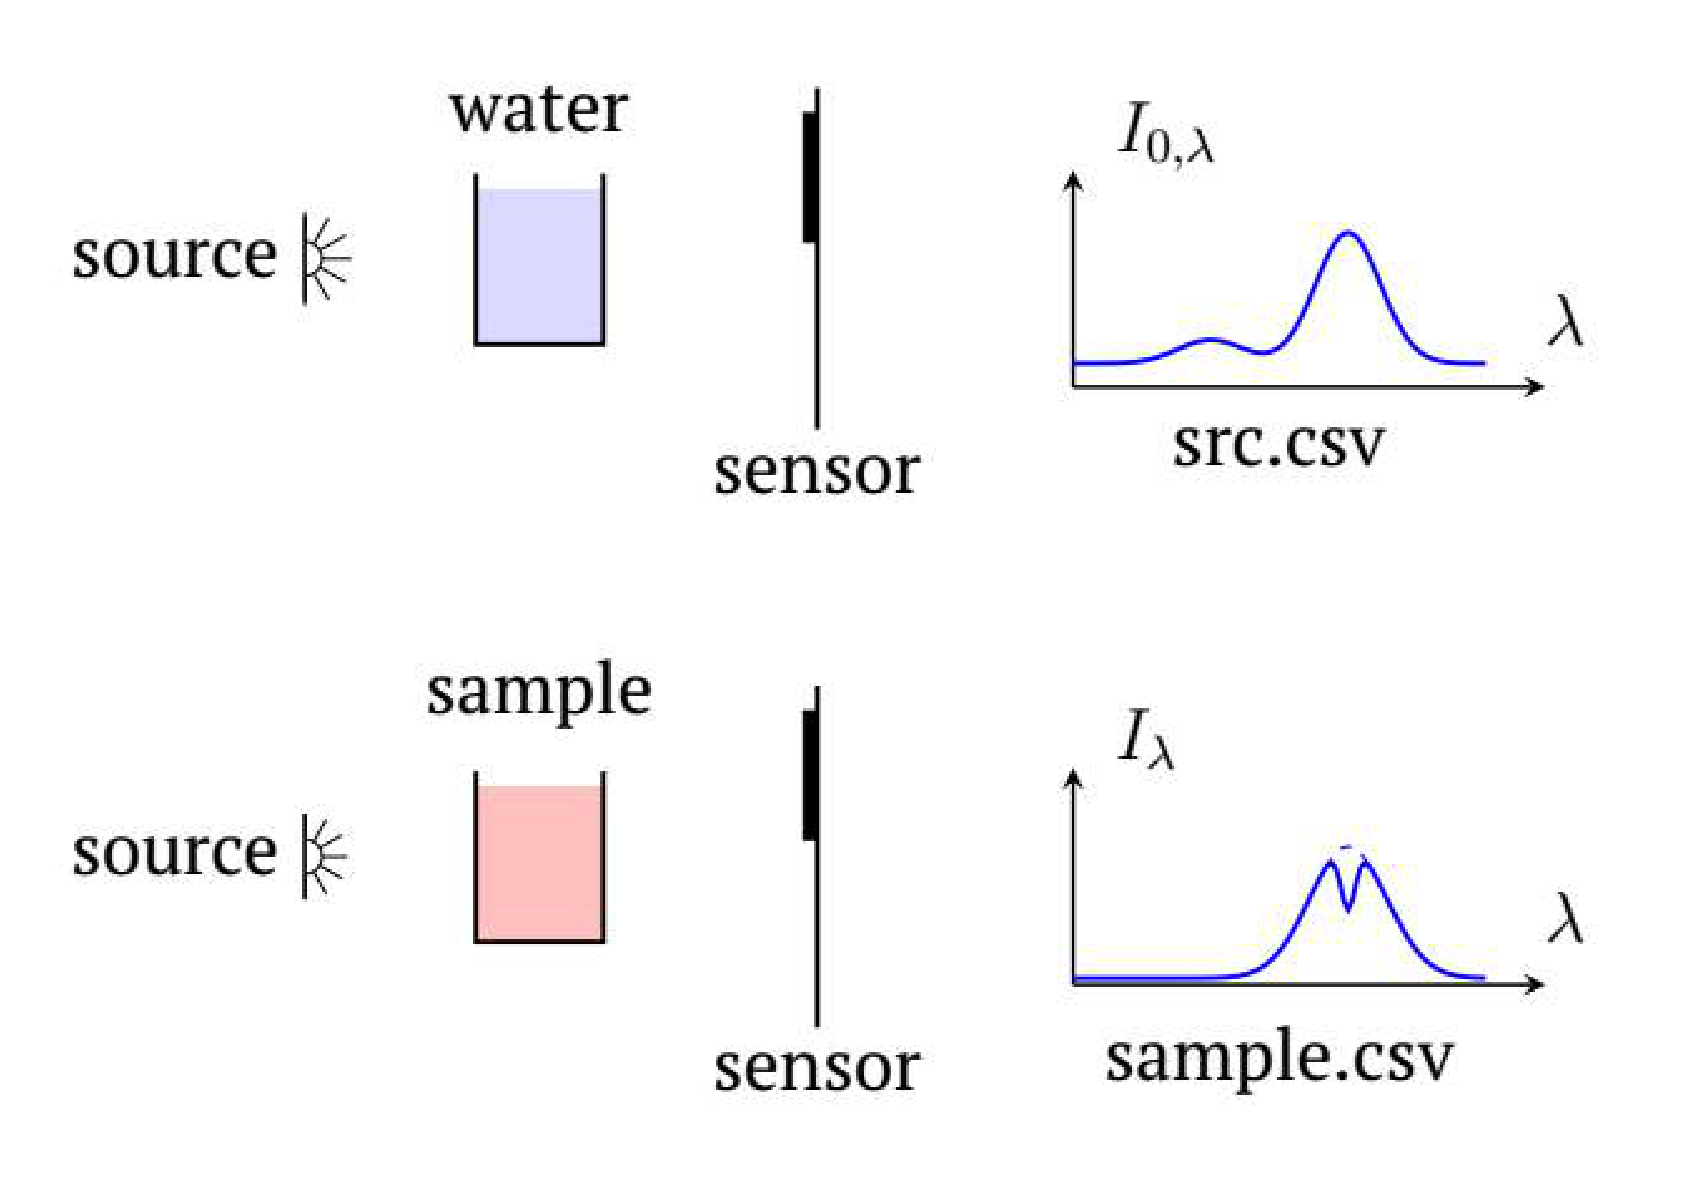
The values and cannot be measured directly due to light reflections at the air-cuvette, cuvette-water boundaries and other factors. However, it can be assumed with a high degree of accuracy, that their ratio is equal to the ratio of the intensity of light that passed through the cuvette containing the solution to the intensity of light that passed through the cuvette containing pure water.
B2 Put 3.0 ml of water into the cuvette. Adjust the optimum voltage of LED-CON and Sensitivity. Measure the spectrum of the LED-CON light that passed through the cuvette with water and save the result in the ”src-B.csv” file. Also measure background spectrum and save it in the file ”dark-B.csv”.
For future measurements in this part do not change the voltage and Sensitivity!
Note. If there are bubbles on the walls of the cuvette, remove them.
Measurements can only be made with acceptable accuracy in the wavelength range where the intensity of the source radiation is greater than 5% of the maximum.
B3 Based on experimental data, indicate the wavelength range in which the dependence can be obtained with acceptable accuracy at your setup.
B4 By adding two drops of IC at a time to the cuvette, obtain the intensity spectra of the light passing through the solution for 10 different concentrations of IC. Save the results as multiple ”IC-.csv” files, where is the number of drops of IC added to the cuvette.
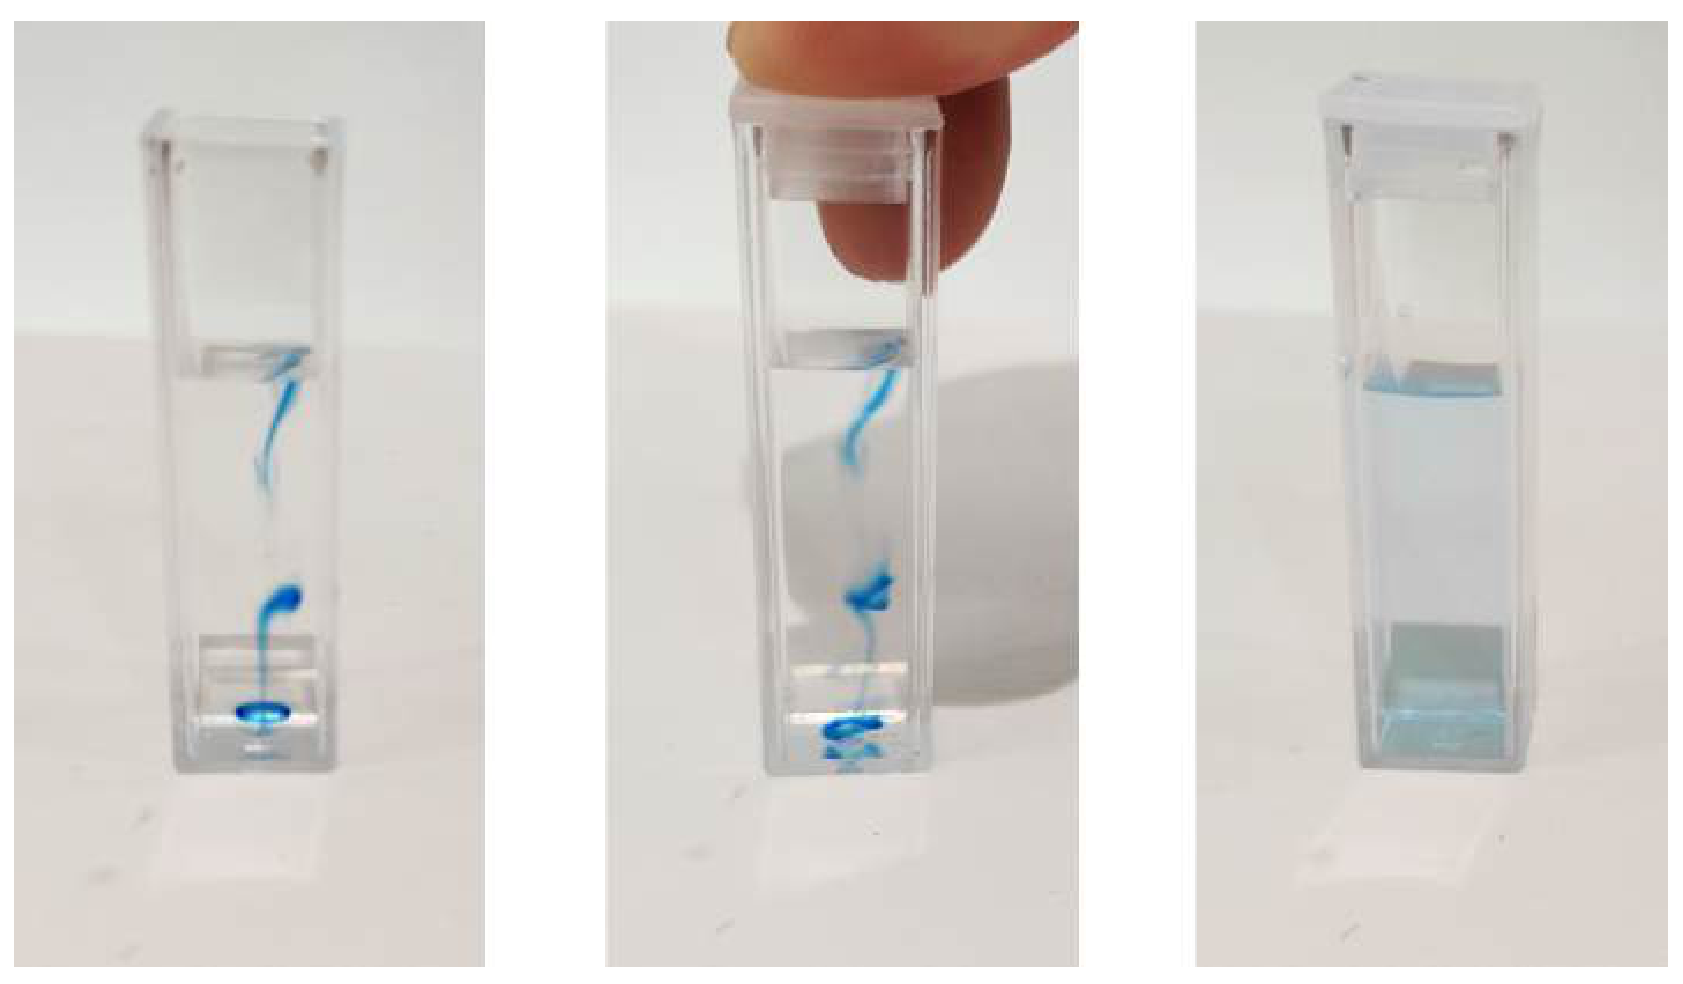
Note. Here and hereafter, after adding the test substance to the water, the solution should be stirred until it becomes homogeneous. If there are bubbles on the walls of the cuvette, remove them.
Let us describe the absorption of light theoretically.
Let a solution of the investigated substance in a cuvette be illuminated by a parallel beam of monochromatic radiation with wavelength . The distance between the smooth inner walls of the cuvette is cm. The concentration of the solution (the number of molecules of a substance per unit volume) is (measured in 1/m).
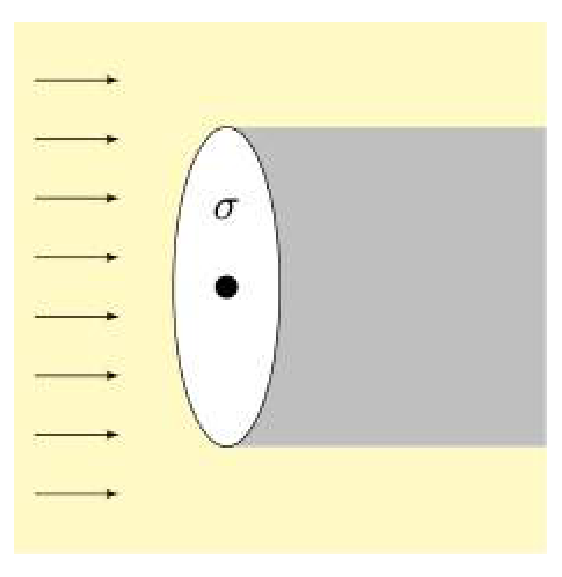
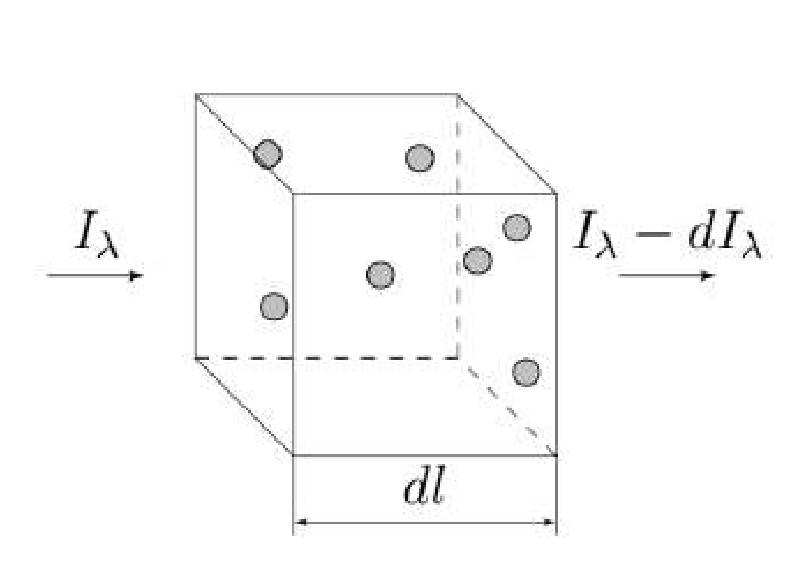
Light is absorbed due to interaction with individual molecules of the substance under investigation. Let us determine the absorption cross section of a molecule , which has the dimension of area. Consider a circle of area centered on the center of the molecule. The plane of the circle is perpendicular to the direction of propagation of the light beam. Assume that all light hitting the circle is completely absorbed by the molecule (see figure).
The absorption cross section is different for different wavelengths, i.e., it is a function of the wavelength of the light .
Let a light of intensity incident on a thin layer of substance of thickness . After the light passes through the layer, the intensity decreases by .
B5 Express using the concentration of molecules of substance , , , .
B6 Express if the light intensity decreases from to as it passes through a layer of matter with thickness . Express the answer in terms of , , and .
Note. If you didn’t get an expression for , you can investigate the dependency instead of everywhere else. is defined at the beginning of this part.
B7 Plot the dependence graph for at least 10 different wavelengths from the range found in question B6. Save the data for the graph as a table ”IC-result.csv” in the ”Part B” folder. Save the graph of this dependence in the ”Report.docx” document in the line ”IC-result”.
B8 Find – the wavelength of light that is absorbed the most by IC.
Part C. Phenolphthalein
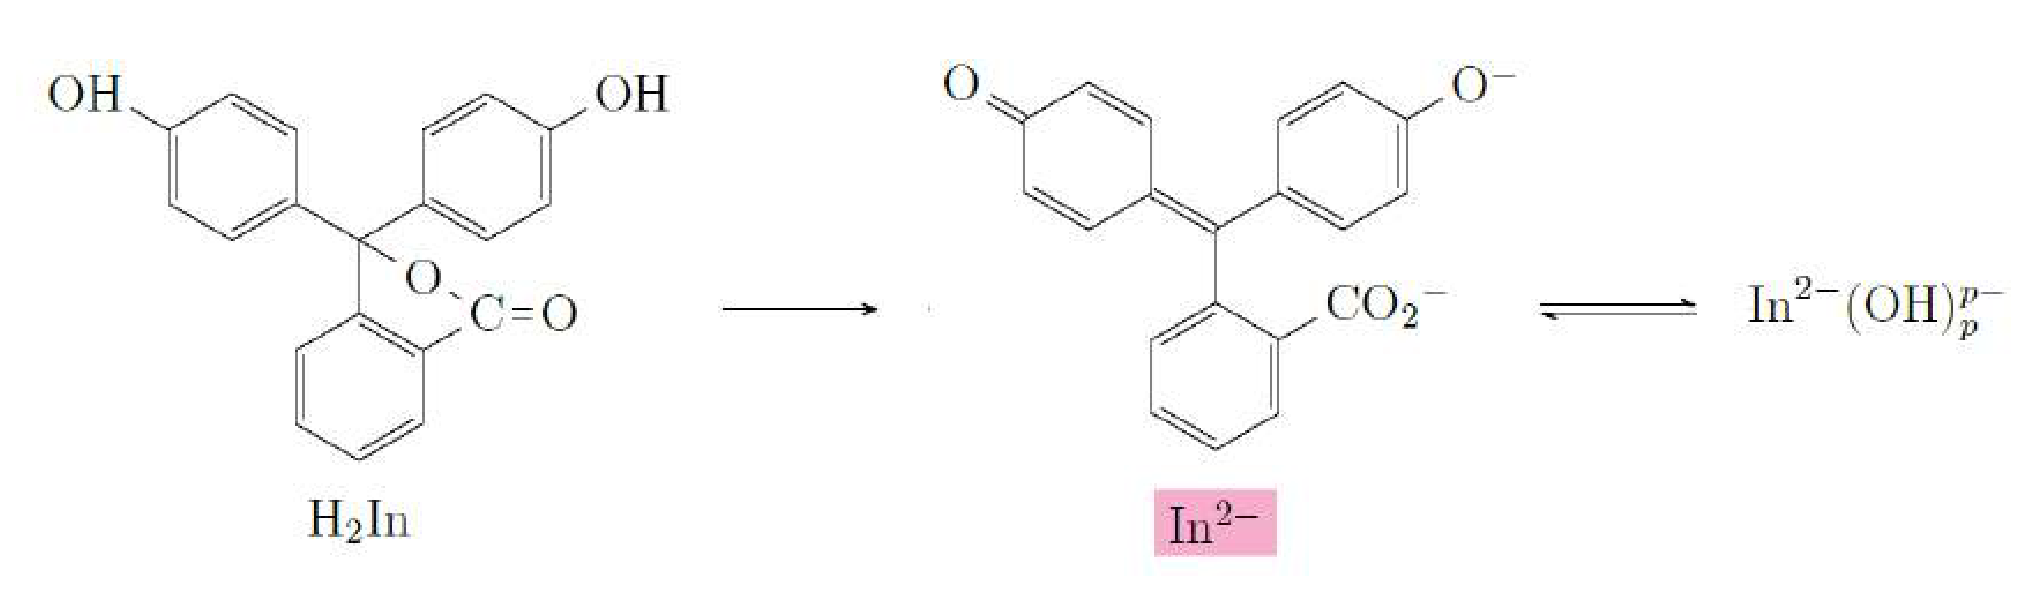
Phenolphthalein is an organic dye that changes its color in an alkaline environment, therefore it is used as an acidity pH indicator. In an alkaline environment, the phenolphthalein molecule can exist in the following states:
- ;
- ;
- .
In the last of them is a natural number (). Only one of these states () has a typical pink color, the others are colorless.
There are two reactions corresponding to the transitions between the indicated states of the molecules:
”Double arrow” in the second reaction means that the reaction can go both forward and backward. The first reaction is quite fast (phenolphthalein is instantly colored in an alkaline medium), and the second reaction is relatively slow. In this part of the problem it is required to calculate by investigating the kinetics of the second reaction.
Ionic strength of a solution is the value determined by the formula:
Here summation is done over all types of ions in solution, is a concentration of ions of a particular type , is a charge number of a corresponding ion (it’s a ratio of ion charge to elementary charge C).
Rate of a chemical reaction is the number of elementary reactions occurring per unit time (measured in 1/s). The rate of each reaction depends on many factors, including the concentrations of the reagents at each time and the ionic strength of the solution.
Let us discuss the dependence of the rate of a chemical reaction on the concentrations of the reacting components. Consider a decomposition reaction in which a complex reagent is decomposed into simple reagents A and B:
According to the theory, the rate of this reaction is proportional to the concentration in the solution:
The reverse reaction (composition) is also possible:
According to the theory, the reaction rate of the composition is proportional to a power expression of the concentrations of the respective substances , :
In this part it is required to investigate the dependence of the reaction rate on the concentration of ions , keeping the ionic strength of the solution constant. To satisfy the last requirement, we will also use table salt NaCl solution. We will assume that NaOH and NaCl dissociate completely in water, i.e. they decompose into ions according to the reactions:
Note. Under the conditions of the experiment, it is possible to assume that the concentrations of all states of In are much smaller than the concentrations of other ions and substances. Therefore, you can assume that the concentration of ions does not change much during the reactions. You can also neglect the contribution of all the ionic states of In to the ionic strength of the solution.
C1 Calculate the ionic strength of the NaOH solution, the concentration of which is mol/l.
C2 Let us consider the mixture of three components:
- NaOH solution, concentration , volume ;
- NaCl solution, concentration , volume ;
- Distilled water, volume .
Obtain the relationship between , , , , which gives the ionic strength of the solution.
Further it will be necessary to prepare solutions with different concentrations of ions, but with the same ionic strength . For this purpose it’s convenient to use when solutions of NaOH and NaCl with the same concentration mol/l are used.
C3 Let us consider the mixture of three components:
- NaOH solution, concentration , volume ;
- NaCl solution, concentration , volume ;
- Distilled water, volume .
Obtain the relationship between , , , which gives the ionic strength of the solution.
Before operating with NaOH reread the warning at the beginning of the problem text.
Prepare the NaOH solution with the concentration mol/l using the given grains.
C4 Prepare 5 solutions with different concentrations of ions in different optical cuvettes. The ionic strength of all the solutions has to be the same and equal to . Label all the cuvettes to make sure that you don’t mix them up.
Place one of the cuvettes in the holder. Adjust the optimal LED-CON voltage and Sensitivity. Measure the spectrum of the LED-CON light that has passed through the cuvette and save it in the file ”src-C.csv”. Do not change the LED-CON voltage and Sensitivity in future measurements in this part!
Obtain the background spectrum and save it in the file ”dark-C.csv”.
Next, you will study the dependence of the spectrum of the light passed through the cuvette with the solution over time after some In has been added. There is the order of experiment for each solution:
- Measure the background and save it in ”dark-OH-.csv”, where is the concentration of ions in the solution in mol/l units
- Add two droplets of In to the optical cuvette with insulin syringe (syringe’s volume is 0.5 ml).
- Stir to homogenize the contents of the cuvette.
- Place the cuvette in the holder.
- Start the spectrum measurements (”Time series”).
- Conduct measurements during 5-10 minutes.
- Save the results in ”In-OH-.csv”, where is the concentration of ions in the solution in mol/l units.
C5 Conduct measurements according to the instructions above for all five solutions prepared in the cuvettes.
C6 Based on the experimental data, determine which light wavelength is most strongly absorbed by phenolphthalein.
The absolute value of phenolphthalein concentration (measured in 1/m) cannot be determined from the data obtained. However, the time dependence of the relative change of concentration is enough for further calculations. This means that you can express the required concentration in any arbitrary units.
C7 Plot the graphs of the concentration of versus time. Save your graphs on the lines ”C-OH--t” in the file ”Report.docx”, where is the concentration of ions in your solution expressed in mol/l.
C8 Plot the graphs of the reaction rate (it can be expressed in any convenient arbitrary units identical for all concentrations) versus In concentration for all optical cuvettes. Save your graphs on the lines ”C-OH--r” in the file ”Report.docx”, where is the concentration of ions in your solution expressed in mol/l.
Note. The next question C9 can be solved without solving question C8.
C9 Using the experimental data obtained, determine the value of ( is defined at the beginning of this part).
Part D. Chemical traffic light
As you observed in part B, indigo carmine IC is blue in pure water. However, if we add some IC to the solution of glucose Gl with ions , the solution will be green at the beginning and will change color later. This behavior is a consequence of the chemical reactions present in the mixture.
Use the solution of NaOH prepared in part C.
In an optical cuvette prepare the solution in which the concentration of NaOH is 0.15 mol/l and the concentration of Gl is 0.25 mol/l.
D1
| Color | Green/ Blue-green | Yellow | Red/Orange | Purple |
|---|---|---|---|---|
| Number | 1 | |||
| , s | 0.0 |
D2 Prepare a new solution of NaOH and Gl in an optical cuvette and place the cuvette in the holder. Find the optimal voltage on LED-CON and Sensitivity. Obtain the spectrum of the LED-CON light passing through the cuvette and save it in ”src-D.csv”. Don’t change the voltage and Sensitivity during the next questions of this part! Obtain the spectrum of the background and save it in ”dark-D.csv”.
After adding 0.15 ml of indigo carmine IC obtain the dependence of the spectrum of the light passing through the solution over time and save the obtained data to the file ”IC-1.csv”. ”Restart” the reaction and save the obtained data to ”IC-2.csv”.
D3 Calculate four spectrums of for the moments when each of the four colors appears brightest. Save the result in ”IC--result.csv”, where - is the order number of the color.
Plot each and save the graph in ”Report.docx” in rows ”IC--beta”, where - is the order number of the color.
D4 Study the change in the spectrum over time and find the number of different states of the molecules that are present during chemical reactions in visible wavelengths. There are no transparent (colorless) states of the IC molecules in visible light.
D5 Plot the dependence of the concentrations of each state of the molecule IC over time on the single graph. Save the result in the ”Report.docx” file in the ”IC-t” row.
Отговори
Part A. Calibration, A4 k0 = −0.0752 nm, λ0 = 671 nm
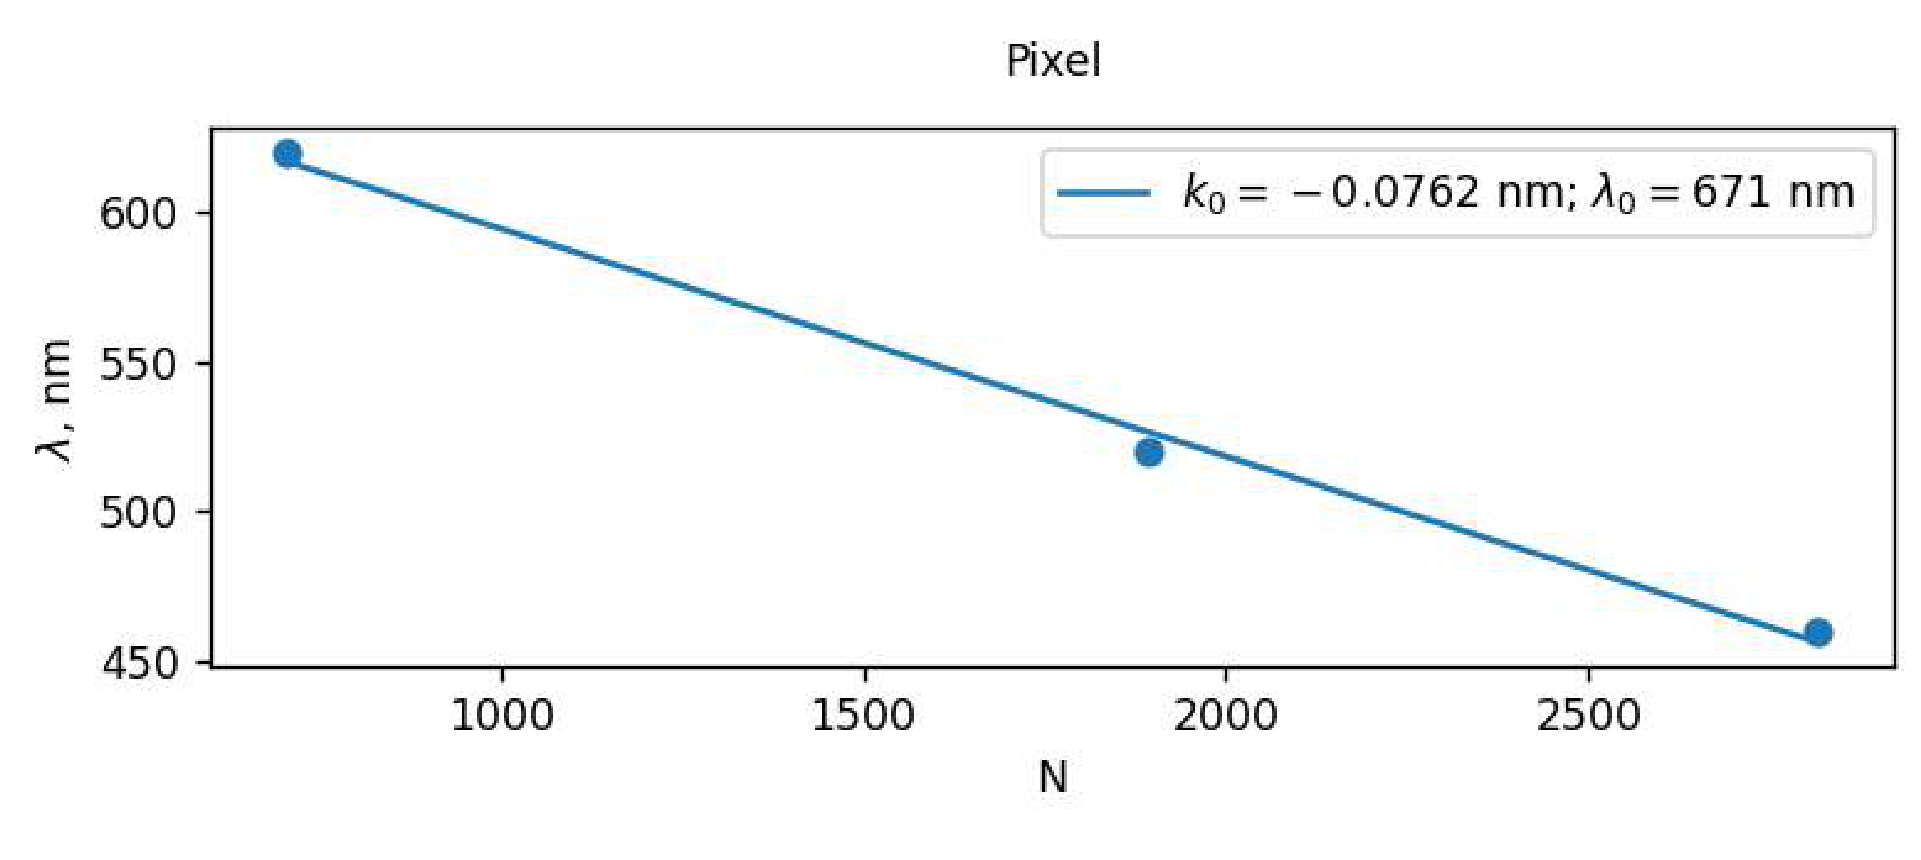
Setup-dependent typical values from the official solution. The boxed answer prints k0 = −0.0752 nm, while the legend of the fit graph shows k0 = −0.0762 nm; the unit of k0 is printed as nm (nm per pixel is meant).
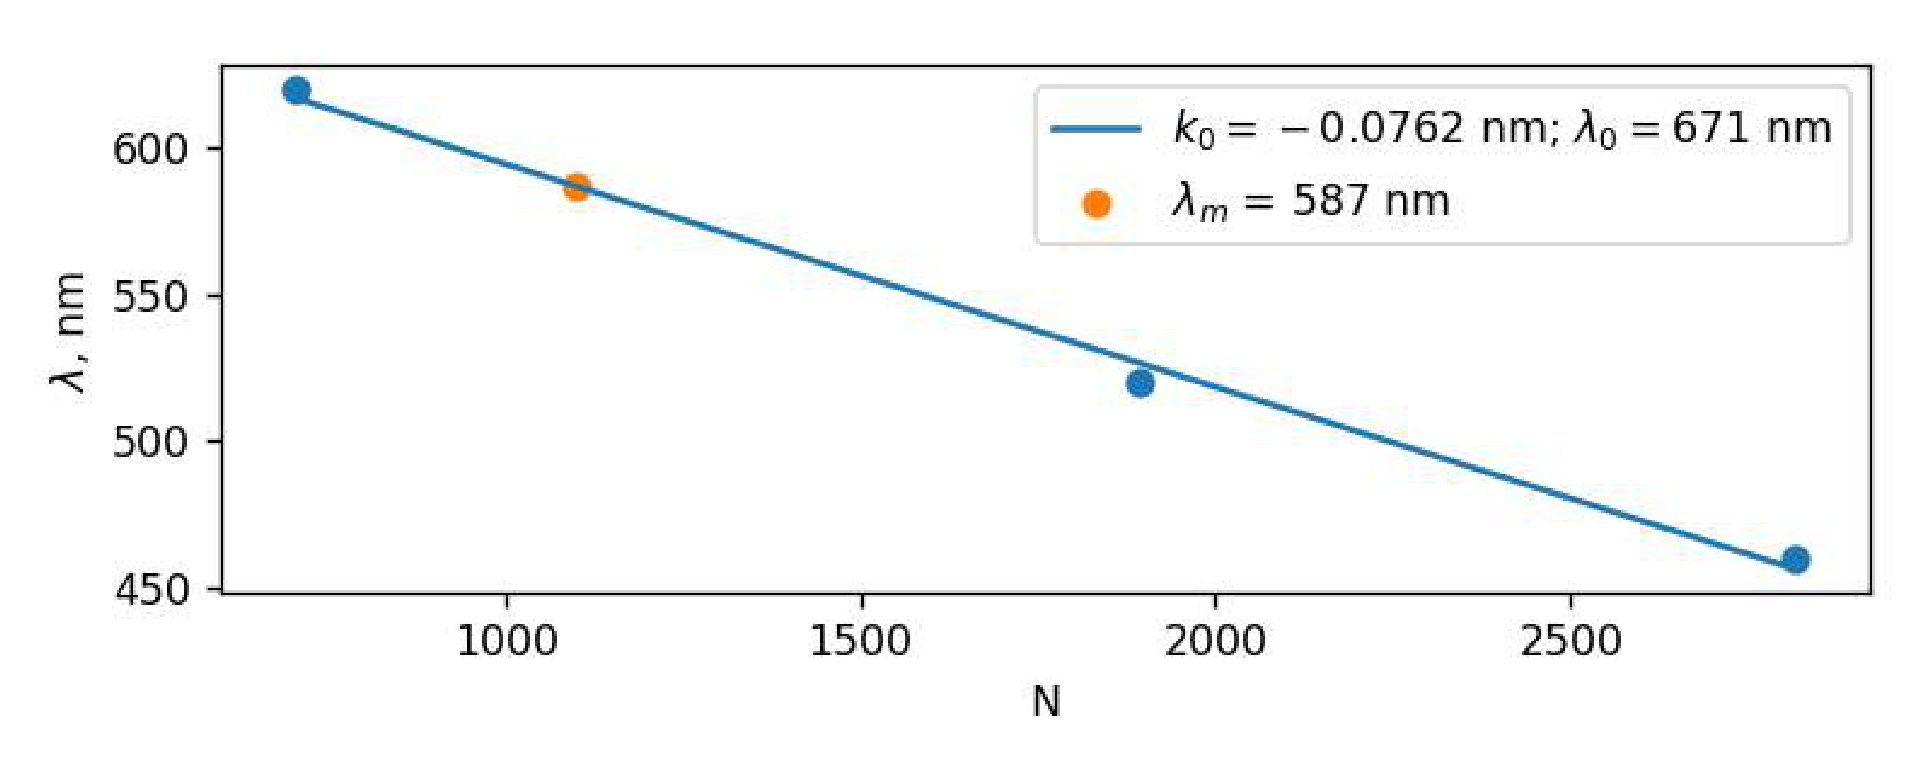
Part A. Calibration, A5 587 nm
Typical value from the official solution.
Part B. Beer–Lambert law, B1 5 µl
Typical value from the official solution; it varies from syringe to syringe.
Part B. Beer–Lambert law, B3 λ ∈ [420 nm; 640 nm]
Setup-dependent typical range from the official solution.
Part B. Beer–Lambert law, B5
As printed in the official solution; dIλ denotes the decrease of intensity.
Part B. Beer–Lambert law, B6
Part B. Beer–Lambert law, B8 590 nm
Typical value from the official solution.
Part C. Phenolphthalein, C1 m⁻³
Part C. Phenolphthalein, C2
Part C. Phenolphthalein, C3 Vw = 0, VNaCl, VNaOH – arbitrary
Part C. Phenolphthalein, C6 550 nm
Typical value from the official solution.
Part C. Phenolphthalein, C9 1
The official solution obtains a slope of 1.1 and, since p is an integer, p = 1.
Part D. Chemical traffic light, D1 Green/Blue-green — 1, 0.0 s; Violet (Purple) — 2, 40 s; Red/Orange — 3, 60 s; Yellow — 4, 200+ s
Typical order and times from the official solution; times depend on the setup.
Part D. Chemical traffic light, D4 3
Решение
Part A. Calibration
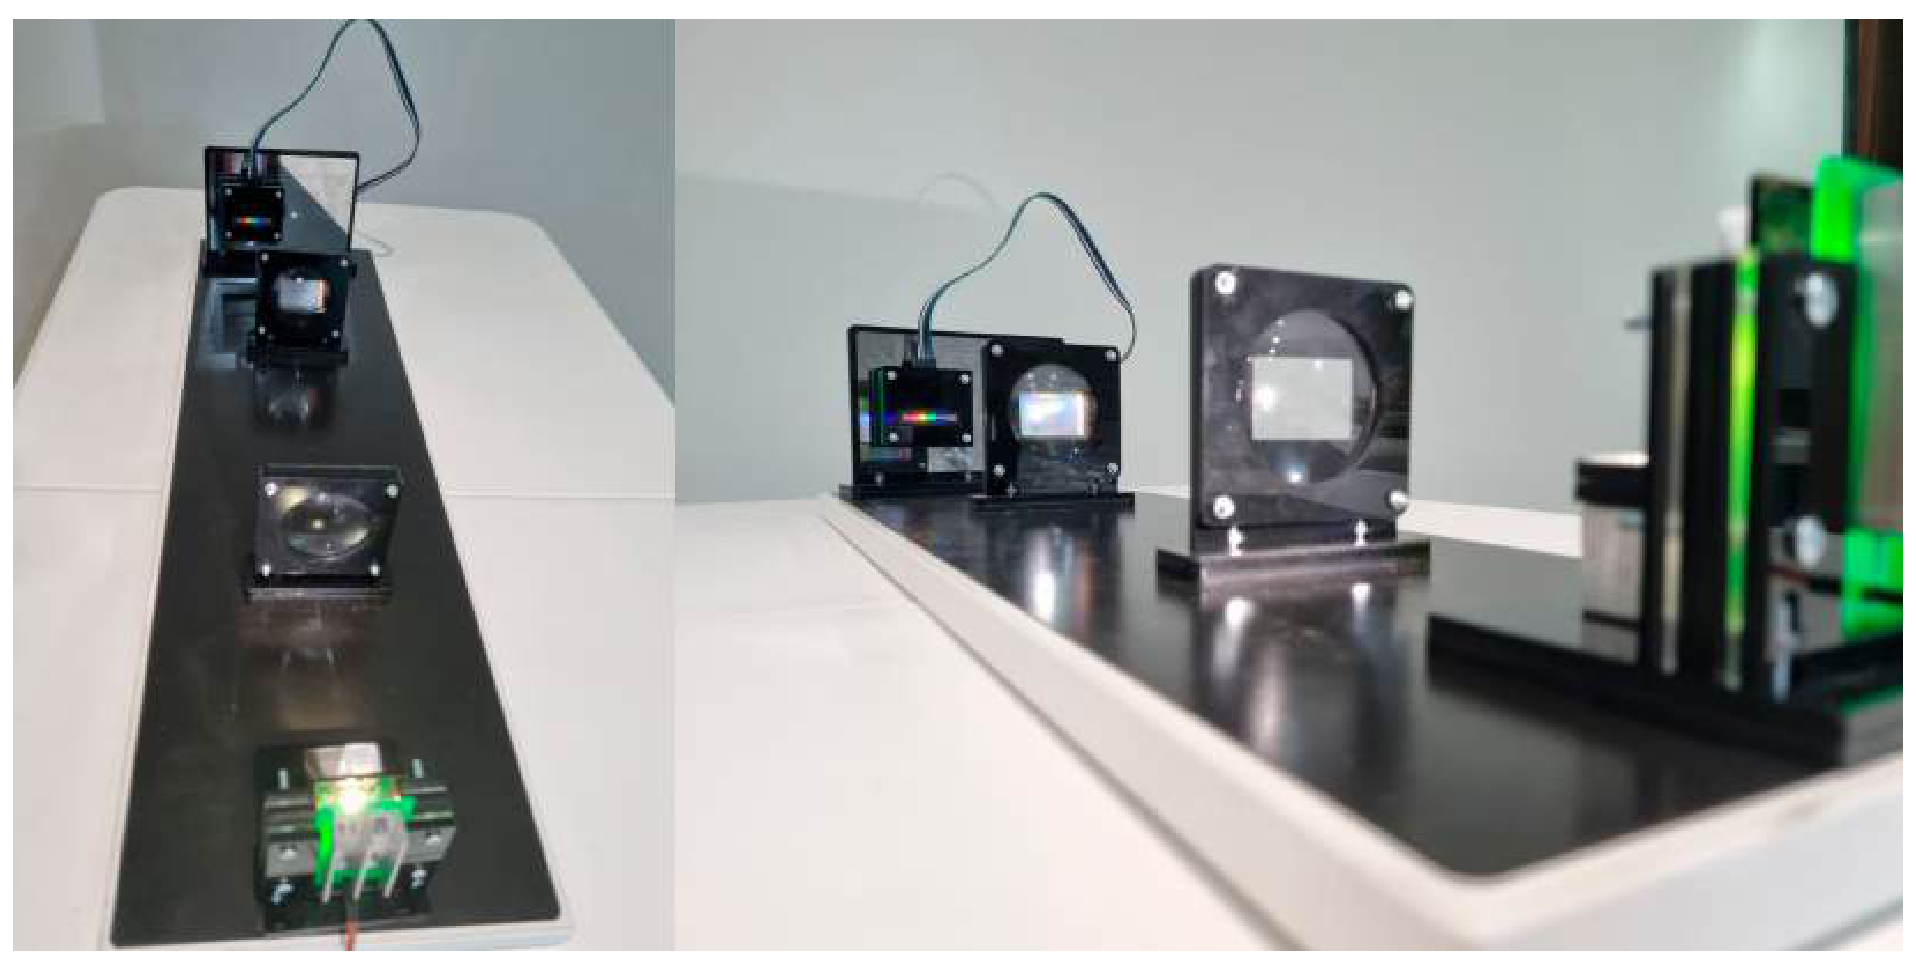
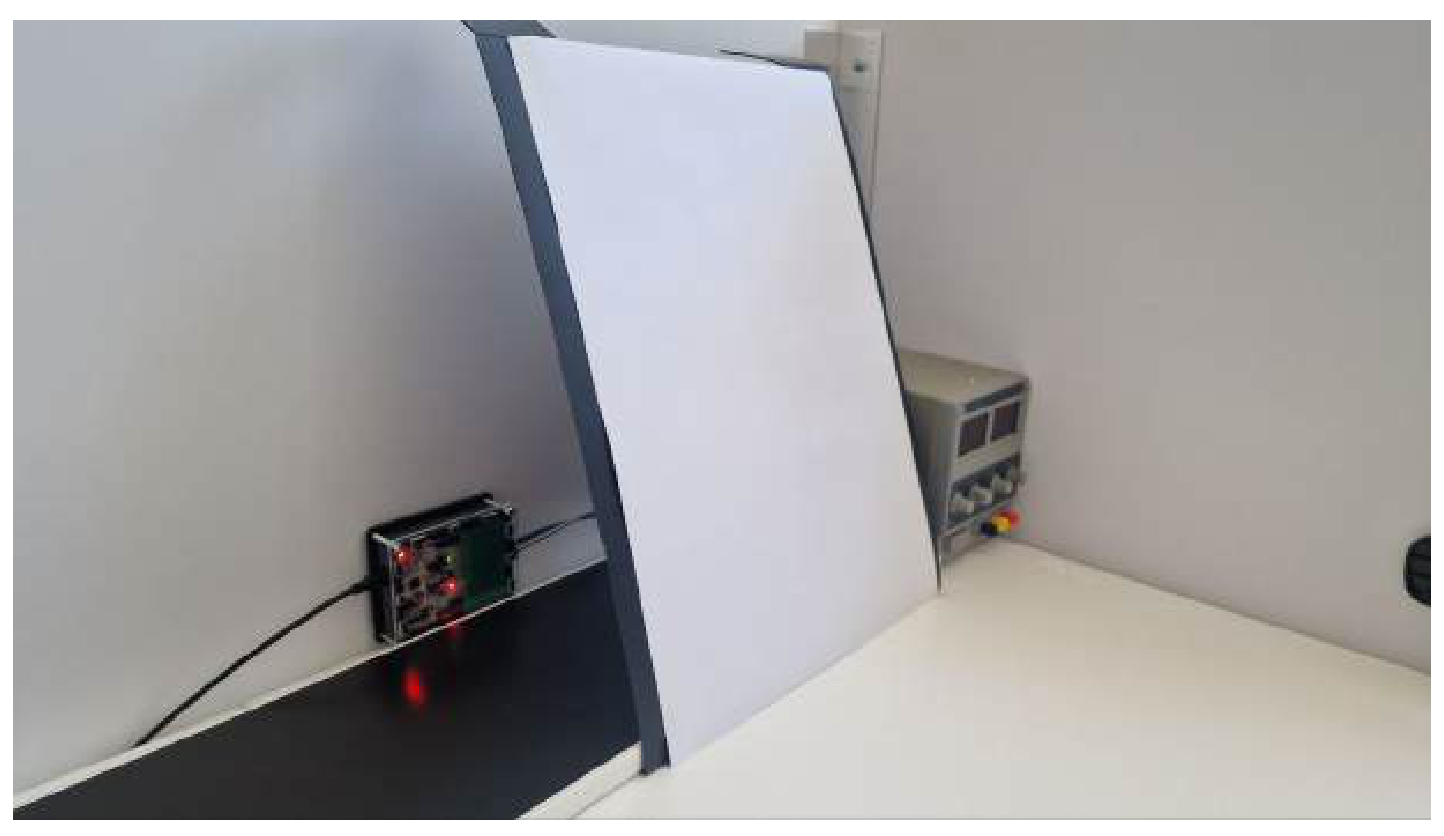
A1 For calibration, one needs to set the lens so that the source is in focus of the first lens and the screen is in focus of the second lens. A photo of the final installation is shown on the figure below.
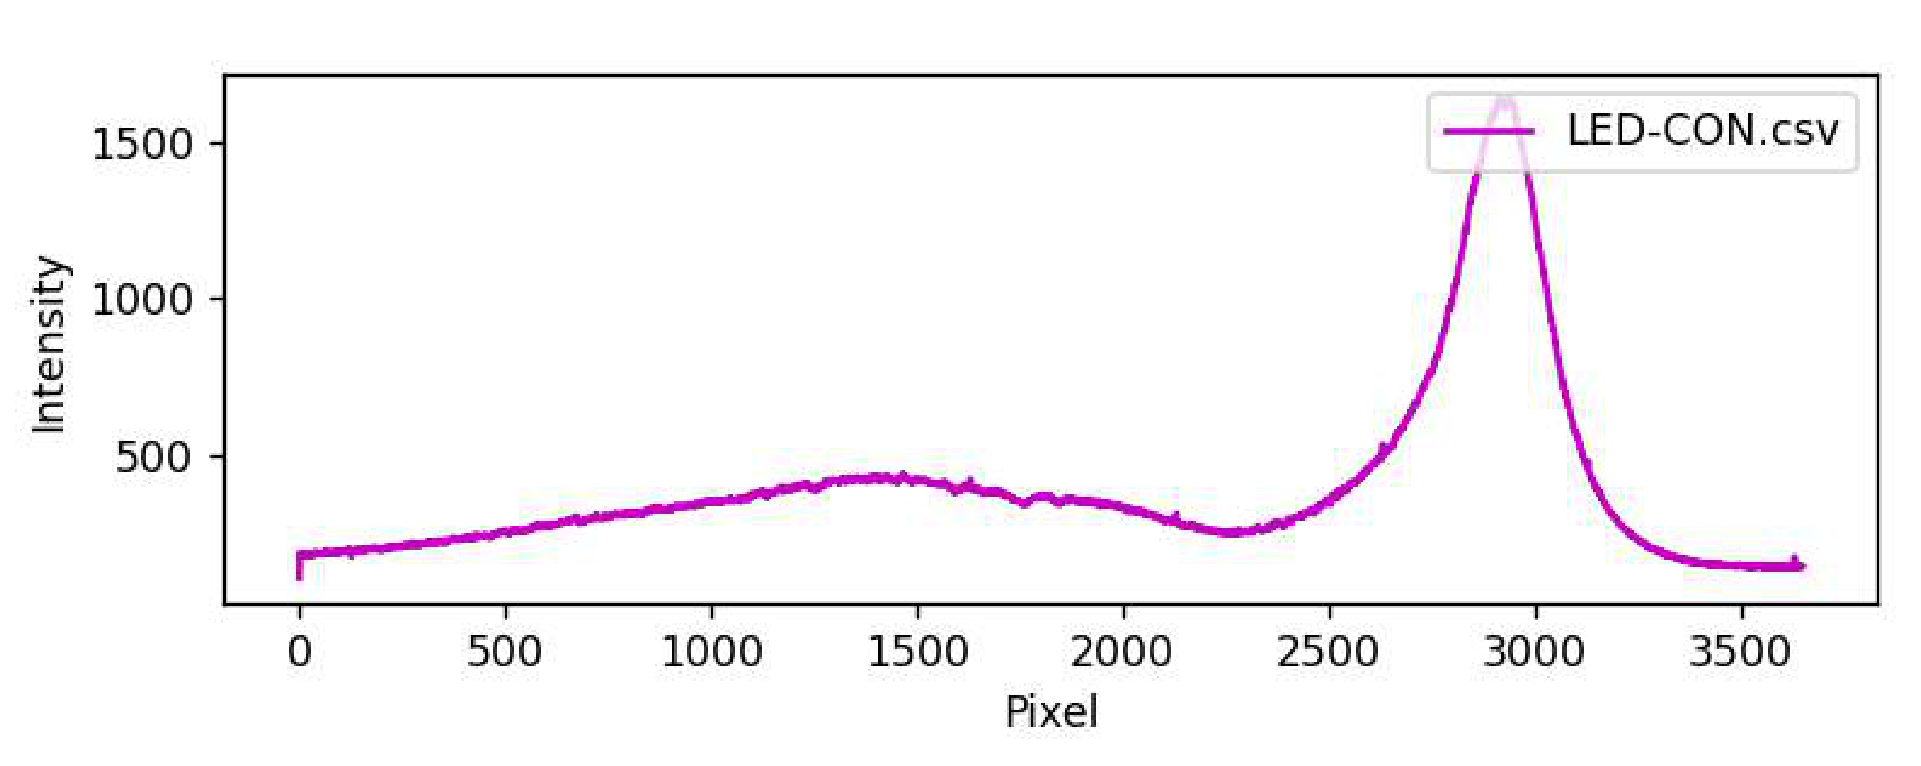
After adjusting the installation, it becomes possible to study the spectrum of the LED-CON. Note that this can be done using either of the two first-order diffraction patterns, since they are mirror-symmetric. A typical image of the LED-CON spectrum is shown on the figure below. At the edges of the LED-CON spectrum, the intensity is not zero, since there is background lighting from external sources. In the conditions of the Olympics, the background lighting could reach up to 1000. To reduce it significantly, one can use the ”Sun Screen” as it suggested in the task.
A2 After turning off the LED-CON, one can get the spectrum of background lighting. The spectrum is not given here, because its type depends on the experimental conditions and is unique for each installation.
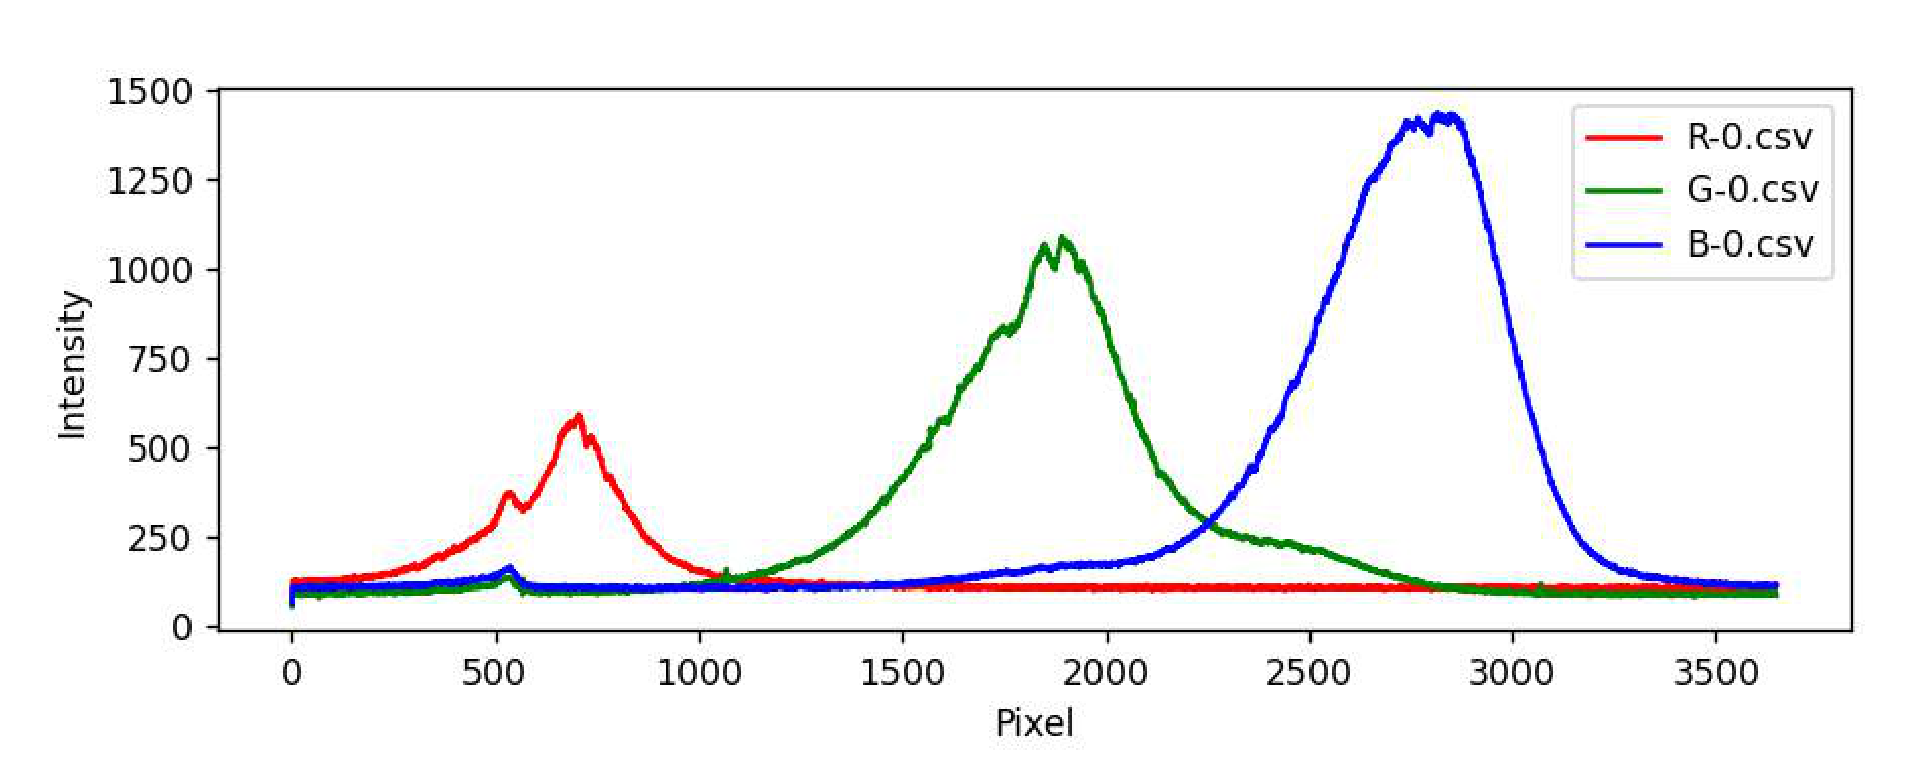
A3 Replace the LED-CON with LED-RGB and measure the spectra for all three colors of LEDs: red, blue and green. The characteristic graphs are shown in the figure below.
A4 As stated in the problem statement, the wavelength depends linearly on the pixel number:
Taking the pixel number corresponding to the maximum intensity value of each color, and the wavelength of that color, we get three points. By drawing the approximating line for these three points, we get the values of and .
Remarks:
- The value of could be either positive or negative depending on the installation constructed.
- Shifting any element by a distance of the order of a millimeter can significantly change the coefficients and . Therefore, in case of a shift, a new calibration should be done.
A5 Using the formula from the previous paragraph, one can obtain the wavelength corresponding the pixel number of the maximum intensity of an unknown LED-UNK.
Part B. Beer–Lambert law
B1 To find the average volume of drops of fluid IC, one can slowly squeeze the fluid out of the syringe drop by drop and study the average volume change inside the syringe. There are approximately 100 drops per 0.5 ml of the fluid, and this value varies significantly from syringe to syringe. The phenomenon of the drop being held at the end of the needle is associated to the effects of surface tension, and its manifestation significantly depends on the geometry of the needle tip.
B2 In most cases, the optimal measurement parameters are the highest voltage on the LED-CON, such that the ”src” spectrum does not go above ”overflow”, and the lowest ”Sensitivity”.
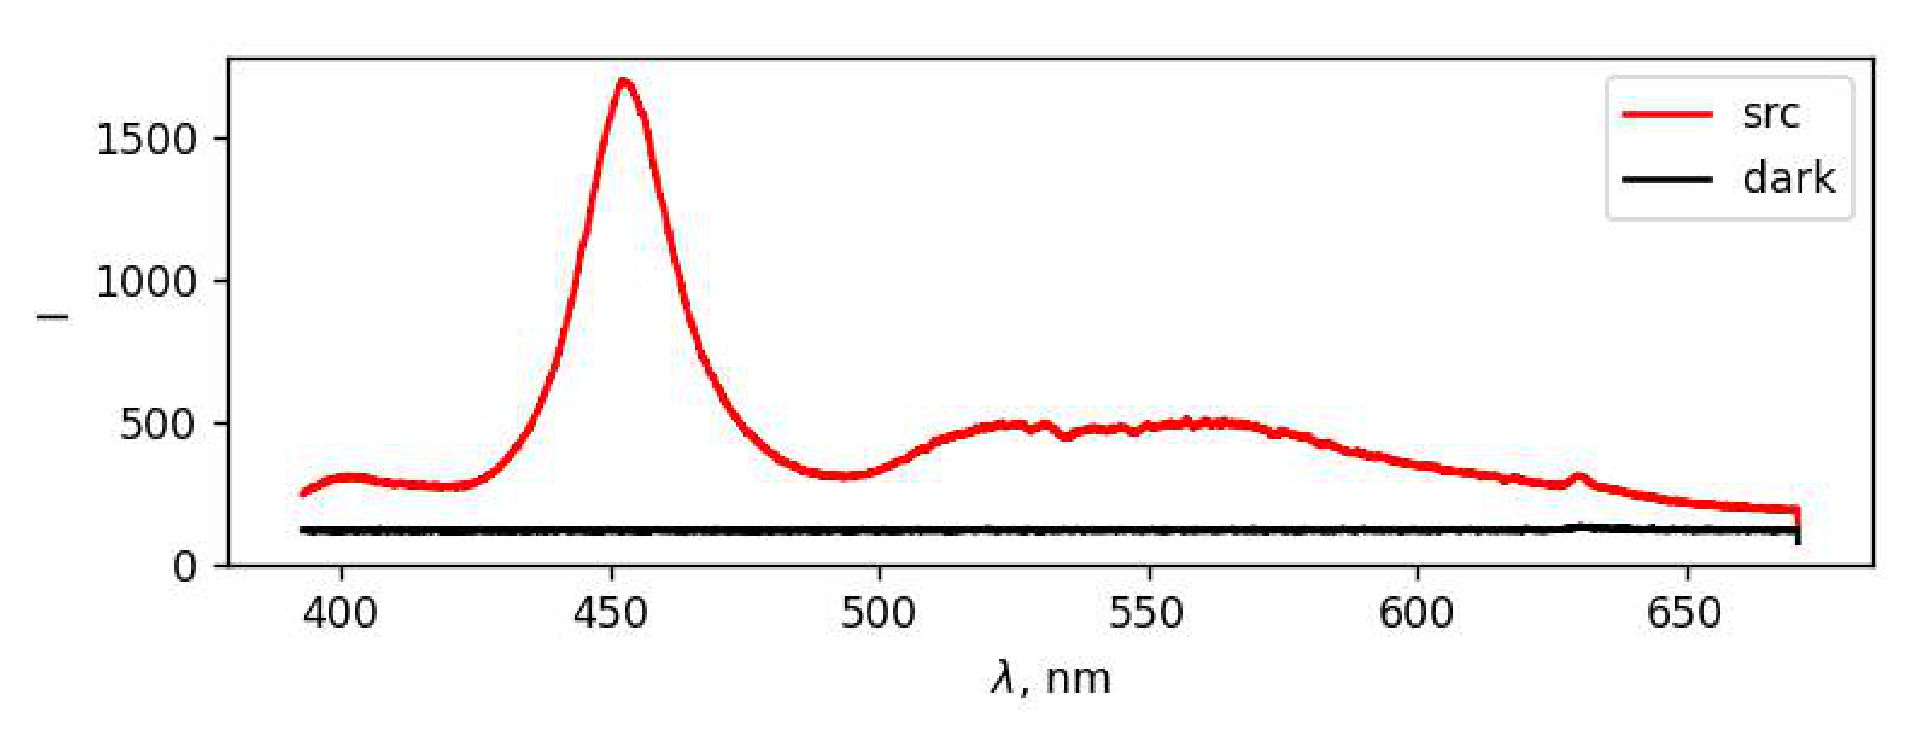
The spectrum of LED-CON light after passing through a cuvette with water is shown on the figure below.
B3 The intensity of the source at each wavelength is equal to the difference between the intensities of ’src’ and ’dark’ at the same wavelength . By plotting the graph of the intensity of the source without background illumination, it is not difficult to obtain a wavelength range in which the dependence of can be studied.
B4 By adding drops of the initial fluid to the water, we change the concentration of IC in the optical cuvette, which allows us to study the dependence of the intensity spectrum of light passed through the fluid on the concentration . As marked in the the task statement, after adding drops the fluid should be mixed. The easiest way to do it is to close the cover and shake the cuvette. If there are bubbles, one can get rid of them by tapping the finger on the walls of the cuvette.
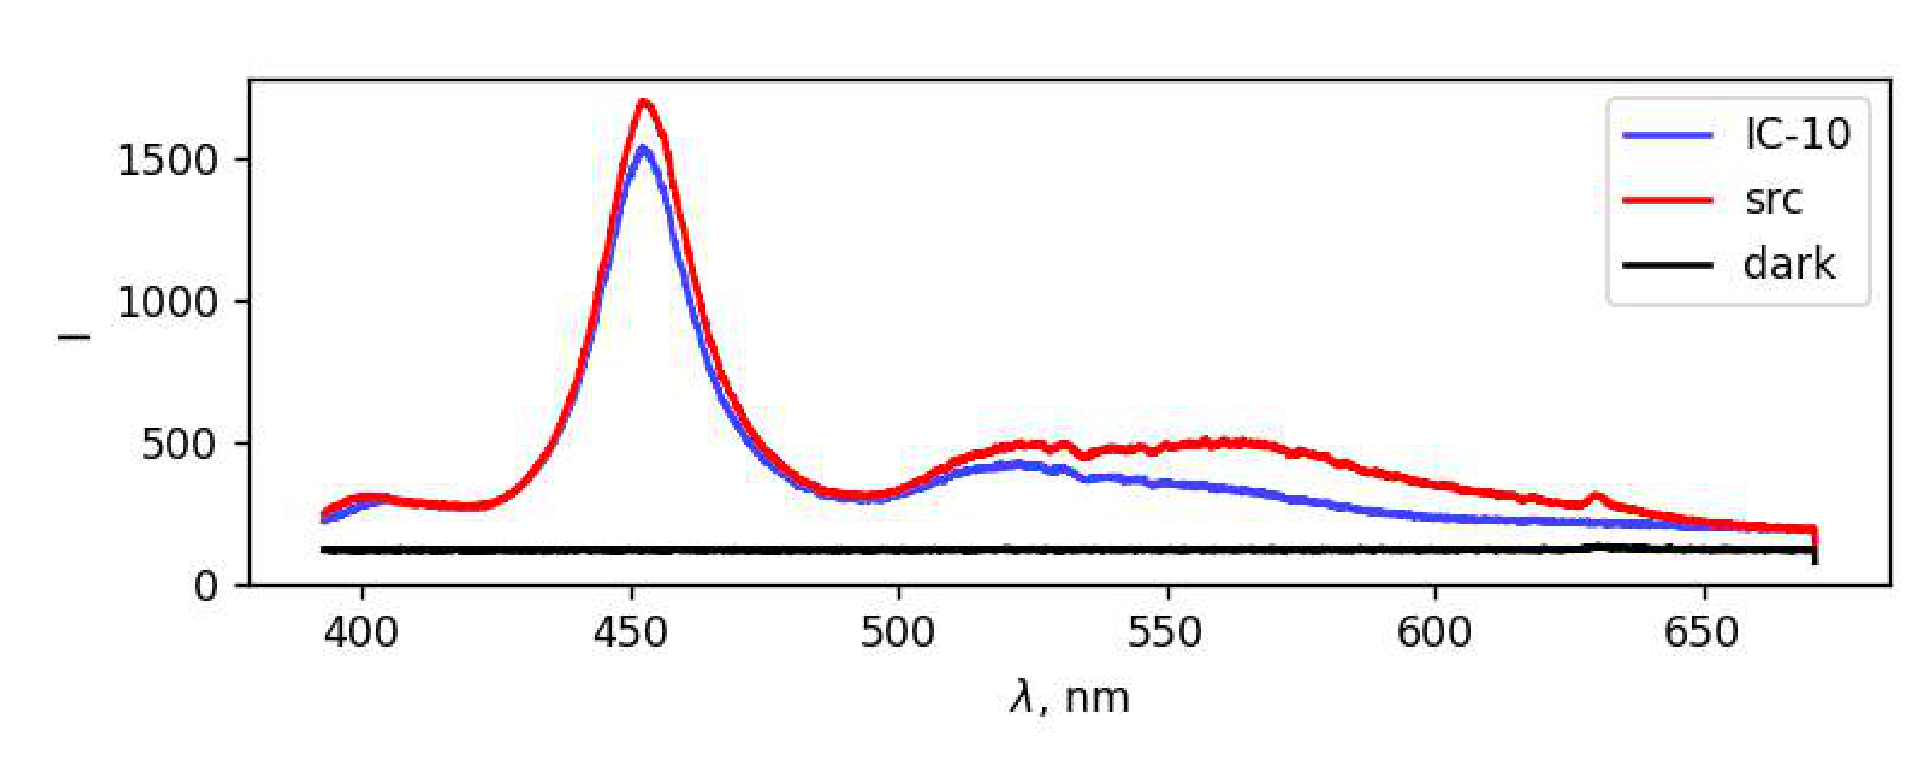
The typical form of the IC spectrum, together with the ’src’ and ’dark’ spectra, is shown on the figure below. Significant absorption in the red region is observed in the obtained spectra, which explains the blue color of IC.
B5 Consider a layer of a substance with a thickness and a cross-sectional area . It contains molecules. From the point of view of the described absorption mechanism, each of the molecules is an absorbing circle with the area , so in total they form the absorbing area .
The total power of the light entering the area equals . The relative decrease in beam power after passing through the described layer is equal to the ratio of the absorbing area to the area :
B6 After integration of the expression
with appropriate limits
where the negative sign in the right hand side corresponds the fact that is the decrease of the light intensity, we get
B7 Using the formula obtained in B7, express in terms of the measured intensities:
where is a concentration of IC in the fluid inside the optical cuvette, and is the inner width of the optical cell.
We get the dependence of the concentration on the number of added drops . The mass concentration of IC in the initial solution equals g/l. Let us find the concentration (its dimension is m) of indigocarmine molecules in the initial fluid:
where is the number of molecules of IC in the volume of given fluid, is the Avogadro constant, is the molar mass of indigocarmine. Then the number of molecules in drops of indigocarmine equals
Thus, the concentration of indigocarmine in obtained fluid in the optical cuvette (the change ml in the volume of the fluid is negligible) equals
Substituting the concentration into the expression for , we get the expression
Finally, linearized dependence of radiation intensity on the number of indigocarmine drops is the following:
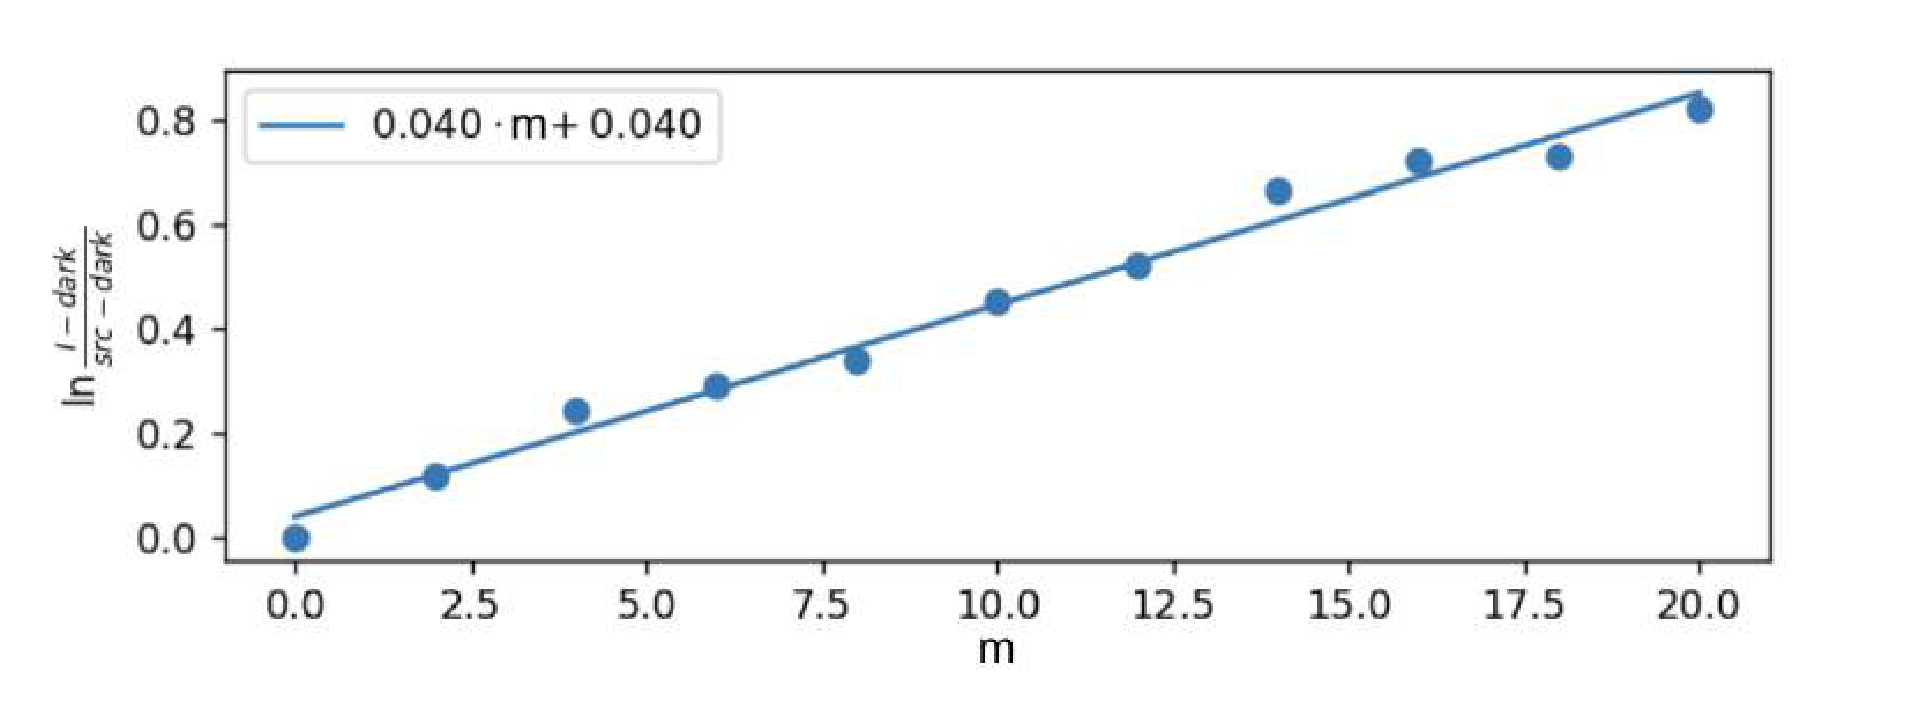
It remains to process the received data. To do this, choose a certain wavelength and compute the value for different numbers of added drops. Then one needs to construct the dependence of on and approximate it by linear regression with the coefficient slope . By the previous formula:
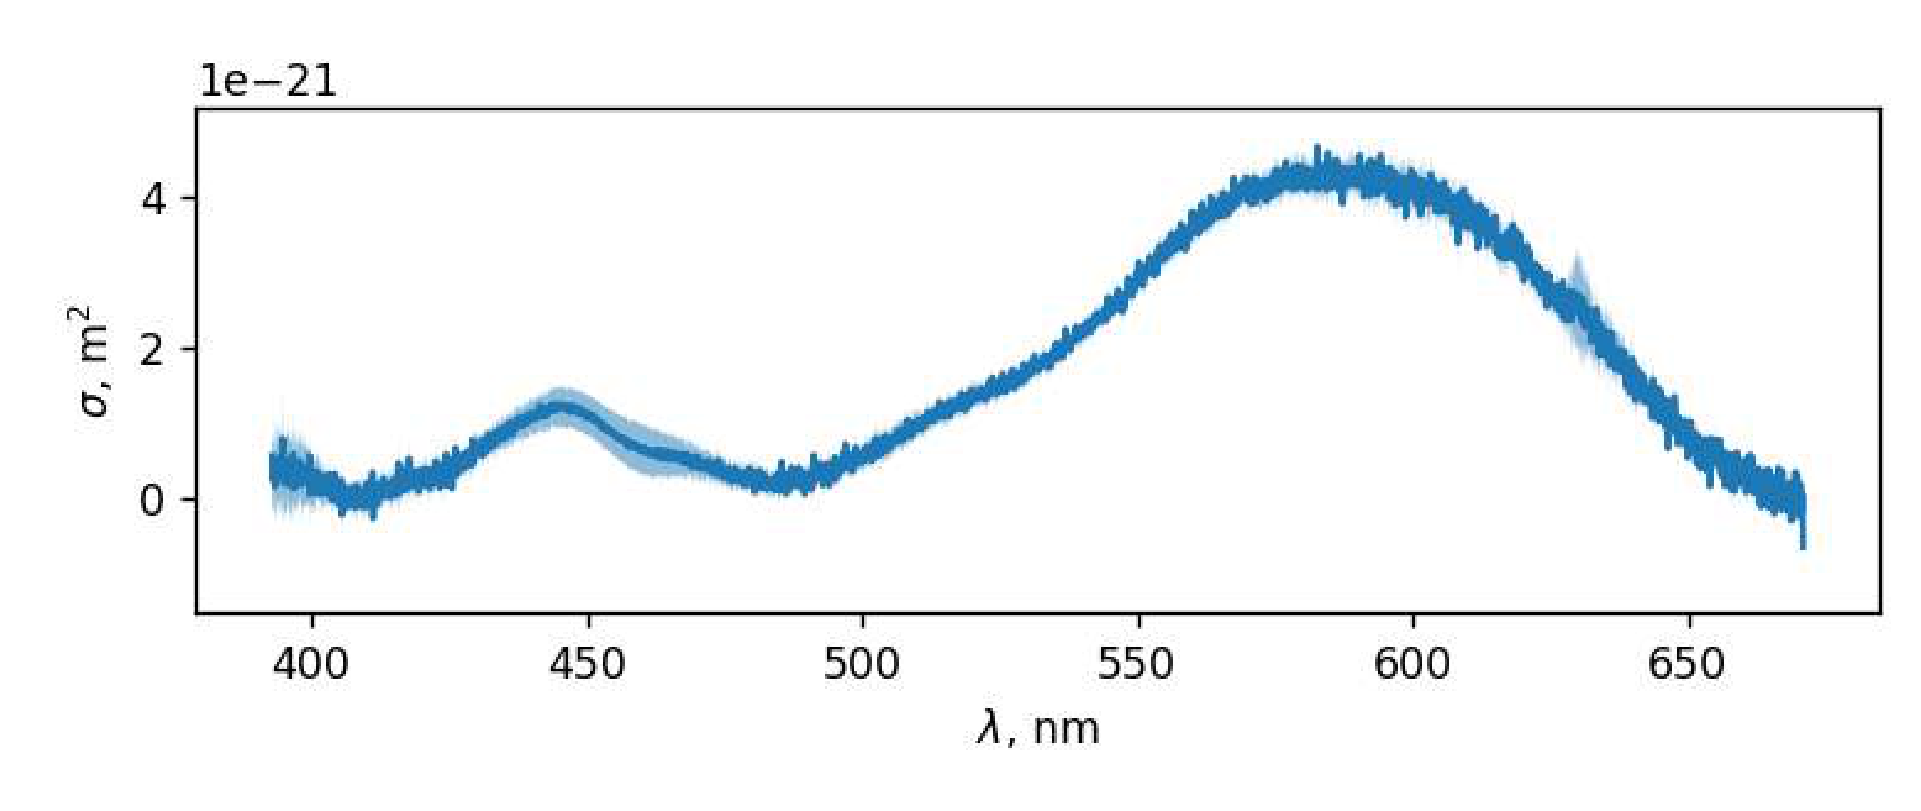
Repeating the described procedure for 10 different wavelengths from the range found in B3, one can get 10 different linear regressions. Using their slope coefficients, one can compute the value of . Generally speaking, based on the data obtained, one can get the value of for each pixel and the wavelength corresponding to it, not limited to 10 values. The graph for all points calculated according to the described procedure is shown on the figure below. The width of the solid-colored area on the graph is the statistical error of the linear approximation of .
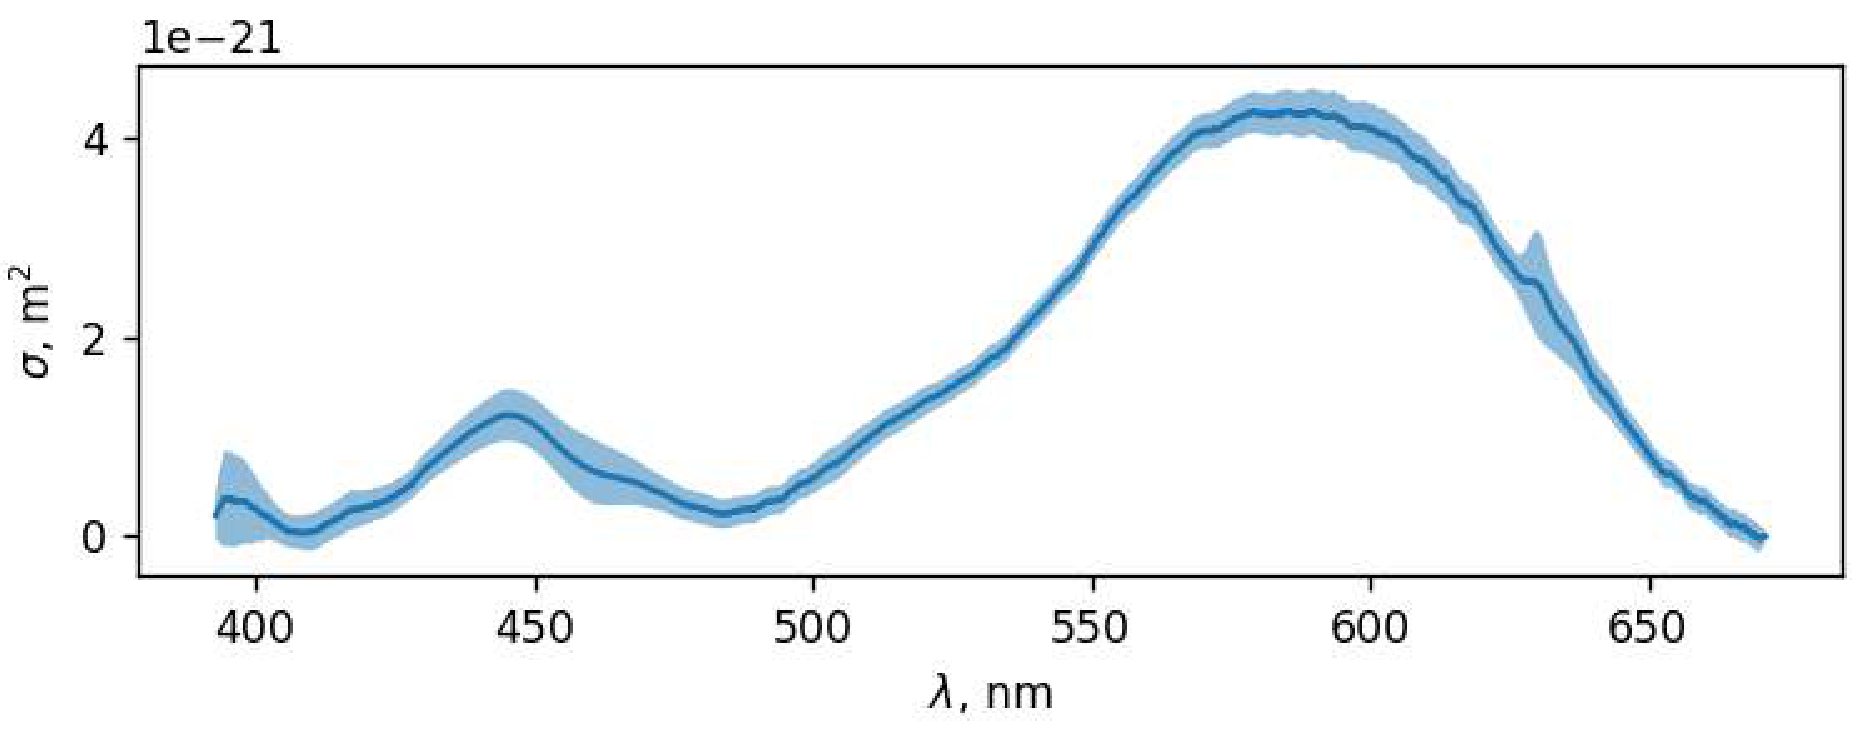
Obtained graph should be smoothed so that it better reflects the shape of the final absorption cross-section spectrum .
The typical value of the maximum absorption cross section equals
B8 The wavelength corresponding to the absorption maximum can be found from the graph obtained in B7.
Part C. Phenolphthalein
C1 Let us find the concentration of NaOH-solution of the molar concentration mol/l. There are two types of ions in the fluid.
| Ion | |||
|---|---|---|---|
| 1 | 1 | ||
| 2 | -1 |
C2 Since all the ions in the fluid have a charge number with the absolute value 1, and the concentration of each type of the ions coincides with the concentration of the corresponding dissolved substance, we can write:
| Ion | |||
|---|---|---|---|
| 1 | 1 | ||
| 2 | -1 | ||
| 3 | -1 |
Simplifying the expression, we get the volume of distilled water, what should be added:
C3 If we consider a fluid with the concentrations of NaCl and NaOH equal to , then the relation obtained in C2 will be the following:
From this expression, it can be concluded that the volume of distilled water added should be zero, and the ratio of volumes of NaCl and NaOH in the mixture can be arbitrary.
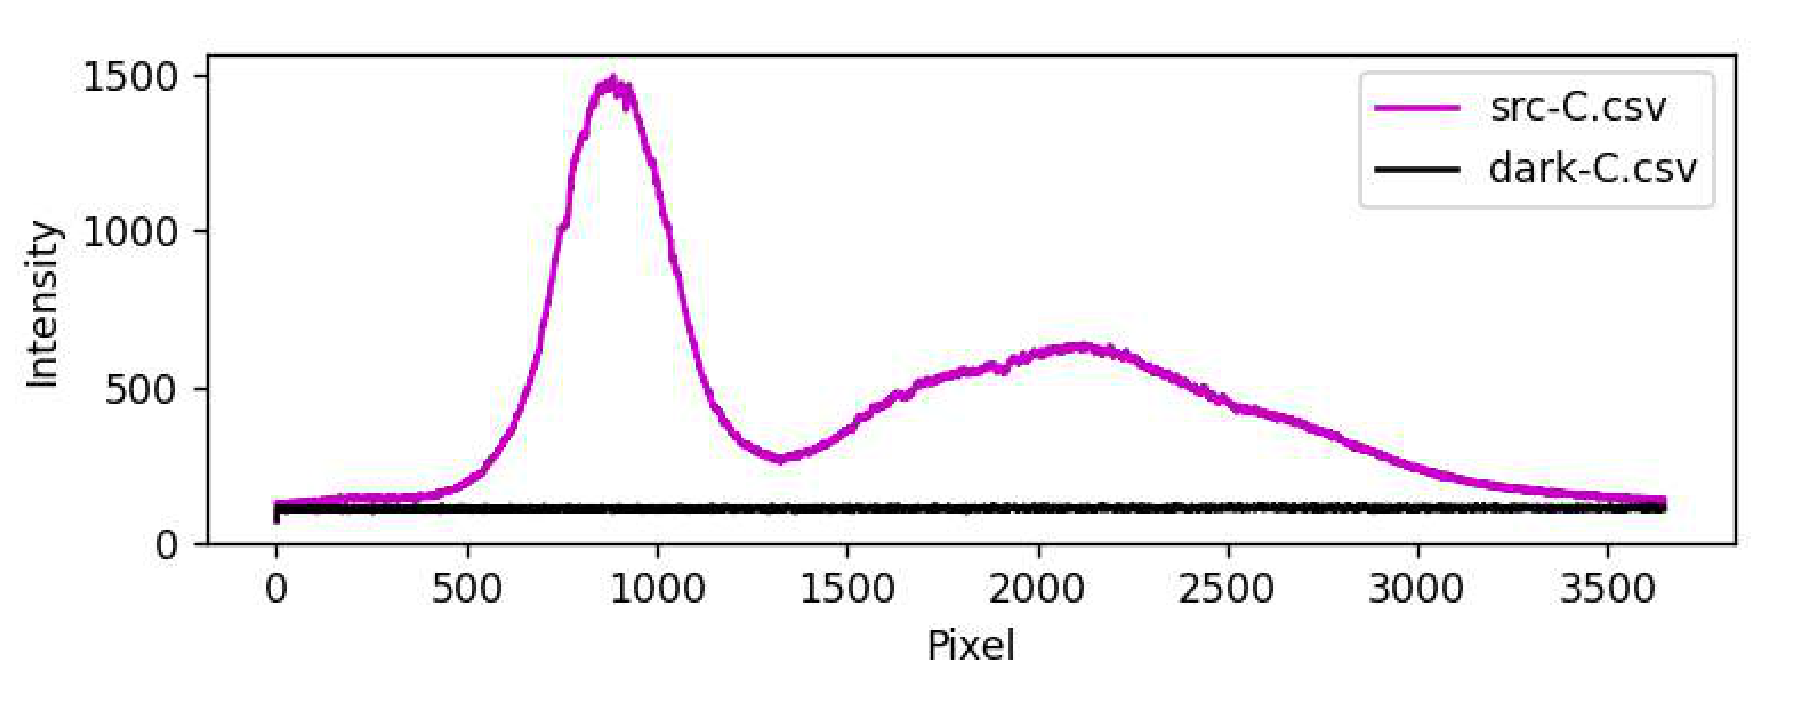
C4 Let us obtain the spectrum of LED-CON light that has passed through the cuvette, in order to take into account the absorption of the cuvette material and all kinds of reflections. Let us set such sensitivity so that the spectrum does not cross the ”Overflow” level and does not change its characteristic shape when approaching it. Let us measure the spectrum of background lighting at the same sensitivity. The intensity of the background signal may differ from that obtained in the previous paragraphs.
After passing through the cuvette with a mixture of NaOH- and NaCl-solutions, the light from the source loses intensity, but its spectrum keeps its typical form: narrow and high peak in the blue part of the spectrum, low and wide peak in the green-red part.
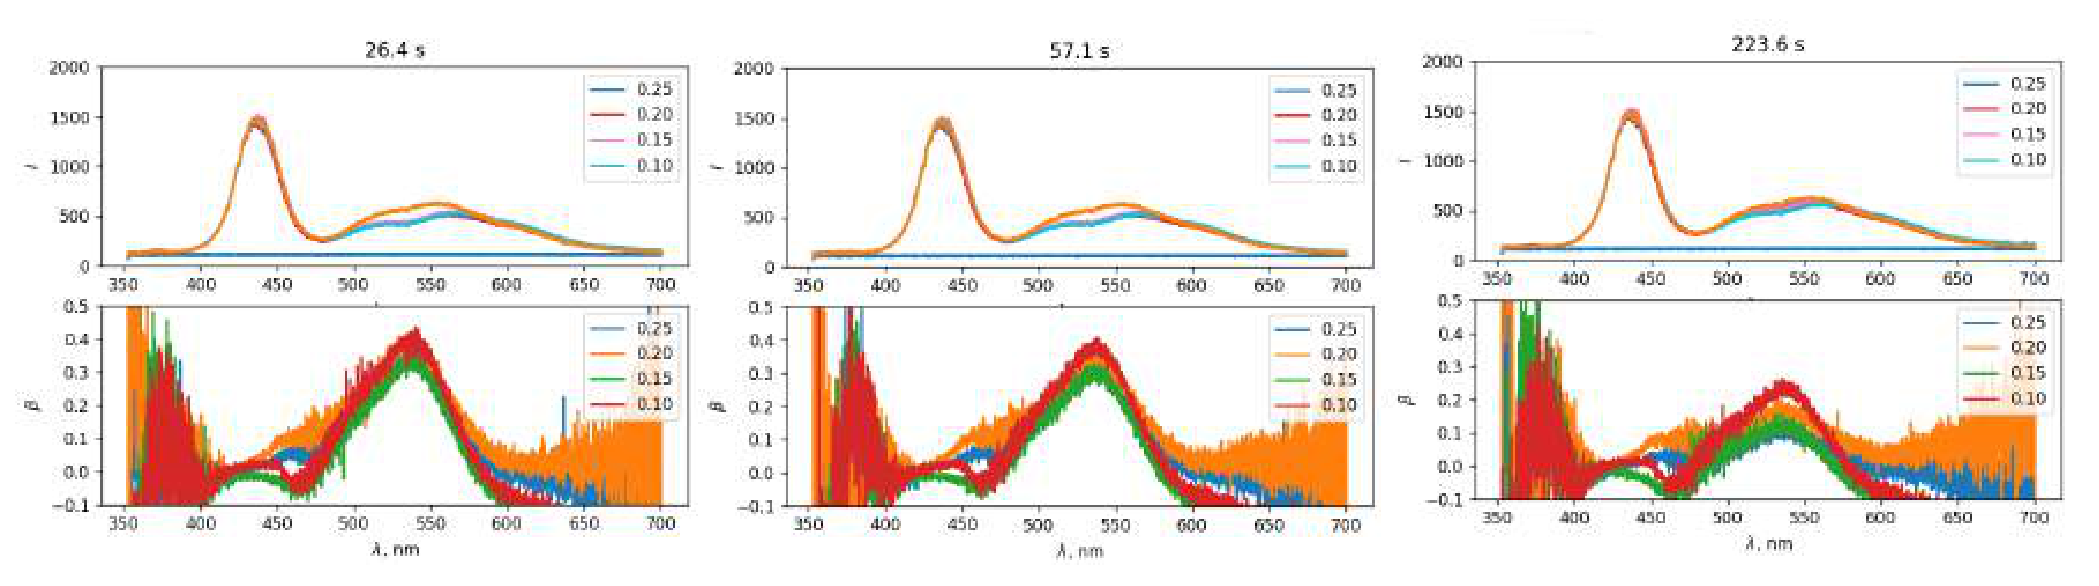
C5 Let us measure the dependence of transmission spectra on time for 5 fluids of different concentrations of ions, as required in the task. We measure the intensity of background lighting before each dependence. The time of the experiment depends on NaOH concentration, and will increase as it decreases.
The difference in the shape of the spectrum obtained in this part of the task from the spectrum of the radiation source obtained in C4 is caused by the presence of absorption in the fluid inside the cuvette. The absorption leads to a significant decrease in the intensity of transmitted light in the wavelength range 500-600 nm.
Over time, the absorption will decrease, due to a decrease in the concentration of phenolphthalein In, until the concentration reaches an equilibrium state. The higher the initial concentration of , the faster the equilibrium state is being reached.
C6 In order to find the wavelength at which maximum absorption is achieved, one needs to plot . Let us select the data that we will use in the process of plotting. We use an array of spectra obtained in the experiment using the -solution with the lowest concentration. This choice is caused by the fact that the concentration of ions will always be excessive compared to the concentration of phenolphthalein, but the process will occur significantly slower than in a pure solution of NaOH. This will give more time and allow to measure the absorption before it would decrease by a significant amount after the reaction begins. Among all the time points at which the spectrum of this solution was measured, let us choose one close to the initial one, since the equilibrium state has not yet been reached, and therefore the absorption has not decreased.
For this data, we calculate the value of using the information about background lighting:
Let us plot the dependence of . Based on the graph, we get the answer for .
C7 The value measured in C6 can be expressed in terms of and the concentration :
For the fixed wavelength holds , so . Since we can compute the concentration of In in conventional units, we will use as these conventional units, which turns out to be directly proportional to the concentration of .
Let us do our study for the wavelength .
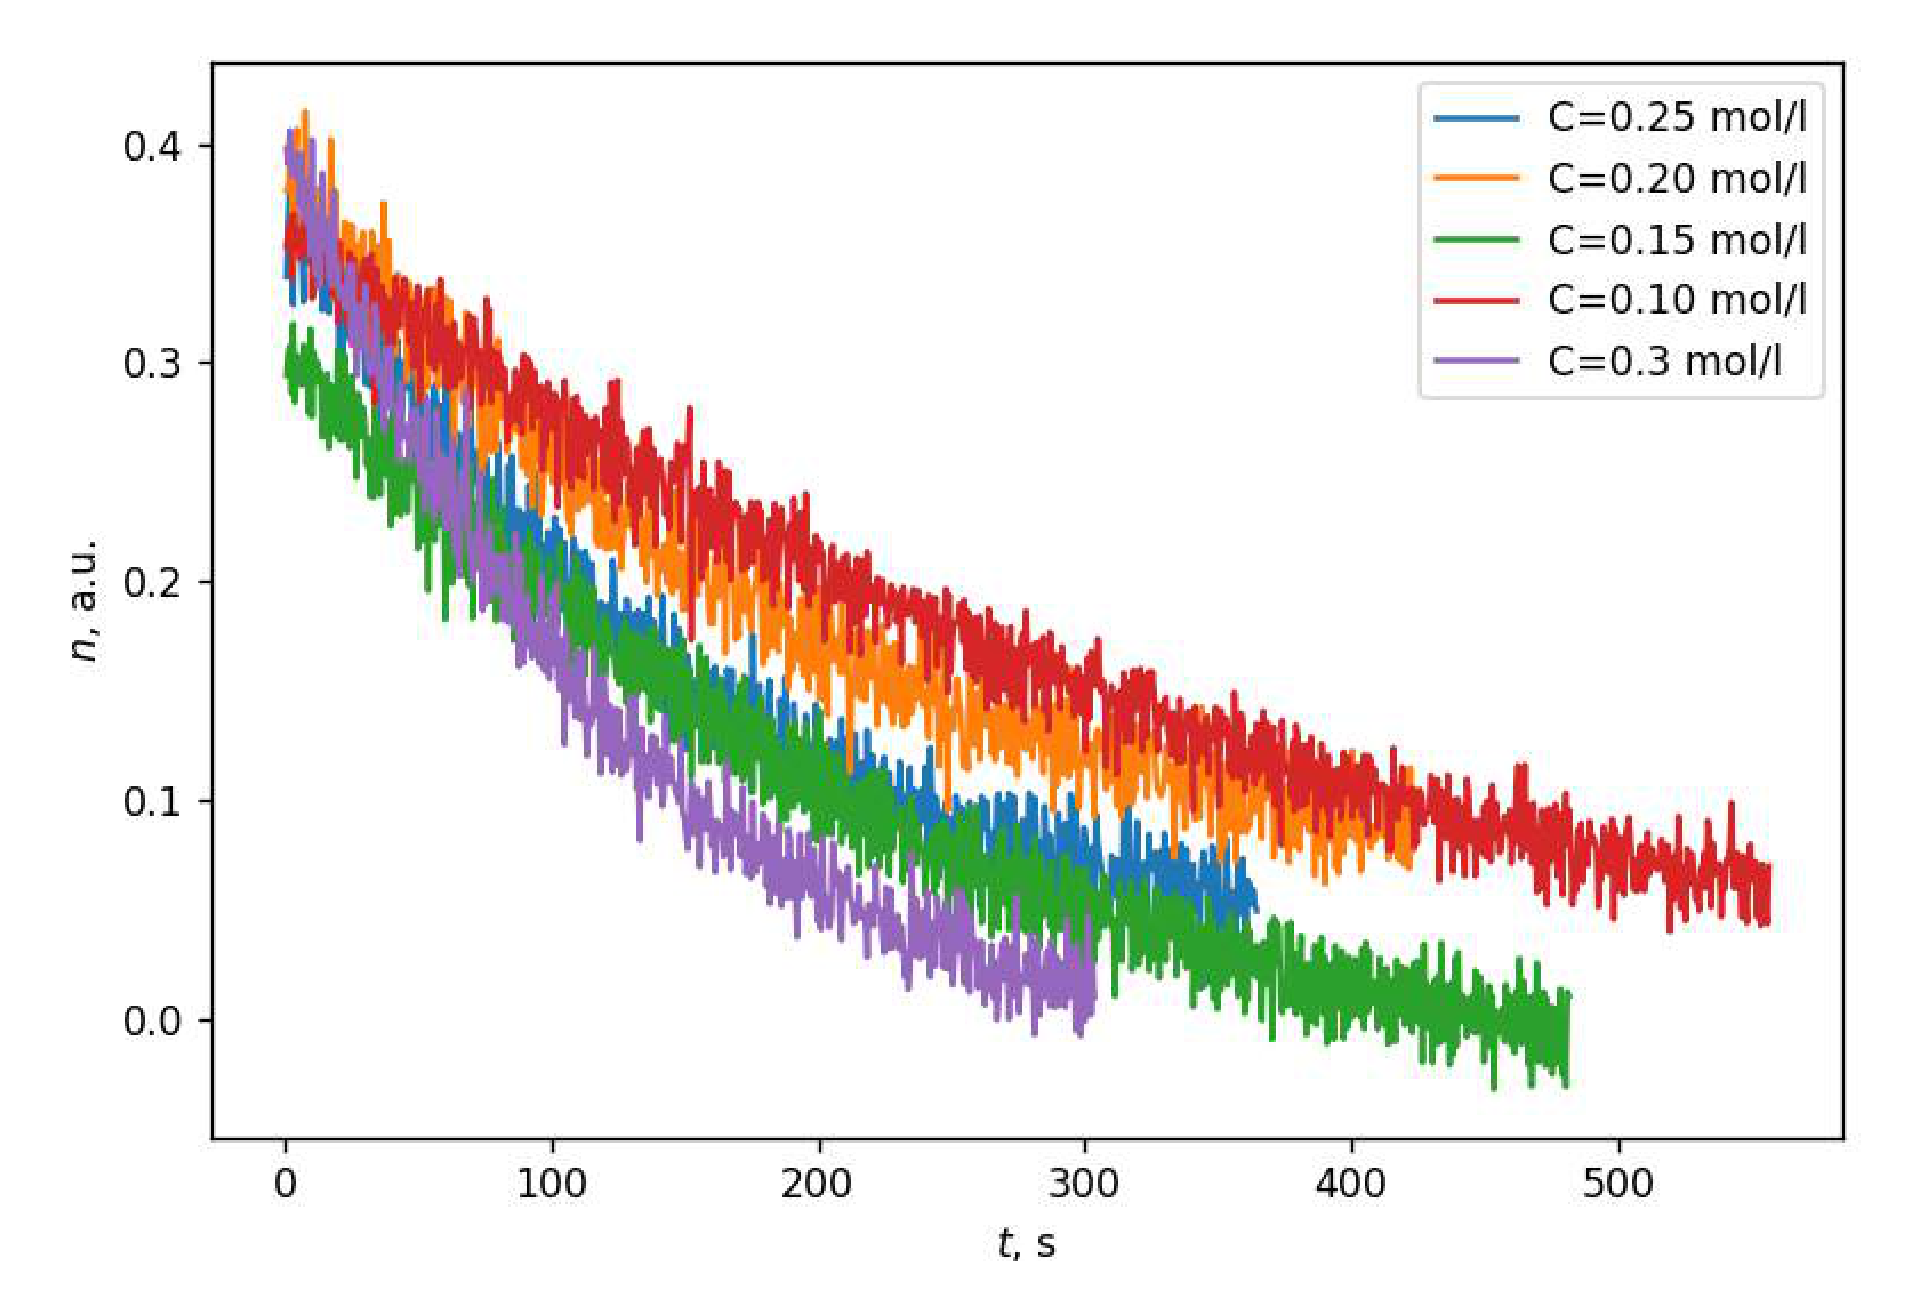
For each of the 5 ion concentrations let us compute the dependencies for the wavelength and plot their graphs. The resulting graphs have the following form: these are decreasing dependencies that reach saturation, and the rate of decrease is higher, if the concentration of ions is greater.
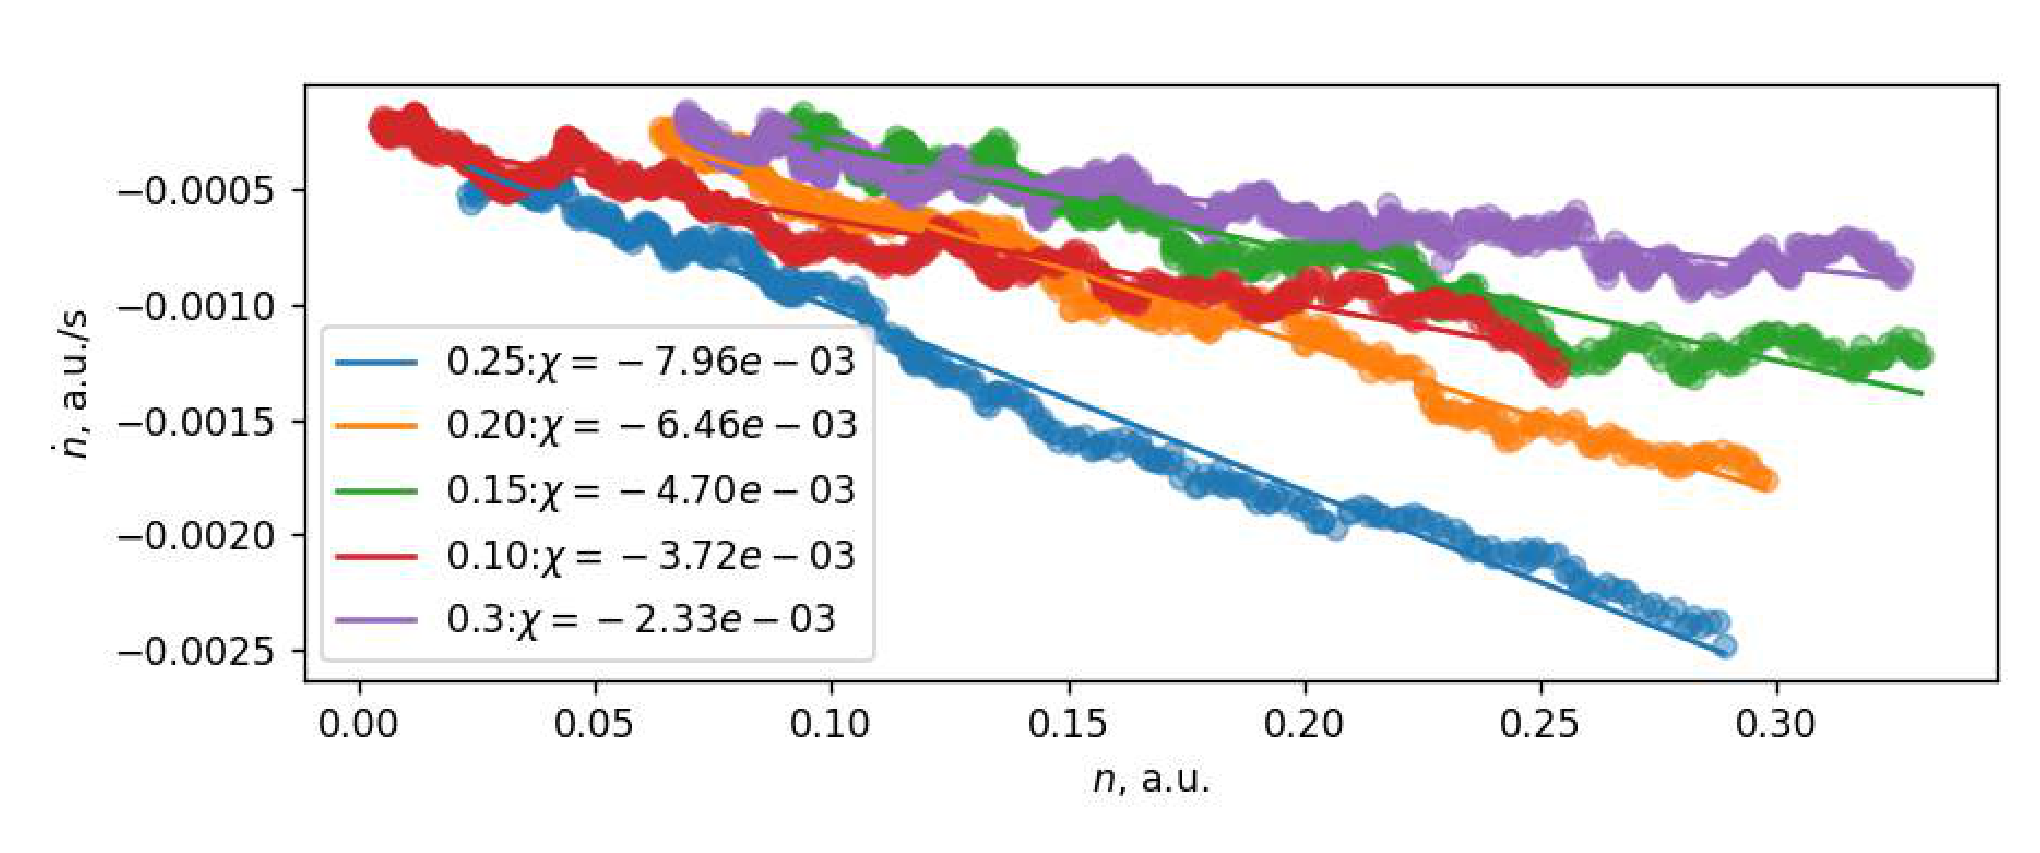
C8 In order to study the reaction rate as a function of concentration, one needs to find the derivative of concentration in time, instead of which we will use the derivative of in time, since they are equal to each other with the accuracy of the multiplication by a constant. The numerical computation of the derivative is complicated by the significant noise of the signal from the CCD ruler. It is proposed to reduce the noise effect by calculating the derivative as follows:
Let us compute the derivative for each of the concentrations and plot the dependence of in conventional units (that is, ) for each of the experiments.
Let us describe the kinetics of the chemical reaction theoretically.
.
As it is marked in the task,
where and are constants.
Since the total number of phenolphthalein molecules in all states remains unchanged, one can say that:
Then one can write the following expression for the reaction rate:
According to the notations introduced in the task, we have ,
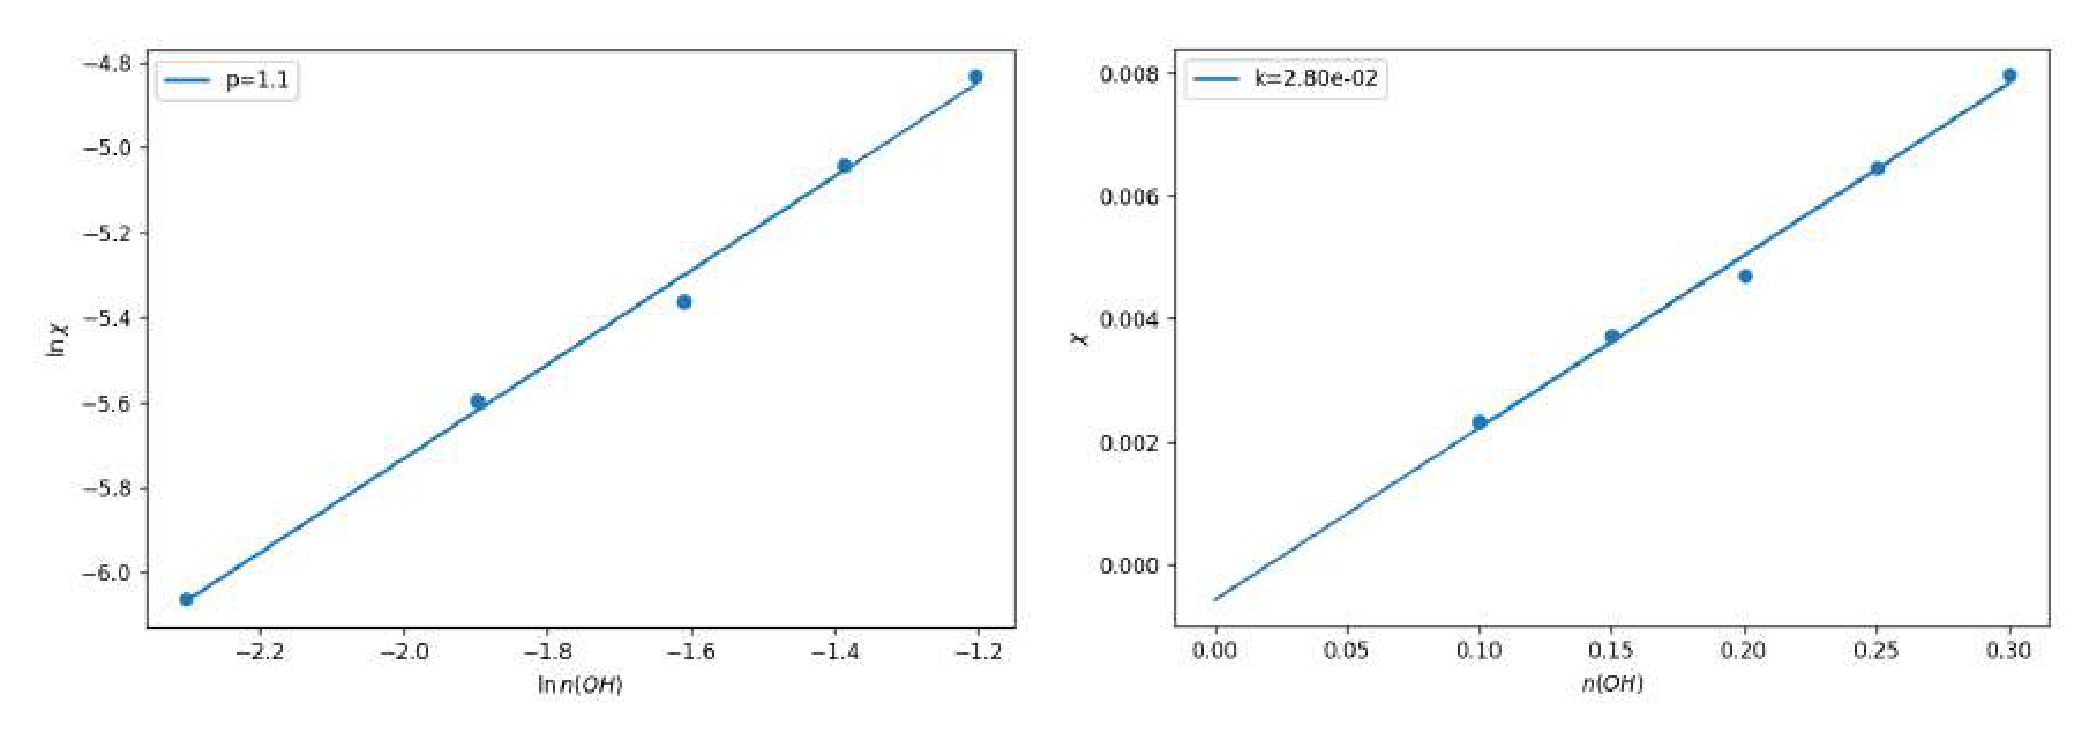
Since hydroxyl ions are in the strong excess, it can be assumed that . In this case, the dependence turns out to be linear with a slope coefficient equal to . The plotted graphs confirm the theoretical dependence we have obtained.
Based on the expressions obtained, it can be argued that the dependencies obtained in C7 are exponential, and their saturation output corresponds to the condition , or .
C9 Saturation condition is the following: , or
After the concentration reaches the stationary mode, the fluid turns out to be very weakly colored, which indicates that the final concentration of is small, that is, . This means that .
Using the graphs constructed in C8, let us calculate the slope coefficients . If we assume that (still ), and plot the dependence , we will get the value of as the slope coefficient of the graph. The slope coefficient of the graph is equal to 1.1. Since is obviously an integer, we can say that .
To check the assumption that , one can plot the dependence of on . Since obtained dependence is linear and goes beyond zero, our assumption is correct.
Note that it was possible to obtain by constructing other graphs and using other methods of analysis.
Part D. Chemical traffic light
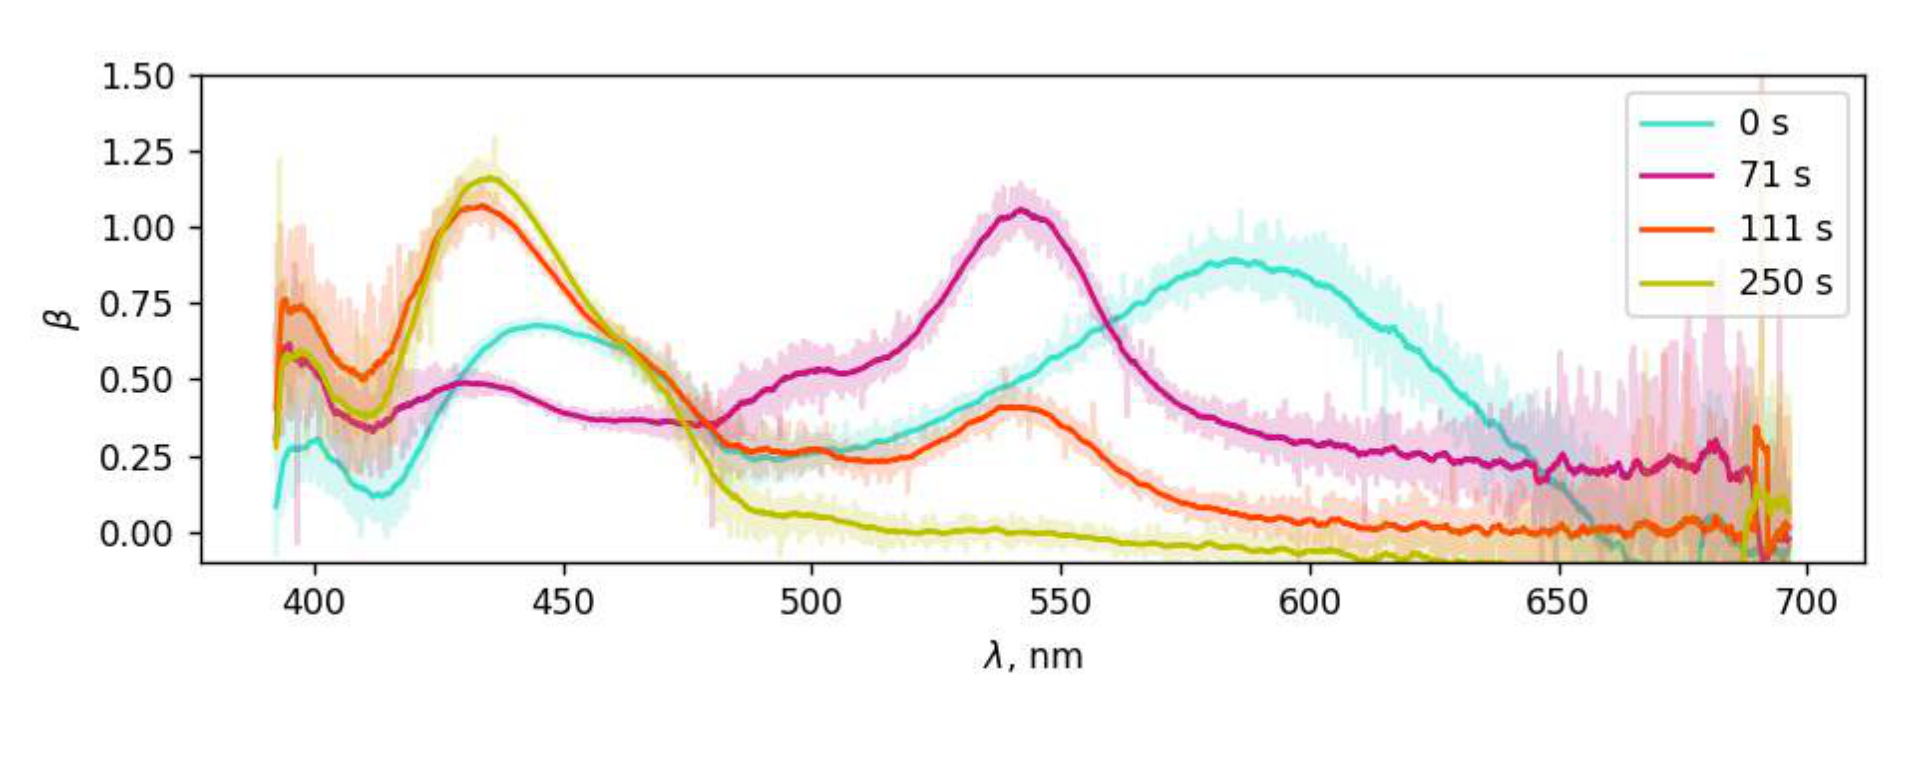
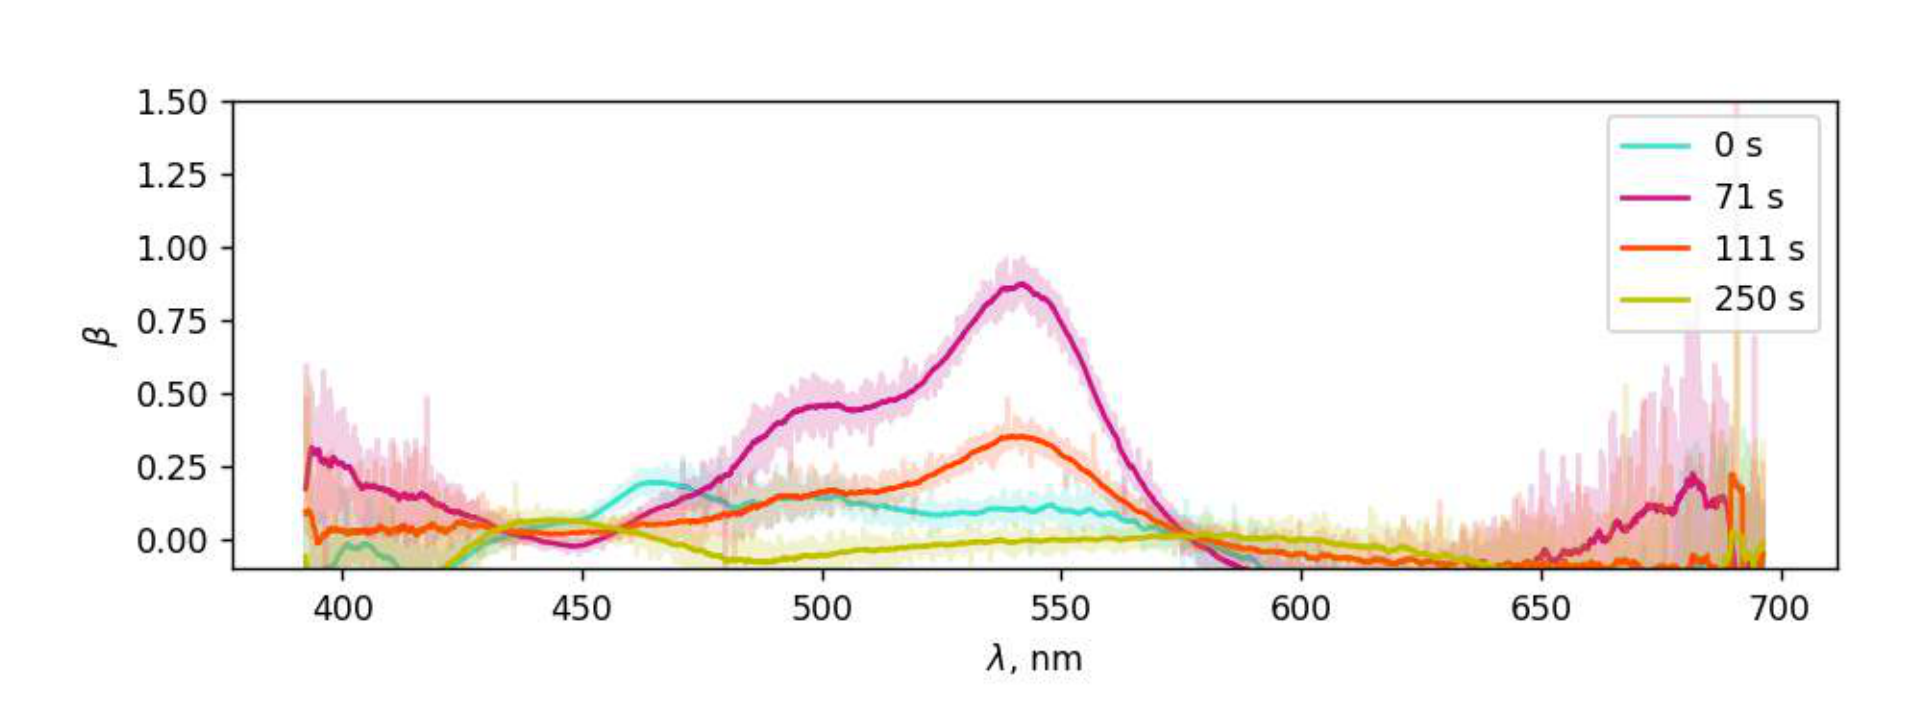
D1 At first the fluid has a green or blue-green color, then turns violet, then orange, and yellow at the end. The typical time of appearance of violet is , and the typical time of appearance of orange is later, and the transition from orange to yellow occurs smoothly. The transition to violet turns out to be faster when the concentrations of reagents are incorrect or when the reaction is ”restarted”.
| Color | Green/Blue-green | Yellow | Red/Orange | Violet |
|---|---|---|---|---|
| Number | 1 | 4 | 3 | 2 |
| 0.0 | 200+ | 60 | 40 |
D2 The intensity of the background signal may differ from that obtained in the previous paragraphs. After passing through a cuvette with a mixture of NaOH and Gl solutions, the light from the source loses intensity, but its spectrum keeps its typical form: a narrow and high peak in the blue part of the spectrum, low and wide in the green-red part. The tops of the peaks are symmetrical. Initially, the spectrum of light transmitted through the fluid has a form similar to the form of the source spectrum, and then the following dynamics is observed:
- in the red area, the intensity decreases smoothly;
- in the green area, the intensity first increases smoothly, then decreases sharply, and then increases smoothly again;
- in the blue area, the intensity first increases smoothly, and then decreases smoothly.
D3 According to the definition of , which was given in Part B,
Absorption spectrum graphs correspond to the dynamics of the spectrum described in task D2.
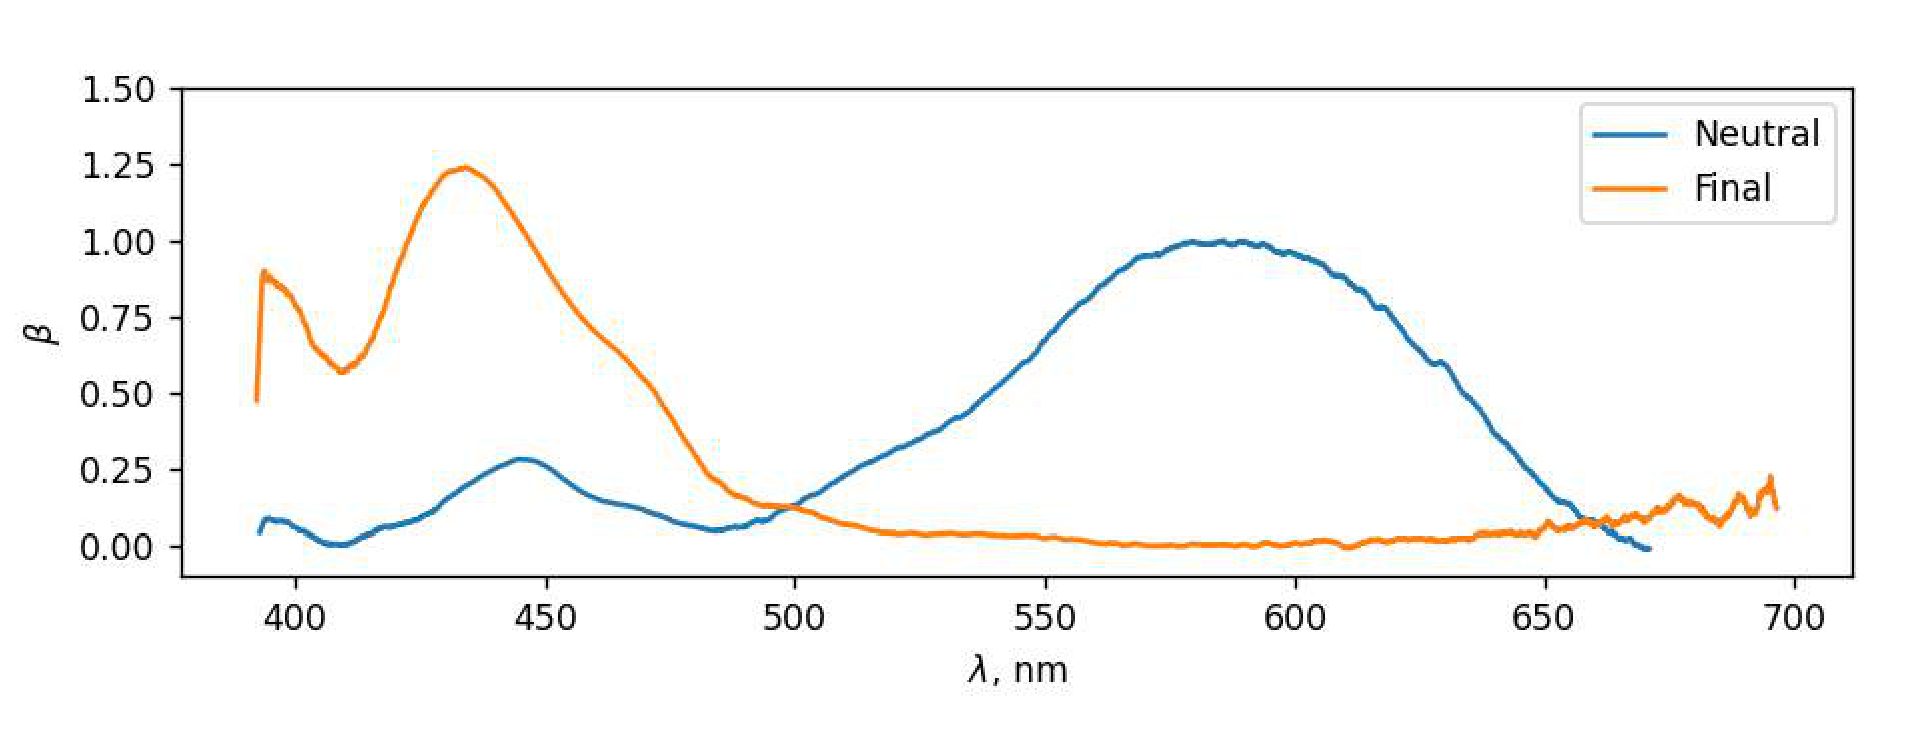
D4 At the time point , the ”neutral” state of IC prevails in the cuvette, that is, the state that indigocarmine has in a neutral medium. The absorption spectrum of the neutral state was received in part B. At the time point , the state of IC in the cuvette was settled. Let us call this state the ”finite”. Its absorption spectrum can be calculated using the formula from D3. Let us plot and on a single graph.
Note that the envelope of these graphs differs from the envelope of the graphs obtained in D3 only by the absence of a peak in the neighborhood of nm. Therefore, IC molecules pass through three states.
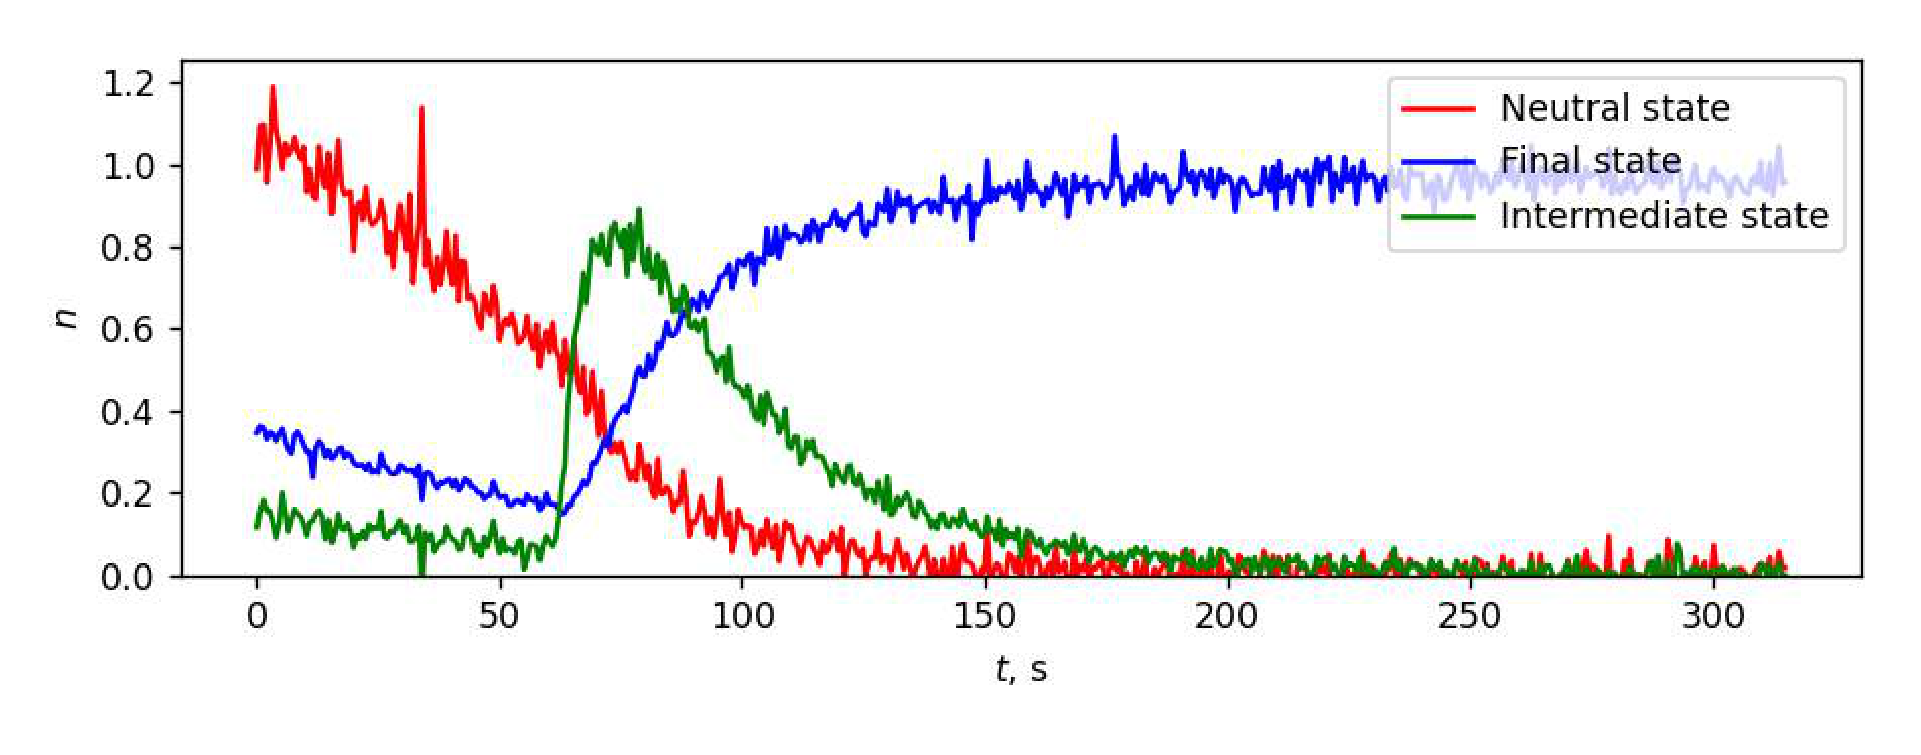
D5 At each time point, a mixture of IC molecules in three states is in the cuvette: neutral (), transitional (), final (). Denote the concentrations of these states by , , , and the corresponding absorption sections by , , . Then according to B5
where
As follows from the graphs obtained in D3, the absorption at the wavelength nm is almost entirely caused by the presence of indigocarmine in the fluid in the first state. Therefore, the concentration of the neutral state IC, expressed in conventional units, can be computed using the formula
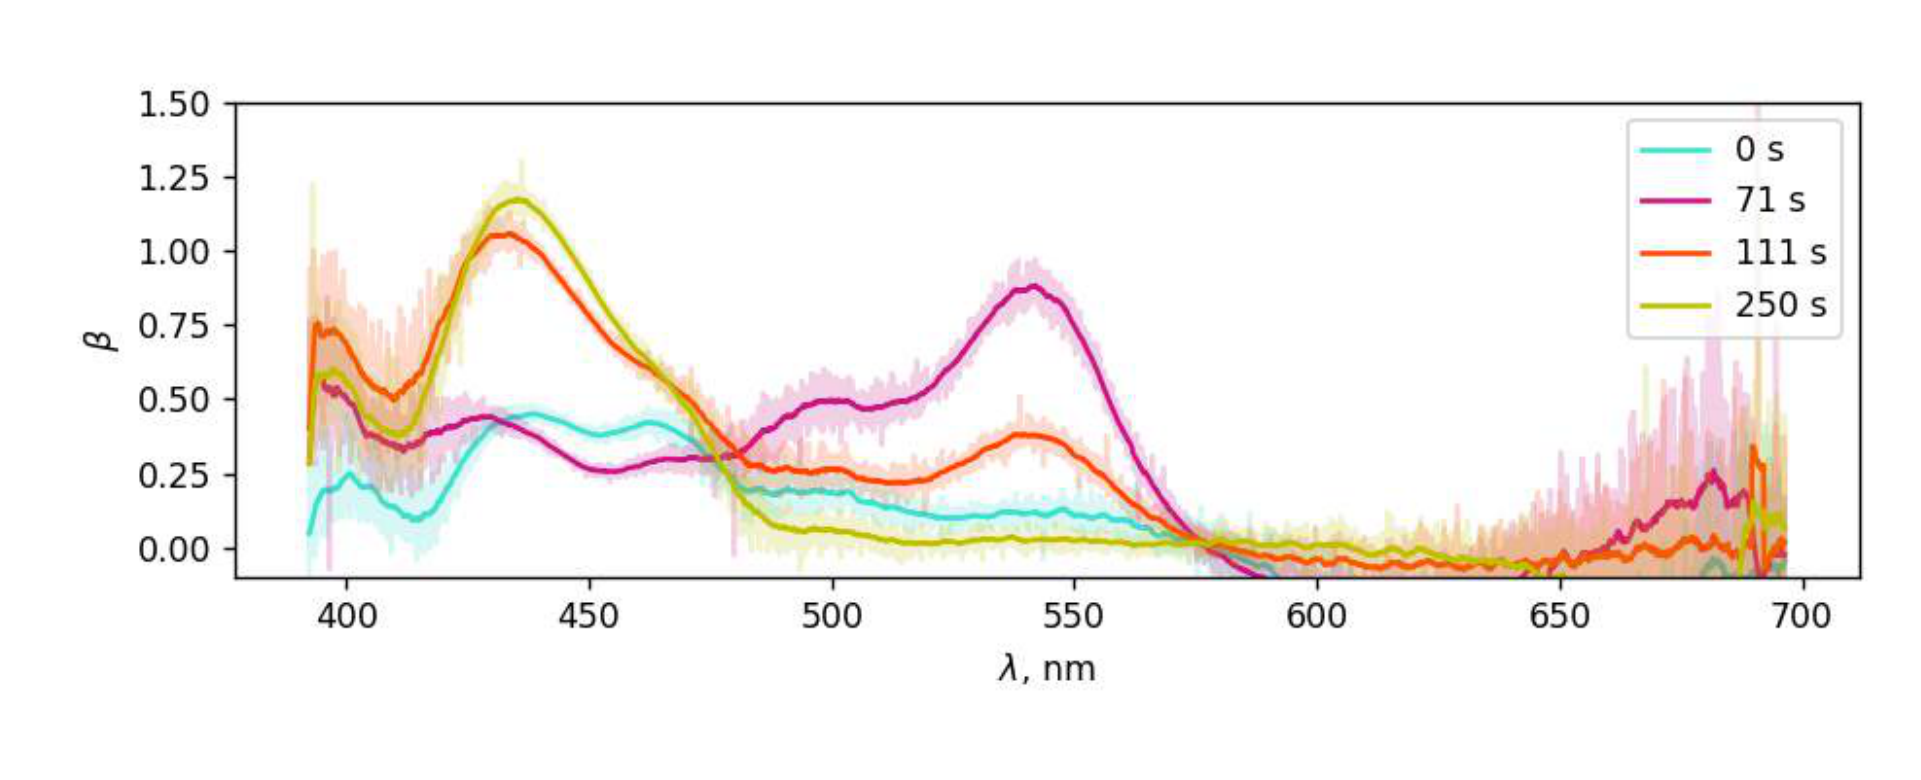
Subtract the contribution of the neutral state to absorption at other wavelengths and plot the functions
where is the absorption cross-section spectrum obtained in B4.
By the time point , only the final state of IC remains in the cuvette. Therefore,
It allows us to subtract the contribution of the final state IC to the absorption spectrum. To do this, let us build the graphs of functions
For similar reasons, the concentrations of each of the states can be computed using the formulas
The graphs of the functions are shown on the figure below.