IZhO 2015, Теория — Задача 1. Plotting
XI International Zhautykov Olympiad -Theoretical Competition- · 13 януари 2015 г. · 7 т.
Внимание: Бележка към темата
The separate answer sheets with figures 1.1, 1.2 and 1.3 of Problem 1 are not included in the archived problems file.
Please read this first:
The time available for the theoretical competition is 4 hours. There are three Problems.
Use only the pen provided.
You can use your own calculator for numerical calculations. If you don’t have one, please ask for it from Olympiad organizers.
You are provided with Writing sheet and additional paper. You can use the additional paper for drafts of your solutions but these papers will not be checked. Your final solutions which will be evaluated should be on the Writing sheets. Please use as little text as possible. You should mostly use equations, numbers, figures and plots.
Use only the front side of Writing sheets. Write only inside the boxed area.
Begin each Problem solution on a separate sheet of paper.
Fill the boxes at the top of each sheet of paper with your country (Country), your student code (Student Code), the question number (Problem Number), the progressive number of each sheet (Page Number), and the total number of Writing sheets used (Total Number of Pages). If you use some blank Writing sheets for notes that you do not wish to be evaluated, put a large X across the entire sheet and do not include it in your numbering.
At the end of the exam, arrange all sheets for each problem in the following order:
- Used Writing sheets in order;
- The sheets you do not wish to be evaluated
- Unused sheets and the printed question.
Place the papers inside the envelope and leave everything on your desk. You are not allowed to take any paper out of the room.
Условие
For each part of this Problem, please, use the provided separate sheets of papers with figures in which you should do all necessary plotting. Plotting and its justification should be made on the same separate sheets.
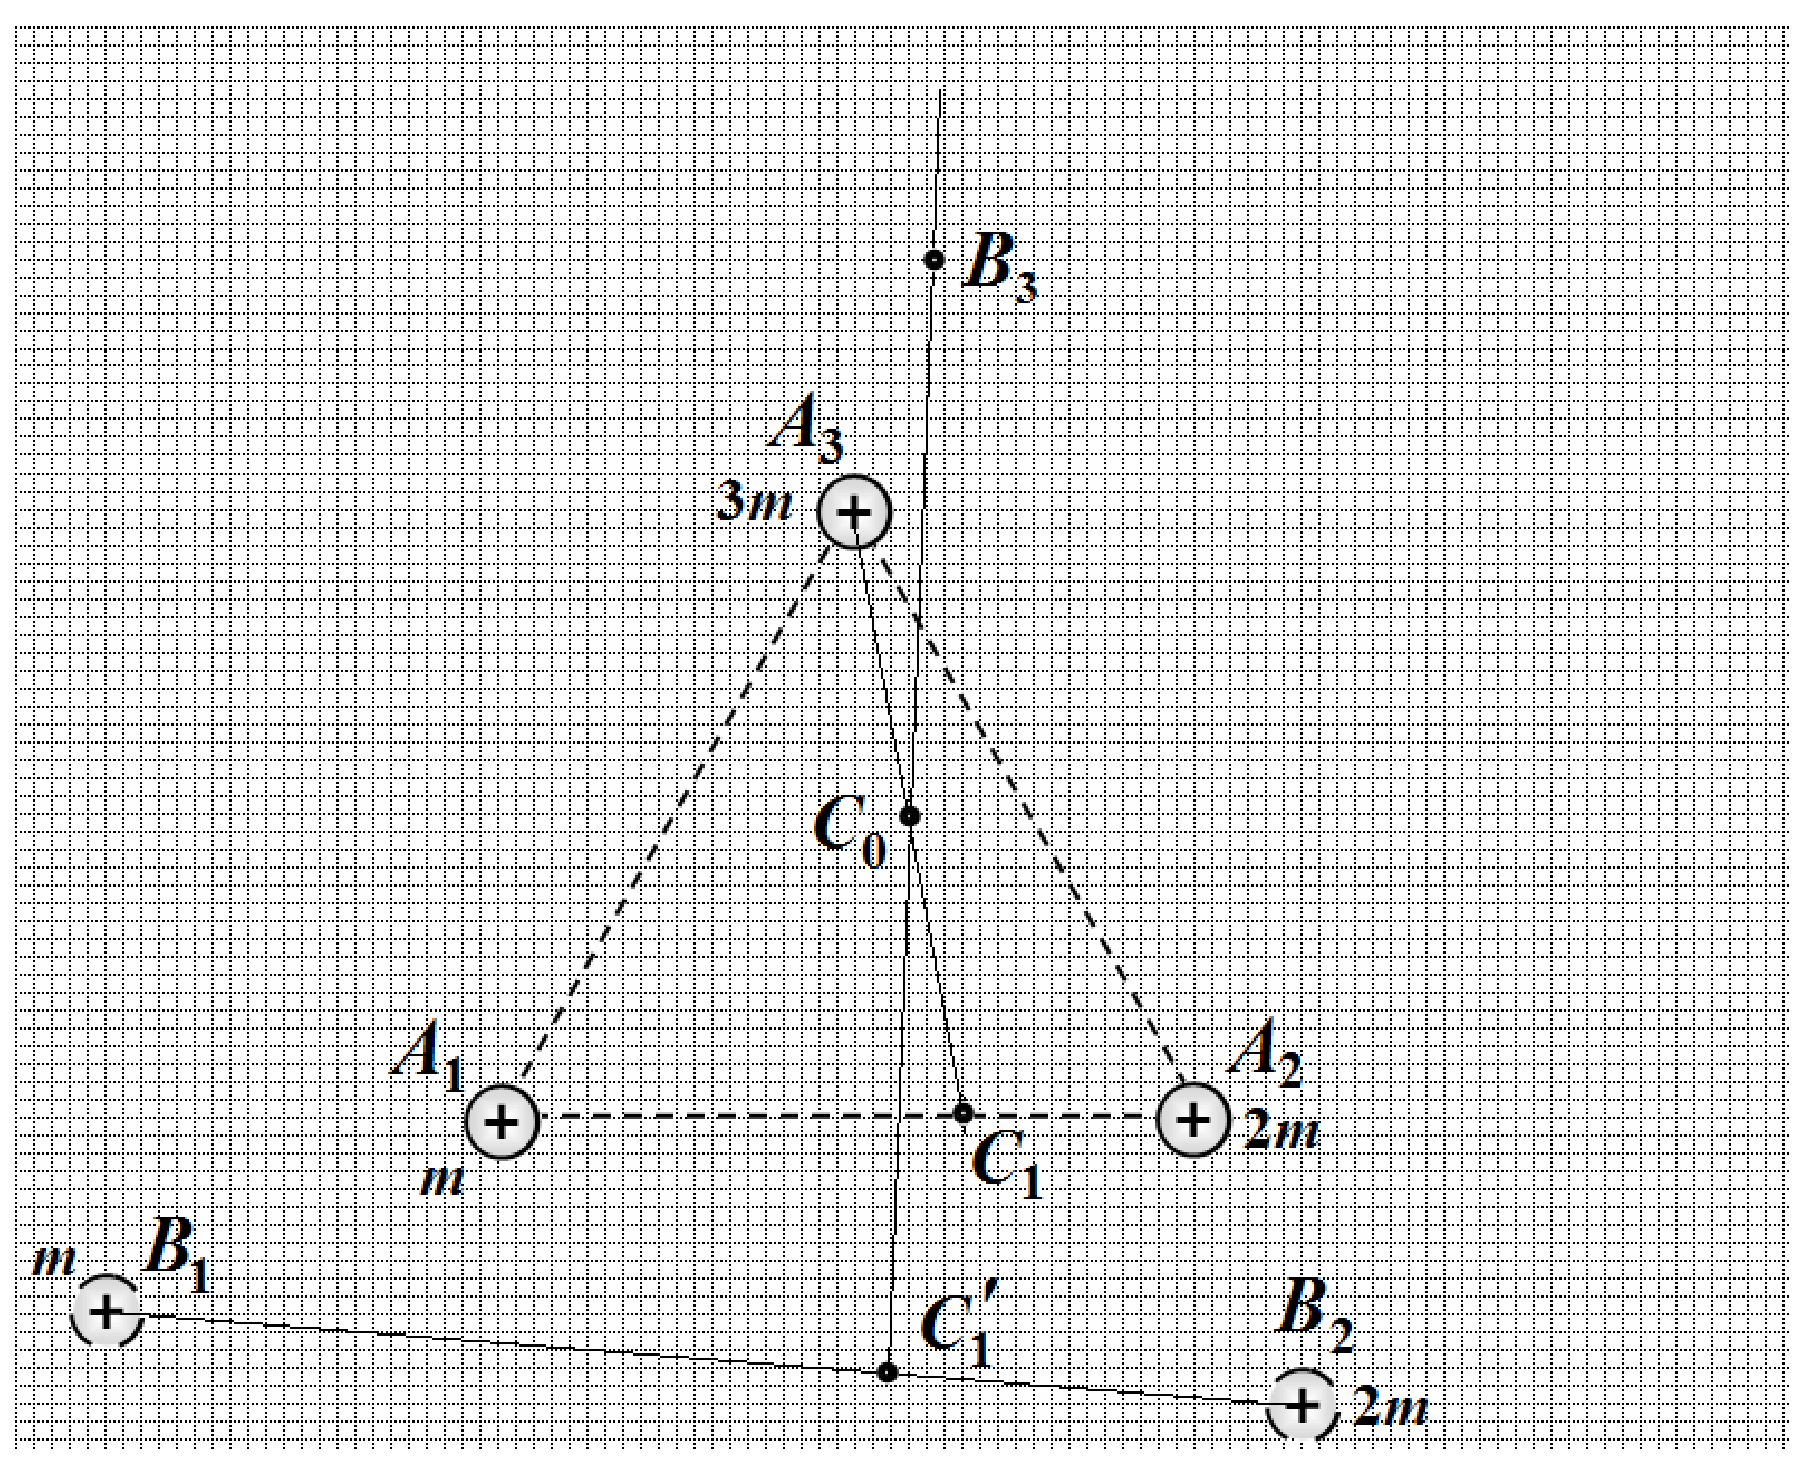
1.1 Three small positively charged balls (whose charges are different) with masses , are connected to each other by inextensible nonconductive threads such that the balls are located at the vertices of the equilateral triangle (see figure 1.1). When the threads connecting balls have been cut down (not simultaneously) all balls start to move on the same plane. In figure 1.1 the positions and of two balls are shown at some time moment. With the help of geometric constructions, indicate position of third ball at the same time moment. [2 т.]
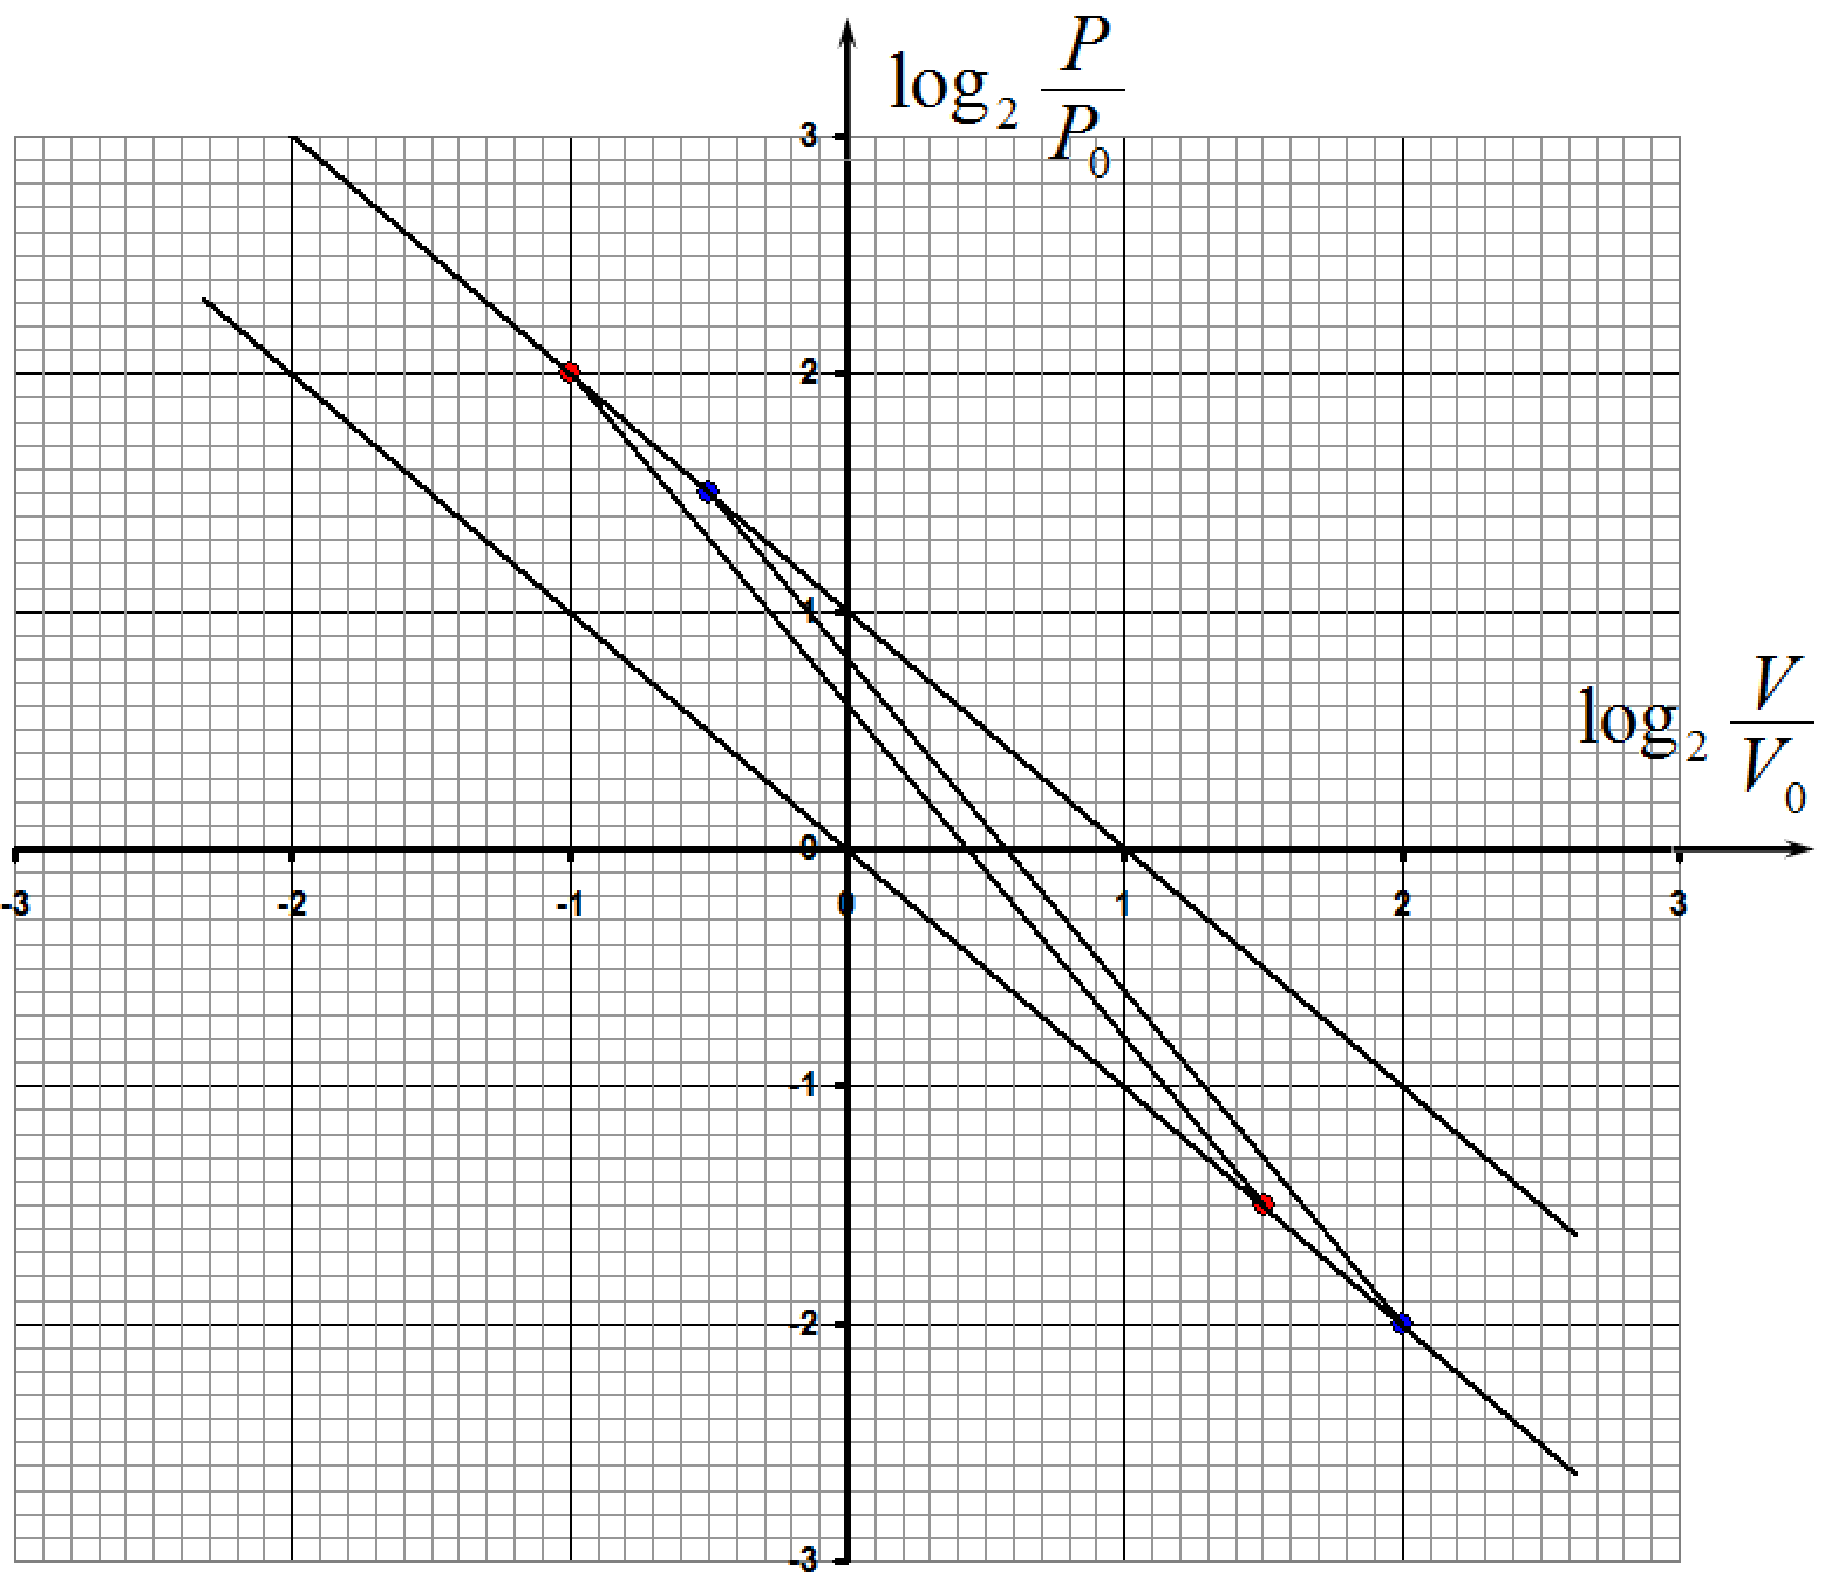
1.2 In figure 1.2, logarithmic scale is used to show straight lines of two processes performed by an ideal diatomic gas ( are some constants). Plot a cyclic process lying in between those lines, which has maximum efficiency. In the same figure, extreme points of that cycle are indicated, with being the point of the minimum volume and being the point of the maximum volume of the gas. Find the efficiency of the cycle. [2 т.]
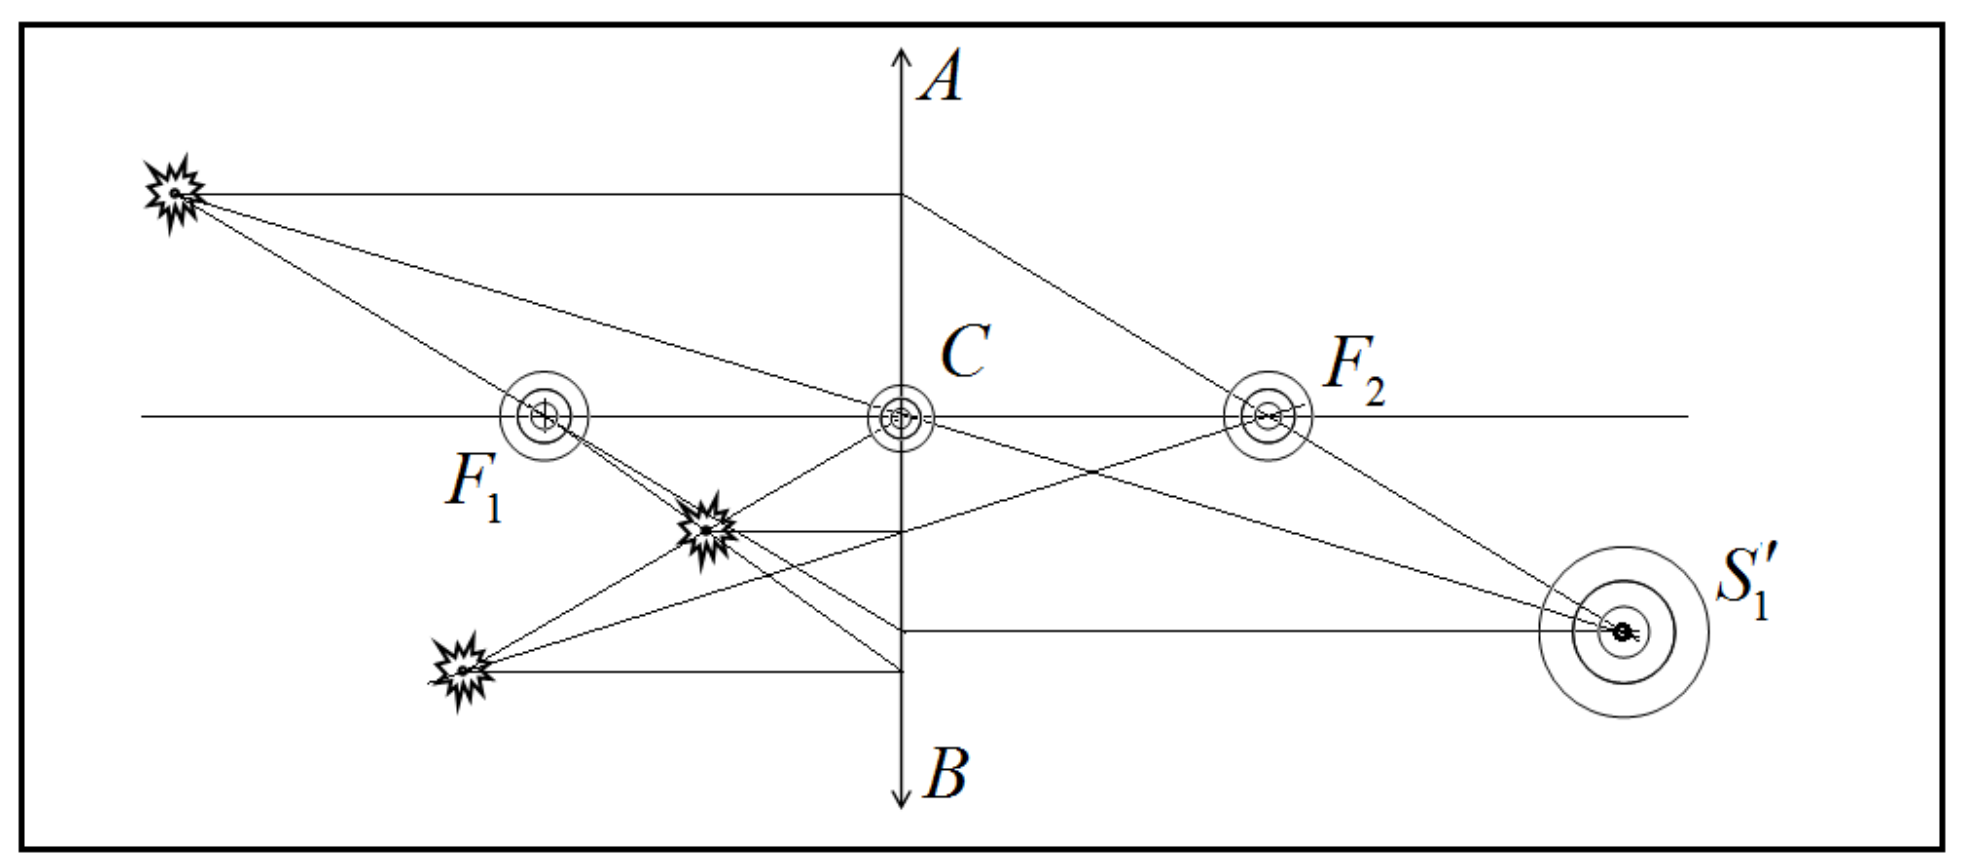
1.3 In figure 1.3, positions are shown of the point light source and its image created by a thin lens. In the same figure, is the main optical axis of the lens. Plot an image of the point source created by the same thin lens. [3 т.]
Отговори
- 1.2
Решение
Problem 1.1
The basic idea is that the center of mass of the whole system remains at rest! First of all, find the center of mass at the initial position: Divide the segment by the ratio of 2:1 (point ); connect with point and cut segment into halves (point ). The point is center of mass of the system. To find the position of the third ball one should do the following: divide the segment by the ratio of 2:1 (point ), write down straight line from to the point of the center of mass , and draw the segment , whose length should be equal to the length of the segment . The point is the position of third ball!
Marking scheme
| 1 | The basic idea of the constancy of the center of mass is formulated | 1,0 |
|---|---|---|
| 2 | Found position of the center of mass - in circle 1; - in circle 2; - in circle 3; | 0,5 (0,3) (0,2) |
| 3 | Found position of the third ball: - in circle 1; - in circle 2; - in circle 3; | 0,5 (0,3) (0,2) |
| Total | 2 |
Problem 1.2
Straight lines, shown in figure 1.2, are isotherms since their slope is equal to . Consequently, their equations have the form
To obtain a cycle with the maximum efficiency it is necessary to build two adiabatic lines through the extreme points, i.e. Carnot cycle. Since the adiabatic equation has the form
where is the adiabatic index of a diatomic gas.
In the logarithmic scale, the latter equation has the form
The graphs of these functions are straight lines with the slope coefficient of . The constant in equation (1) is proportional to the absolute temperature. It follows from the shown graphs that the maximum temperature is 2 times greater than the minimal one, so that the cycle efficiency is
Marking scheme
| 1 | It has been indicated that the straight lines are isotherms | 0,5 |
|---|---|---|
| 2 | Carnot cycle has been taken | 0,2 |
| 3 | Adiabatic equation has been written, including the formulation of it in logarithmic scale | 0,2 0,2 |
| 4 | Straight lines have been properly plotted | 0,6 |
| 5 | The efficiency has been found | 0,3 |
| Total | 2 |
Problem 1.3
Plot straight line to the intersection with the optical axis. This intersection point is the center of the lens.
To determine the positions of focuses, draw the line through point-source parallel to the optical axis, then draw the line through the point of intersection between the ray and the plane of the lens. Then plot the straight line through the point-image to the intersection with the main optical axis: this is the back focus of the lens. Similarly, we find the front focal point. Having focal points determined, finding the image of the second source is carried out in a conventional manner.
Marking scheme
| 1 | The optical center of the lens has been found - in circle 1; - in circle 2; - in circle 3; | 0,5 (0,3) (0,2) |
|---|---|---|
| 2 | Focal points of the lens are found and plotted - in circle 1; - in circle 2; - in circle 3; | 1,0 (0,6) (0,4) |
| 3 | Image of the second source is found and plotted - in circle 1; - in circle 2; - in circle 3; | 1,5 (1,0) (0,5) |
| Total | 3 |
Оригинал в Архива: IZhO-2015-Theory_eng.pdf · официални решения: IZhO-2015-Theory_eng_sol.pdf