IZhO 2019, Експеримент — Задача 1. Absorption of light
XV International Zhautykov Olimpiad/Experimental Competition · 12 януари 2019 г. · 15 т.
Please read the instructions first:
EXPERIMENTAL COMPETITION
12 January, 2019
Please read the instructions first:
The Experimental competition consists of one problem. This part of the competition lasts 3 hours.
Please only use the pen that is provided to you.
You can use your own non-programmable calculator for numerical calculations. If you don’t have one, please ask for it from Olympiad organizers.
You are provided with Writing sheet and additional papers. You can use the additional paper for drafts of your solutions but these papers will not be checked. Your final solutions which will be evaluated should be on the Writing sheets. Please use as little text as possible. You should mostly use equations, numbers, figures and plots.
Use only the front side of Writing sheets. Write only inside the bordered area.
Fill the boxes at the top of each sheet of paper with your country (Country), your student code (Student Code), the question number (Question Number), the progressive number of each sheet (Page Number), and the total number of Writing sheets (Total Number of Pages). If you use some blank Writing sheets for notes that you do not wish to be evaluated, put a large X across the entire sheet and do not include it in your numbering.
At the end of the exam, arrange all sheets for each problem in the following order:
- Used Writing sheets in order.
- The sheets you do not wish to be evaluated.
- Unused sheets.
- The printed problems.
Place the papers inside the envelope and leave everything on your desk. You are not allowed to take any paper or equipment out of the room
Условие
Absorption of light (15.0 points)
Experimental equipment
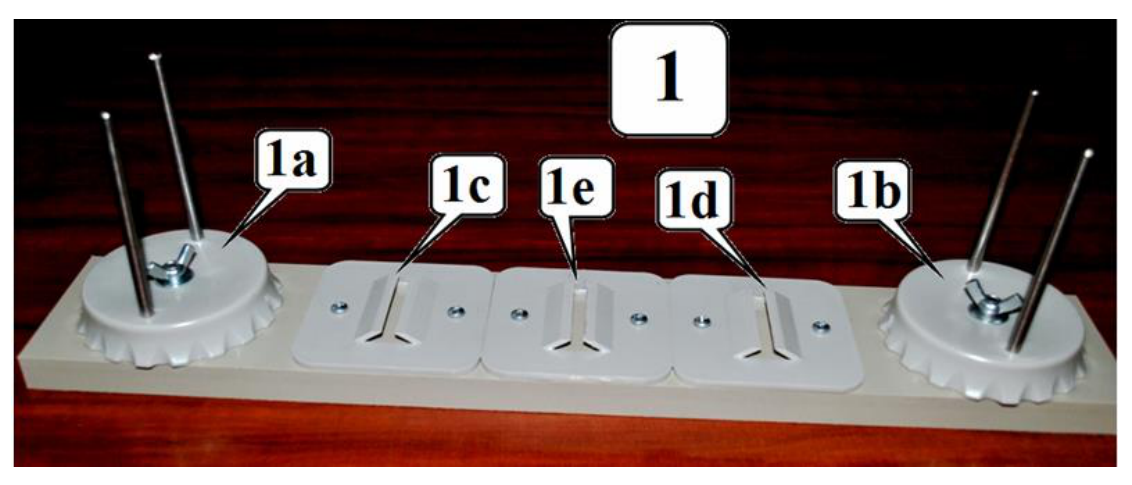
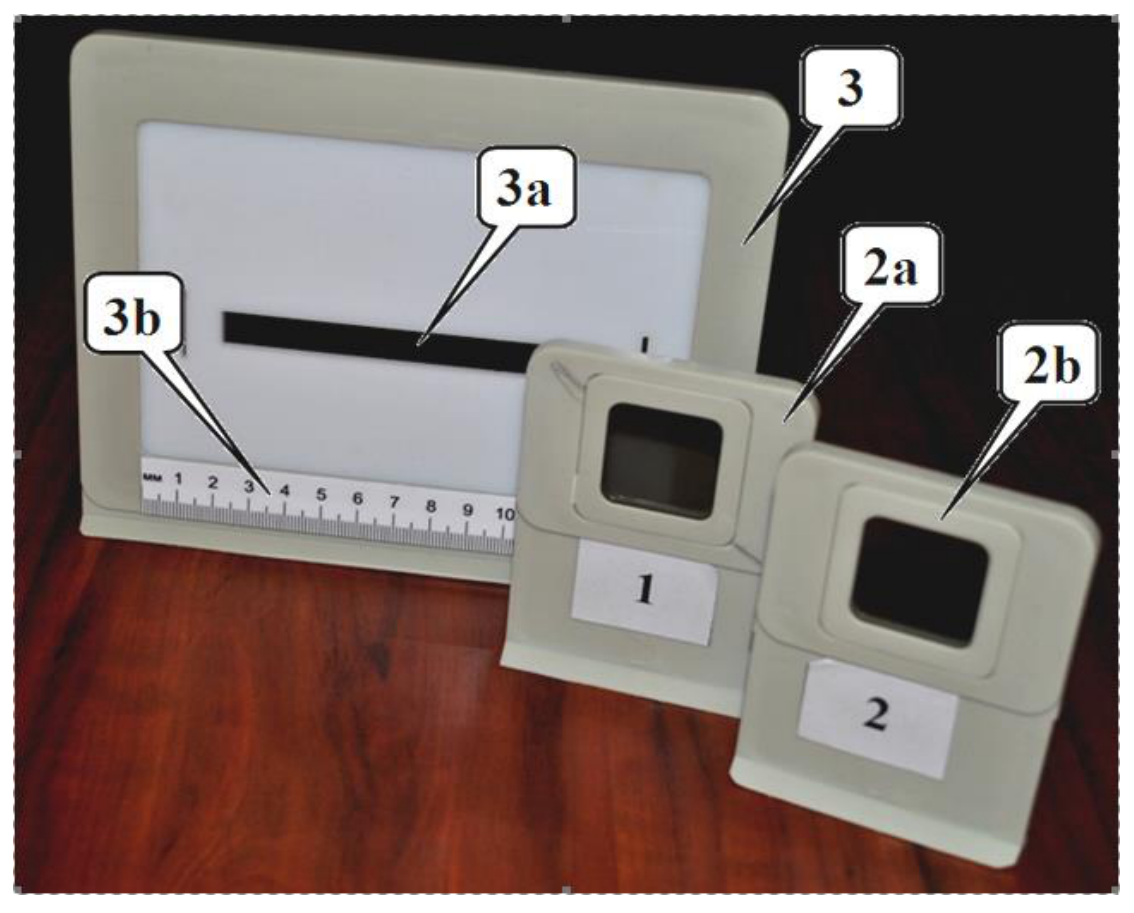
1. Optical bench with holders:
1a – support for a light source with the screw;
1b – support for a photodetector with the screw;
1c, 1d, 1e – holders;
2a – neutral filter on the stand;
2b, 3, 3a, 3b – not used in this experiment;
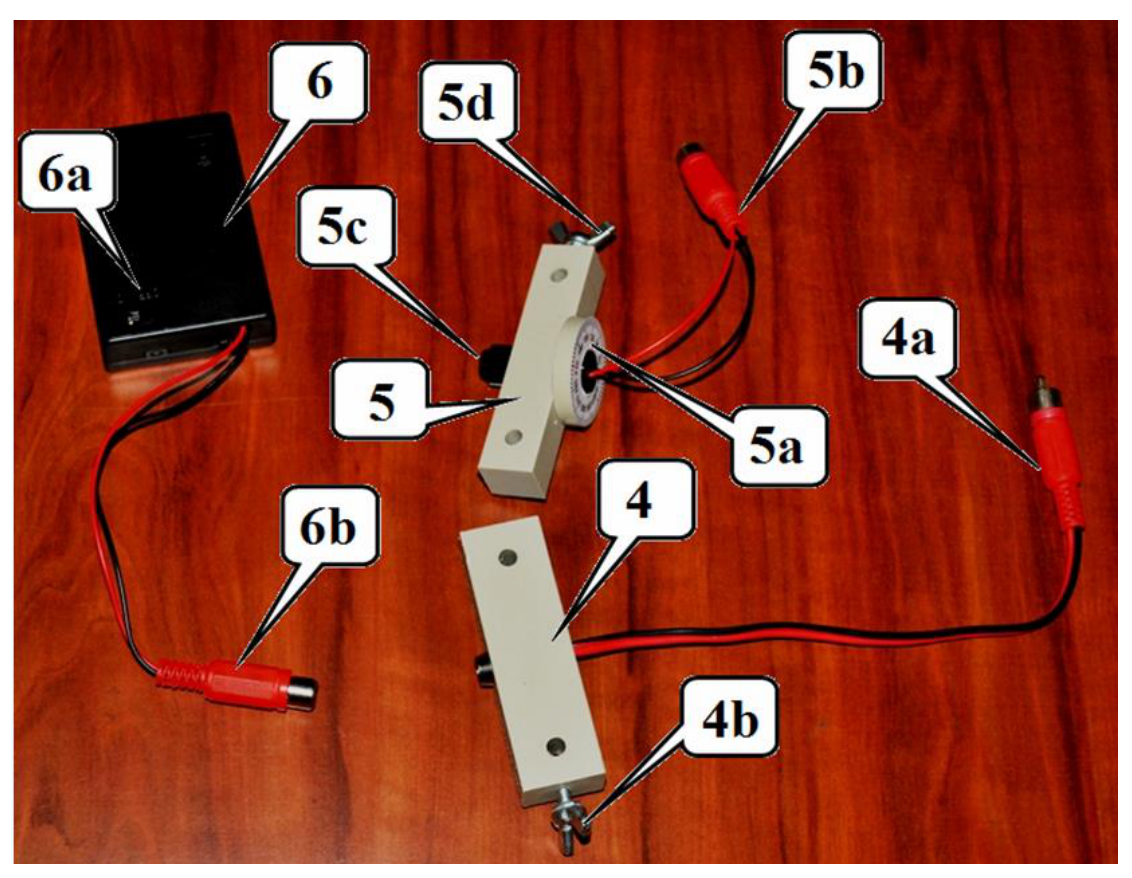
Light sources:
4 – light emitting diode (LED):
4a – leads to a power supply;
4b – fixing screw;
5 – laser:
5a – ring for turning the laser with the scale;
5b – leads to a power supply;
5c –screw for the beam width adjustment on the front side;
5d – fixing screw;
6 – power supply for light sources:
6a – switch;
6b – leads to a light source.
Keep the source operating only while making measurements!
Do not point the laser beam in your or anyone’s eyes, it is very dangerous!
7 – variable resistor 100 kΩ:
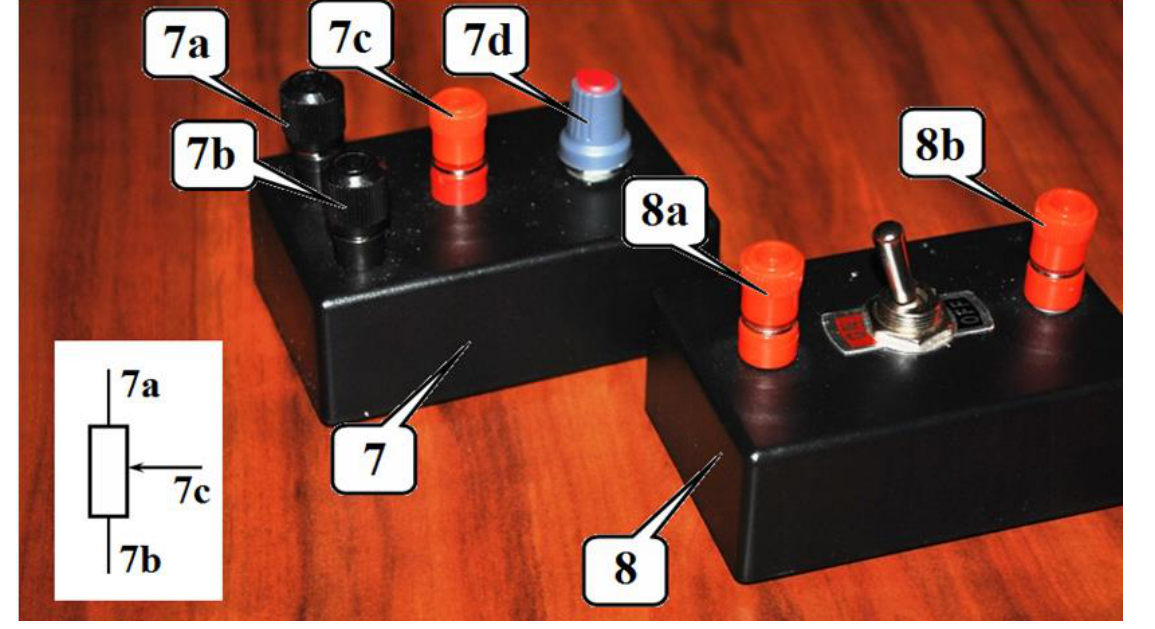
7a, 7b, 7c – terminals for connection to a circuit;
7d – knob for changing the resistance;
8 – switch:
8a, 8b – terminals for connection to a circuit;
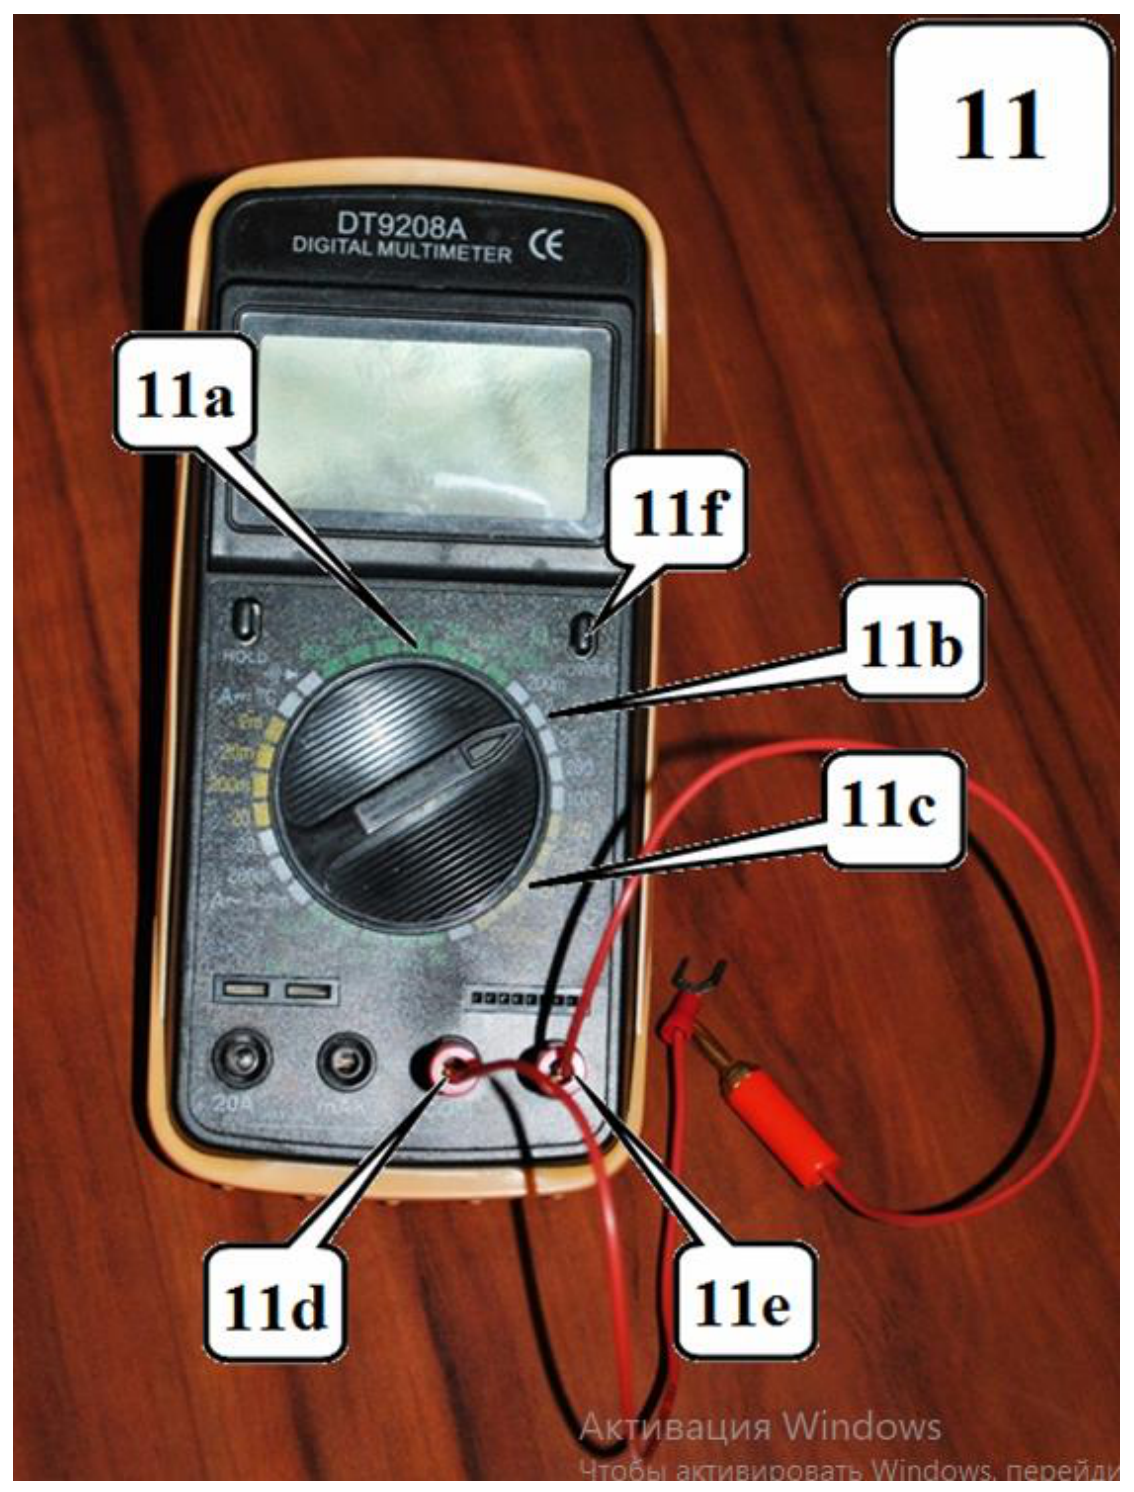
11 – multimeter;
11a – register to measure resistance (100 kΩ);
11b – register to measure DC voltage (2V);
11d, 11e – connectors for test leads;
11f –power on/off.
If the display multimeter is in a "sleep" mode - double-press power on/off!
When measuring the resistance with the multimeter, it must be disconnected with a power supply!
A set of film filters: 5 grey filters, 5 blue filters, 5 yellow filters.
Clothes-peg.
Part 1. Studying a photodetector
To measure the light intensity the photodiode is used hereinafter. The emf, produced when the light falls on the photodiode, depends in a complex way on the intensity of the incident light. Therefore, the circuit, shown in the figure on the right, is used to measure the light intensity. The voltage measured by a multimeter depends on both the intensity of the incident light and the resistance of the variable resistor.
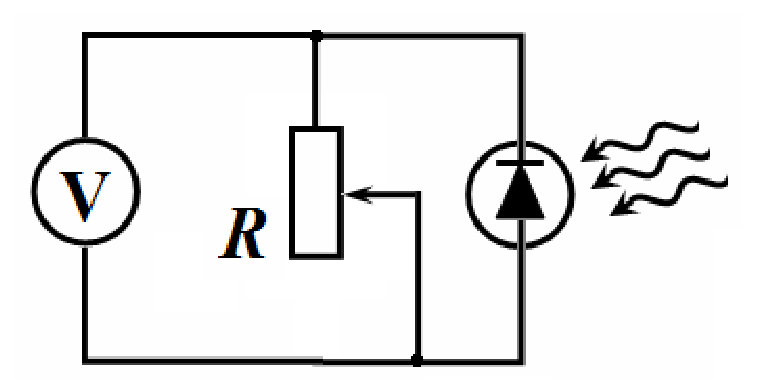
Install the photodetector and the laser on the optical bench. Direct the light beam exactly at the photodetector. Install a neutral filter in one of the holders. Rotating the laser ring, make sure that the voltage across the resistor (at its maximum resistance) is at least 350 mV.
1.1 Modify the circuit shown above by adding the switch, so that you can measure the resistance of the resistor and the voltage across it with the single multimeter provided. Draw schematically the electric circuit that you propose. [0,2 т.]
1.2 Using your electric circuit from 1.1, measure the dependence of the voltage across the resistor on its resistance. [3,5 т.]
1.3 Using the data from 1.2, draw a graph of the voltage across the resistor as a function of its current. [0,9 т.]
1.4 Draw a graph of the heat power generated in the resistor as a function of its resistance. [0,9 т.]
1.5 Determine the resistance of the resistor at which the heat power turns maximal. Make additional measurements, if necessary. [0,5 т.]
Part 2. Absorption of laser radiation
In this part of the experiment, make all measurements with the resistance of the variable resistor approximately equal to 3 kΩ. Write down the value of the resistance at which you have taken your measurements. Install the neutral filter on the optical bench between the laser and the photodetector. Turning the laser ring, make sure that the maximum voltage across the resistor is approximately 180-190 mV. Measure in the range of the multimeter 200mV. In this mode, the voltage on the multimeter is directly proportional to the intensity of the incident light. Hold the light filters with the clothes-peg and hold them directly near the photodetector.
The intensity of the light transmitted through the filter is proportional to the intensity of the incident light :
The transmittance does not depend on the intensity of the incident light but may depend on its wavelength.
2.1 Using formula (1), obtain the dependence of the intensity of transmitted light through identical light filters on the number of light filters. [0,2 т.]
2.2 Measure the dependence of the light intensity on the number of filters for all the filters provided (gray, yellow and blue). Draw graphs of the dependencies obtained in scales that allow you to verify the formula obtained in Section 2.1. [2,6 т.]
2.3 Calculate the transmittance of all filters. Estimate the experimental errors of their values. [1,4 т.]
2.4 Measure the transmittance for pairs of different filters: gray + blue, gray + yellow; blue + yellow. Theoretically calculate the transmittance of each pair of filters. [1,3 т.]
Part 3. Absorption of white light
Replace the laser with the LED which is a source of white light. Remove the neutral filter. Direct the radiation of the LED straight at the photodetector. Set the resistance of the resistor to approximately 10 kΩ. Write down the value of the resistance at which you have taken your measurements.
3.1 Measure the dependence of the light intensity on the number of filters for all types of filters provided (gray, yellow and blue). Draw graphs of these dependencies in the same scale as in Part 2. [1,9 т.]
3.2 Verify whether the formula obtained in paragraph 2.1 is fulfilled for the white light source. Specify a main cause leading to possible violations of that relation. [0,3 т.]
3.3 Measure the transmittance for pairs of different filters: gray + blue, gray + yellow; blue + yellow. Using the data obtained in the whole experiment, verify whether the transmittance of a pair of filters is equal to the product of the transmittances of each filter. [1,3 т.]
Отговори
1.5 5.4 kΩ
Experimental value from the official solution; the marking scheme accepts a maximum in the range of 5-6 kΩ.
2.1
Решение
SOLUTION TO THE EXPERIMENTAL COMPETITION
Absorption of light (15,0 балла)
Part 1. Studying a photodetector
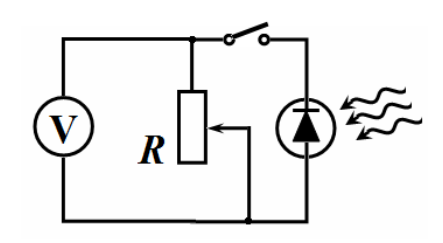
1.1 The working measurement circuit is shown in the figure on the right. When the switch is shortened, the multimeter should be switched to the voltage measurement mode, i.e. the voltage across the resistor is measured. When the switch is open, the multimeter should be switched to the ohmmeter mode, the resistance is measured.
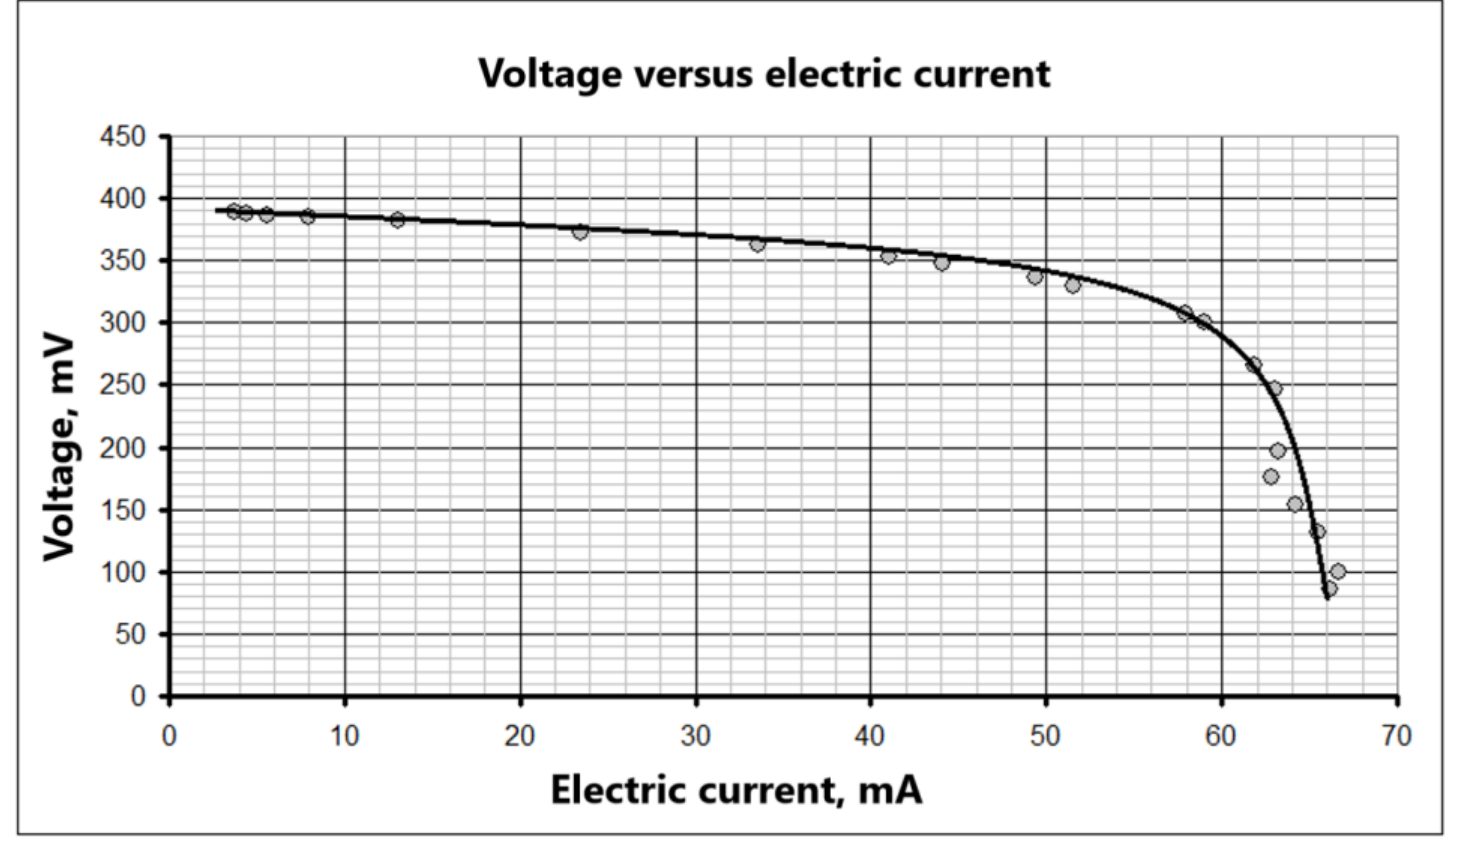
1.2 – 1.5 The results of the measurement of the voltage across the resistor as a function of its resistance are shown in Table 1. It also presents the results of calculations of the current using the formula
and the heat power generated in the resistor and calculated via the expression
Table 1
| R, kΩ | U, mV | I, μA | P, μW |
|---|---|---|---|
| 104 | 389 | 3,74 | 1,46 |
| 87,4 | 388 | 4,44 | 1,72 |
| 69,5 | 387 | 5,57 | 2,15 |
| 48,5 | 385 | 7,94 | 3,06 |
| 29,3 | 382 | 13,04 | 4,98 |
| 15,9 | 373 | 23,46 | 8,75 |
| 10,8 | 363 | 33,61 | 12,20 |
| 8,6 | 353 | 41,05 | 14,49 |
| 7,9 | 348 | 44,05 | 15,33 |
| 6,8 | 336 | 49,41 | 16,60 |
| 6,4 | 330 | 51,56 | 17,02 |
| 5,3 | 307 | 57,92 | 17,78 |
| 5,1 | 301 | 59,02 | 17,76 |
| 4,3 | 266 | 61,86 | 16,45 |
| 3,9 | 246 | 63,08 | 15,52 |
| 3,1 | 196 | 63,23 | 12,39 |
| 2,8 | 176 | 62,86 | 11,06 |
| 2,4 | 154 | 64,17 | 9,88 |
| 2 | 131 | 65,50 | 8,58 |
| 1,5 | 100 | 66,67 | 6,67 |
| 1,3 | 86 | 66,15 | 5,69 |
The graph of the voltage across the resistor versus its current is shown in the figure below.
The graph of the heat power in the resistor versus its resistance is shown in the figure below.
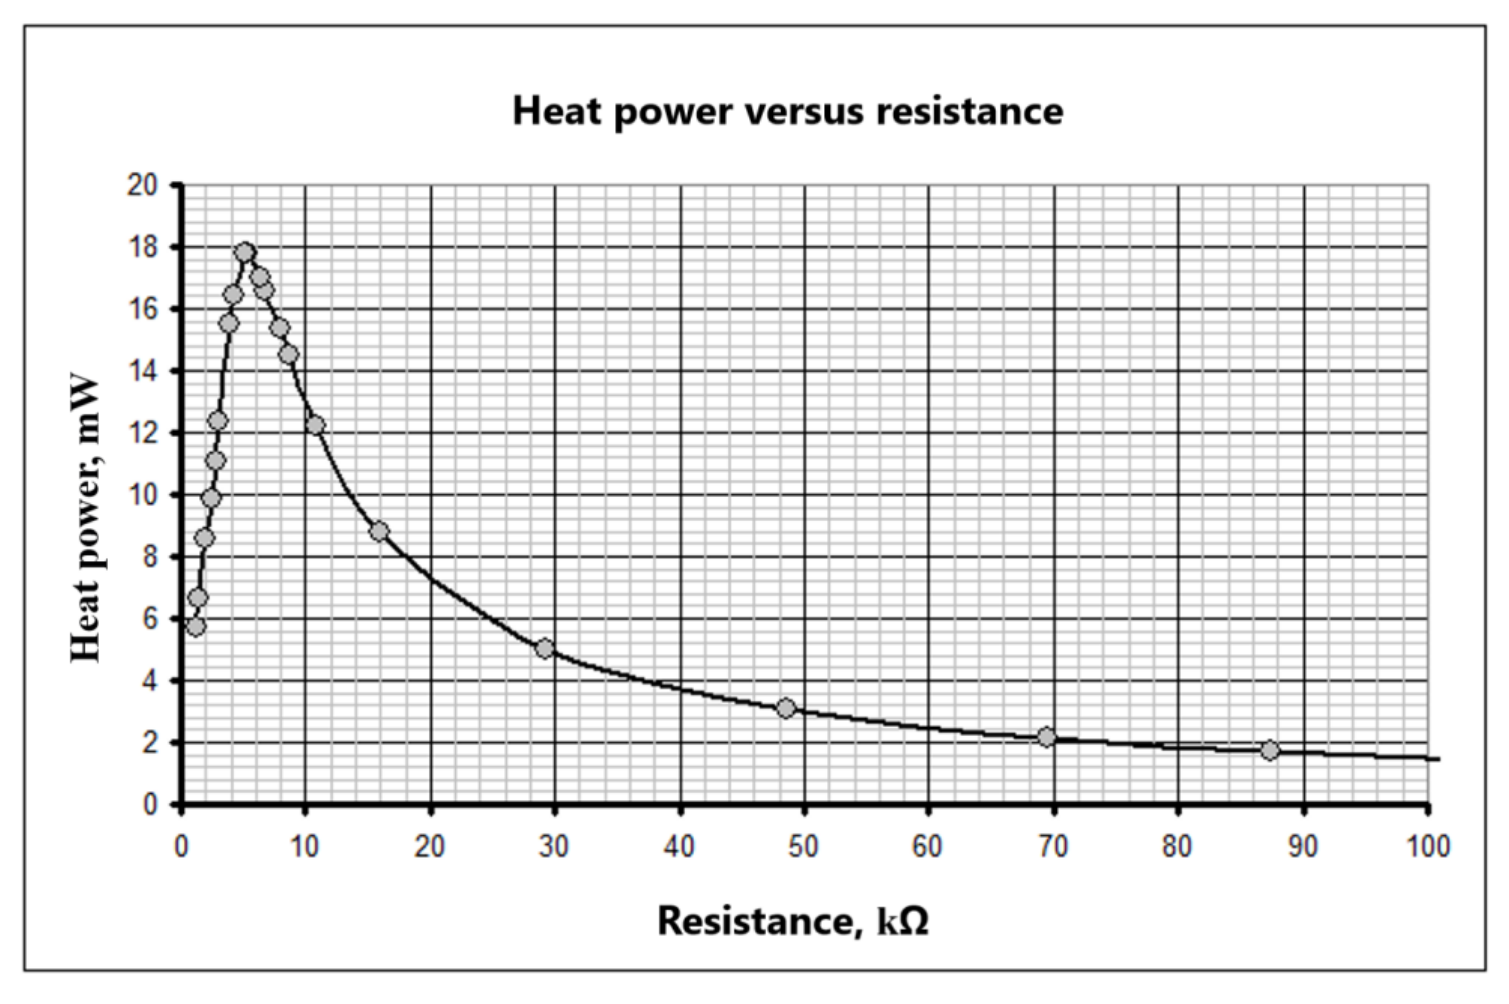
To determine the position of the maximum, it is necessary to take additional measurements in the range of 0 to 10 kΩ. According to the measurement results, it turns out that the maximum heat power generated in the resistor is reached at
Part 2. Absorption of laser radiation
2.1 Since the transmittances of the same type of light filters are equal, and the laser radiation is monochromatic, the dependence of the transmitted light intensity on the number of filters has the form of a geometric progression
2.2 The results of measurements of the dependence of the light intensity on the number of filters are given in Table 2. The measurements have been carried out at the resistance of 3.3 kΩ.
Table 2
| grey filter | yellow filter | blue filter | grey filter | yellow filter | blue filter | ||
|---|---|---|---|---|---|---|---|
| n | U, mV | U, mV | U, mV | n | Ln U | Ln U | Ln U |
| 0 | 196 | 197 | 197 | 0 | 5,28 | 5,28 | 5,28 |
| 1 | 104 | 180 | 74 | 1 | 4,64 | 5,19 | 4,30 |
| 2 | 50 | 161 | 24,9 | 2 | 3,91 | 5,08 | 3,21 |
| 3 | 25,4 | 148 | 9 | 3 | 3,23 | 5,00 | 2,20 |
| 4 | 13,6 | 135 | 3,6 | 4 | 2,61 | 4,91 | 1,28 |
| 5 | 6,6 | 128 | 5 | 1,89 | 4,85 |
To verify formula (4) it is convenient to present it in the semi-log scale as
At such a scale, the dependence of on the number of light filters should be linear. The measurements and calculations confirm this conclusion, i.e. formula (4) correctly describes the intensity of the transmitted light. The figure below shows the results obtained.
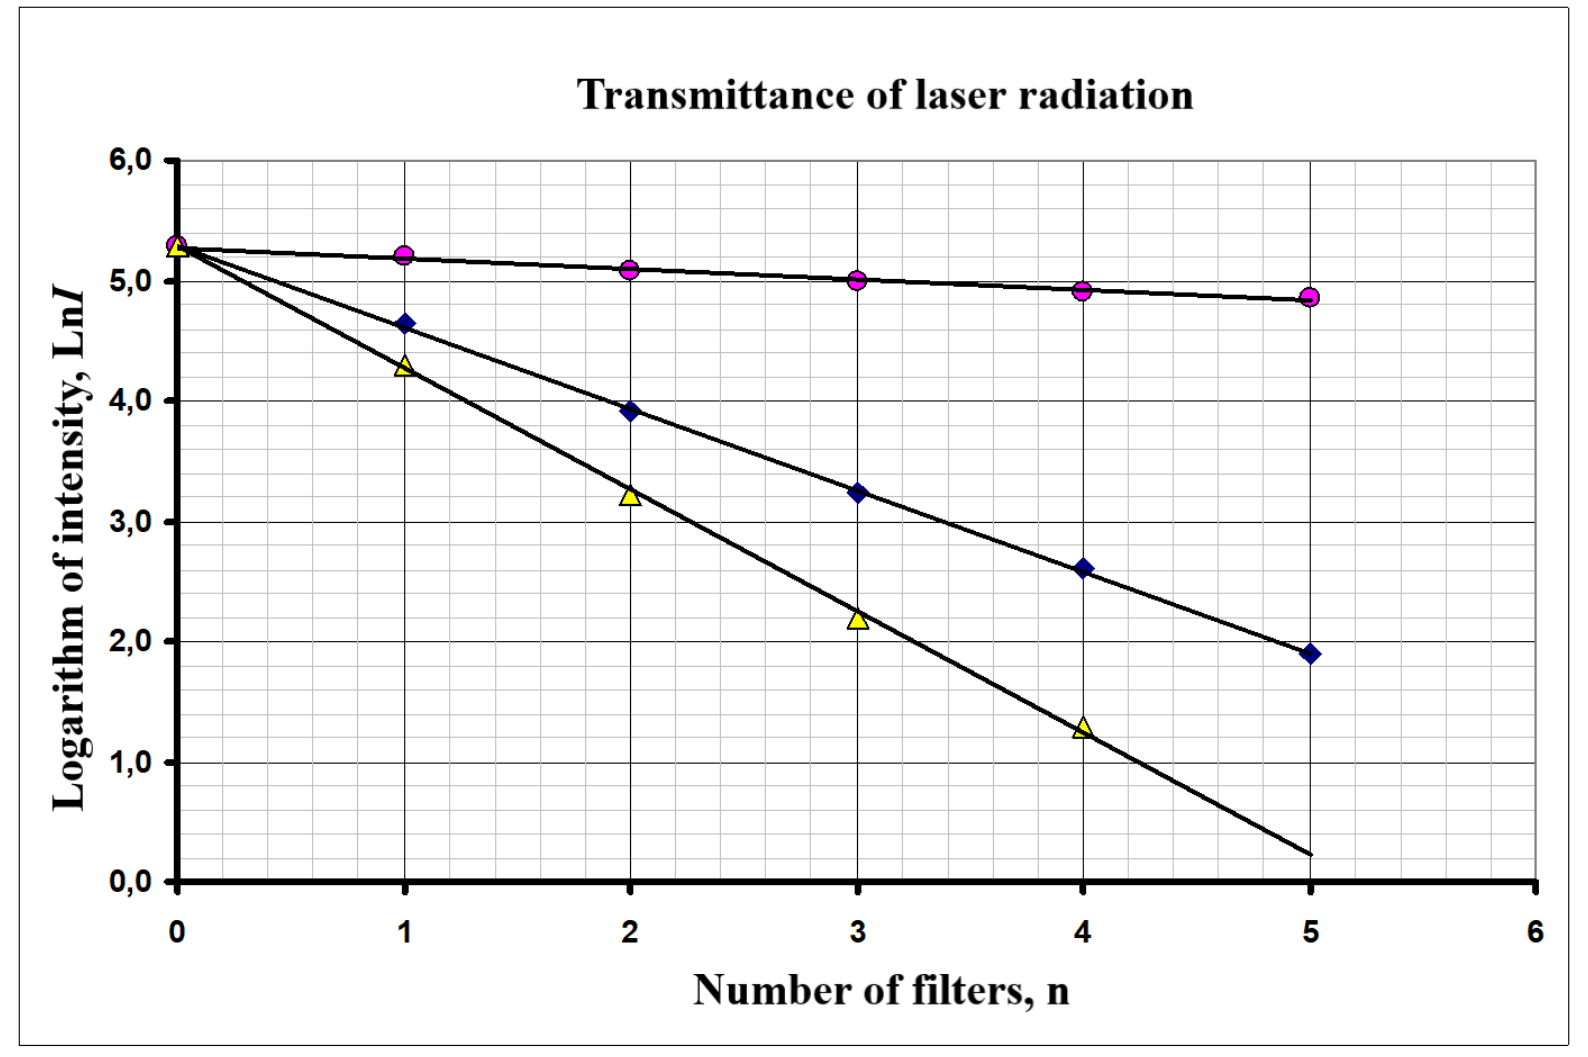
2.3 As it follows from formula (5), the slope of the dependence is equal to the logarithm of the transmittance
therefore, the transmittance is calculated by the formula
and its error is determined by the expression
Table 3 shows the results of calculations (using the least squares method) of the slope coefficients , their errors , the transmittances and their errors for all three types of light filters.
Table 3
| grey filter | yellow filter | blue filter | |
|---|---|---|---|
| -0,678 | -0,089 | -1,011 | |
| 0,014 | 0,008 | 0,032 | |
| 0,508 | 0,915 | 0,364 | |
| 0,007 | 0,007 | 0,012 |
2.4 The transmittance of a pair of filters for the laser monochromatic radiation is equal to the product of the transmittances of each filter:
Table 4 shows the measured and calculated transmittances for all pairs. As it follows from the data presented, there is a good agreement between these results, i.e. formula (9) is experimentally verified.
Table 4
| Pair of filters | measured | calculated | ||
|---|---|---|---|---|
| blue + yellow | 0,342 | 0,333 | ||
| blue + grey | 0,187 | 0,185 | ||
| yellow + grey | 0,460 | 0,464 |
Part 3. Absorption of white light
3.1 The results of measurements of the light intensity transmitted through the filters are shown in Table 5. (the measurements have been made with the resistance of 10.1 kΩ).
Table 5
| grey filter | yellow filter | blue filter | grey filter | yellow filter | blue filter | ||
|---|---|---|---|---|---|---|---|
| n | U, mV | U, mV | U, mV | n | Ln U | Ln U | Ln U |
| 0 | 84,8 | 77,8 | 72,6 | 0 | 4,44 | 4,35 | 4,28 |
| 1 | 39,4 | 59,4 | 31,7 | 1 | 3,67 | 4,08 | 3,46 |
| 2 | 17,9 | 50,8 | 19,2 | 2 | 2,88 | 3,93 | 2,95 |
| 3 | 8,4 | 44,5 | 14 | 3 | 2,13 | 3,80 | 2,64 |
| 4 | 3,8 | 39,2 | 10,8 | 4 | 1,34 | 3,67 | 2,38 |
| 5 | 35 | 8,7 | 5 | 3,56 | 2,16 |
The graphs of these dependencies are shown in the figure below.
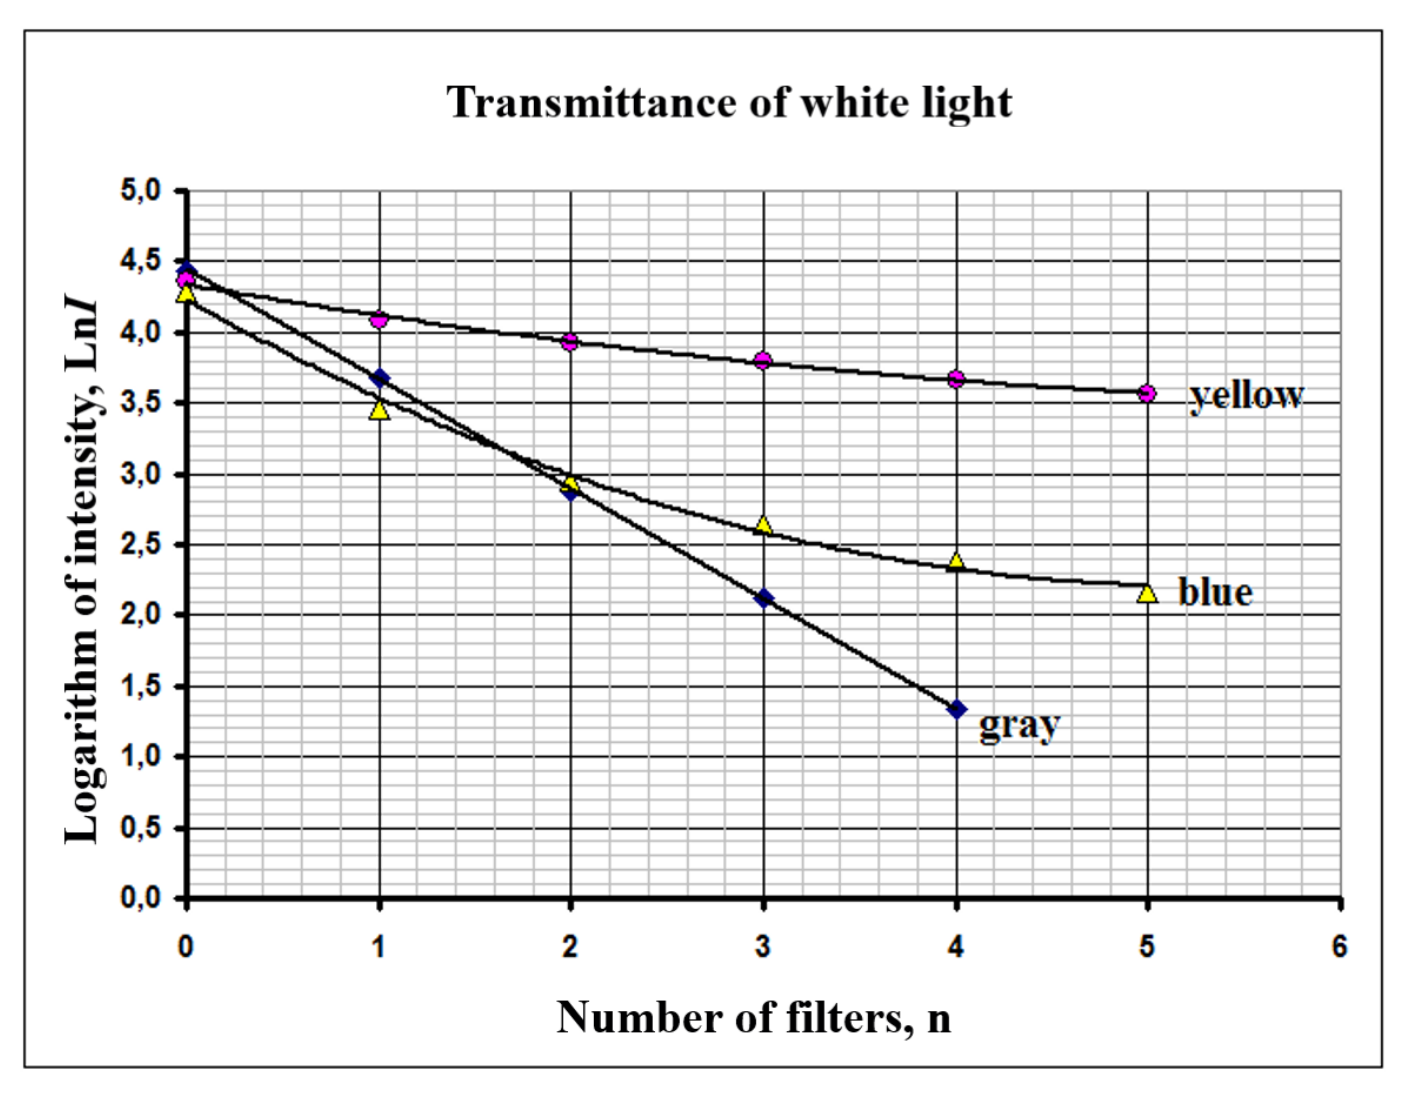
3.2 It can be seen from the graph that formula (5) is correct for grey filters, but not for blue ones. The main reason for the violation of the obtained law is that the transmittance significantly depends on the wavelength of incident light. So, for grey filters, the transmittance varies little in the visible range of wavelength and formula (5) is applicable within the experimental error. For blue filters, though, the transmittance varies noticeably, such that formula (5) turns inapplicable.
3.3 The measured transmittances for the three light filters provided are given in Table 6.
Table 6
| grey filter | 0,450 |
| blue filter | 0,431 |
| yellow filter | 0,759 |
Table 7 shows the measured and calculated transmittances of pairs of light filters. It can be seen that for the white source the transmittance of a pair of filters is not equal to the product of transmittances of each filter, which is prescribed to the dependence of transmittances on the wavelength.
Table 7
| Pair of filters | measured | calculated | ||
|---|---|---|---|---|
| blue + yellow | 0,271 | 0,327 | ||
| blue + grey | 0,188 | 0,194 | ||
| yellow + grey | 0,362 | 0,342 |
Marking scheme
| Part | Content | Total for part | Points |
|---|---|---|---|
| Part 1. Studying a photodetector | 6,0 | ||
| 1.1 | Switch in the right place | 0,2 | 0,2 |
| 1.2 | Measurements : | 3,5 | |
| Marked only if data are within 50% from the provided in the official solution: | |||
| - maximumal voltage no more than 350 mV; | 0,2 | ||
| - maximumal resistance no more than 90 kΩ; | 0,2 | ||
| - minimal resistance less than 2 kΩ; | 0,2 | ||
| - number of points 15 or more (10-14, 7- 9, less); | 2(1;0,5;0) | ||
| - not less than 5 points in the range of 0-10 kΩ; | 0,5 | ||
| - monotonically decreasing dependence; | 0,2 | ||
| - units stated correctly (kΩ. mV); | 0,1+0,1 | ||
| 1.3 | Load characteristic: | 0,9 | |
| (marked only if 1.2 had been marked) | |||
| - formula to calculate electric current; | 0,1 | ||
| - current calculated for all experimental points; | 0,2 | ||
| - unit of current stated (μA); | 0,1 | ||
| - correct qualitative behavior (slow decrease followed by sharp decline); | 0,2 | ||
| Plotting a graph: | |||
| - axis named and ticked; | 0,1 | ||
| - all points correctly drawn; | 0,1 | ||
| - smooth curve drawn; | 0.1 | ||
| 1.4 | Heat power versus resistance: | 0,9 | |
| (marked only if 1.2 had been marked) | |||
| - formula to calculate heat power; | 0,1 | ||
| - heat power calculated for all experimental points; | 0,2 | ||
| - correct unit of heat power (μW); | 0,1 | ||
| - correct qualitative behavior (maximum in the rage of 0-10 kΩ followed by slow decrease); | 0.2 | ||
| Plotting a graph: | |||
| - axis named and ticked; | 0,1 | ||
| - all points correctly drawn; | 0,1 | ||
| - smooth curve drawn; | 0,1 | ||
| 1.5 | Maximum found In the range of 5-6 kΩ (4-7 kΩ, out of) | 0,5 | 0,5 (0,3;0) |
| Part 2. Absorption of laser radiation | 5,5 | ||
| 2.1 | Formula | 0,2 | 0,2 |
| 2.2 | Transmittance measurements | 2,6 | |
| Marked only if data are within 50% from the provided in the official solution: | |||
| - Measurements in the range of 0-200 mV; | 0,1 | ||
| - Initial measurement without filters; | 0,1x3=0,3 | ||
| - measurements with 5 (4) filters; | 0,3x3=0,9 | ||
| - decreasing dependence obtained; | 0,1x3=0.3 | ||
| Linearization | |||
| - Correct semi-log scale; | 0,2 | ||
| - logarithms calculated for all points; | 0,2 | ||
| Plotting a graph (marked only if measurements had been marked):: | |||
| - axis named and ticked; | 0,1 | ||
| - all points correctly drawn; | 0,1 | ||
| - straight line drawn; | 0.1 | ||
| Linear dependence obtained; | 0,3 | ||
| 2.3 | Formula for the transmittance | 1,4 | 0,1 |
| Formula for the experimental error ; | 0,1 | ||
| Calculations for all points (LSM, averaging); | 0,3 | ||
| (Calculations for 2 points only); | 0,1 | ||
| Transmittances found: | |||
| Gray in the range of 0,45-0,55 (0,4 -0,6; out of) | 0,2 (0,1;0) | ||
| Yellow in the range of 0,85-0,95 (0,8-0,98; out of) | 0,2 (0,1;0) | ||
| Blue in the range of 0,30-0,40 (0,25-0,45; out of) | 0,2 (0,1;0) | ||
| Experimntal errors found | 0,1x3=0,3 | ||
| 2.4 | Measurement of transmittance | 1,3 | |
| Gray+yellow in the range of 0,30-0,40 (0,25-0,45; out of) | 0,2 (0,1;0) | ||
| Blue+gray in the range of 0,15-0,25 (0,10-0,30; out of) | 0,2 (0,1;0) | ||
| Gray +yellow in the range of 0,40-0,50 (0,35 – 0,55; out of); | 0,2 (0,1;0) | ||
| Formula ; | 0,1 | ||
| Products found; | 0,1x3=0,3 | ||
| Experimental results agree with the theory; | 0.1x3=0,3 | ||
| Part 3. Absorption of white light | 3,5 | ||
| 3.1 | Transmittance measurements | 1,9 | |
| Marked only if data are within 50% from the provided in the official solution: | |||
| - Measurements in the range of 0-100 mV; | 0,1 | ||
| - Initial measurement without filters; | 0,1x3=0,3 | ||
| - measurements with 5 (4) filters; | 0,2x3=0,6 | ||
| - logarithms calculated for all points; | 0,3 | ||
| Plotting a graph (marked only if measurements are marked): | |||
| - axis named and ticked; | 0,1 | ||
| - all points correctly drawn; | 0,1 | ||
| - smooth curve drawn; | 0,1 | ||
| Linear dependence for gray filter; | 0,1 | ||
| Nonlinear dependence for blue filter | 0,2 | ||
| 3.2 | Theroretical formula not confirmed | 0,3 | 0,1 |
| Reason: transmittance depends on the wavelength | 0,2 | ||
| 3.3 | Transmittance measurements | 1,3 | |
| Gray filter in the range of 0,4-0,5 (0,35-0,55; out of) | 0,2 (0,1;0) | ||
| Blue filter in the range of 0,4-0,5 (0,35-0,55; out of) | 0,2 (0,1;0) | ||
| Yellow filter in the range of 0,7 – 0,8 (0,65 – 0,85; out of) | 0,2 (0,1;0) | ||
| Blue+yellow filters in the range of 0,22-0,3 (0,18 -3,5;out of) | 0,2 (0,1;0) | ||
| Blue+gray filters in the range of 0,14-0,23 (0,1 -0,27;out of) | 0,2 (0,1;0) | ||
| Yellow+gray filters in the range of 0,3 – 0,4 (0,25 – 0,45; out of) | 0,2 (0,1;0) | ||
| Experimental and theoretical transmittances do not coincide | 0,1 | ||
| TOTAL | 15 |
Оригинал в Архива: IZhO-2019-Exp_eng.pdf · официални решения: IZhO-2019-Exp_eng_sol.pdf