OPhO 2021, Експеримент — Задача 9. Problem 3.2
2021 Online Physics Olympiad: Invitational Contest — Experimental Exam · 7 т.
Sponsors
This competition could not be possible without the help of our sponsors, who are all doing great things in physics, math, and education.
General Instructions
The experimental examination consists of 1 long answer question worth 50 points over 1 full day from August 15, 0:01 am GMT.
- The team leader should submit their final solution document in this google form. We don’t anticipate a tie, but in the rare circumstance that there is one, the time you submit will be used to break it.
- If you wish to request a clarification, please use this form. To see all clarifications, view this document.
- Participants are given a google form where they are allowed to submit up-to 1 gigabyte of data for their solutions. It is recommended that participants write their solutions in . However, handwritten solutions (or a combination of both) are accepted too. If participants have more than one photo of a handwritten solution (
jpg, png, etc), it is required to organize them in the correct order in apdfbefore submitting.
Specific Rules
For any part of this paper, you are allowed to use online tools and resources to help you, as long as you are not requesting help from anyone outside of your team. Allowable resources include Wikipedia, research papers, Wolfram Alpha, Python, Excel, etc.
However, you must document every resource that you use and cite them when applicable. As a general rule of thumb, you should derive any results that cannot be found on Wikipedia. Therefore, solutions along the lines of: “By Wolfram Alpha, this is true.” will not be accepted. Be reasonable please.
Every time you are asked to run an experiment, you must provide the input parameters and a screenshot of the output.
Accessing the Program
To access the Python notebook, follow this link. You will be able to perform all the code online, without downloading anything. If you cannot access the link, we will also provide the source code on our website.
Background Information
In this problem, you will use a computer simulation written in Python to complete a series of questions relating to slit interference patterns. While you do not need to understand how exactly the code produces the results, it may be beneficial to understand the algorithm the code takes.
The program uses a simple algorithm to determine the interference pattern.
- An aperture pattern is created by specifying
slits. - The slits are divided into uniform segments.
- For each position on the screen, a wave is generated (and represented as a phasor) between the point and the center of each segment created in the previous step.
- These phasors are added up and squared to get the intensity.
- The final intensity pattern is normalized such that the maximum value is 1.
For this entire problem, assume that the heights of the slits are .
Remark: This algorithm treats the case as a thin slit (i.e. point source), and it is inaccurate for wide slits (try to see why). This only causes an issue for problem 1.2 & 1.3. Thin slits are used for all other experimental parts afterwards.
Part One
Let us first gain confidence in using the program. To do so, we will derive
via a series of questions.
Part Three
In the previous two parts, you have mostly been asked questions that can be solved analytically, and then used the code to double check your answer. Now, we will ask a few questions that requires data analysis.
Условие
The following diagram shows the amplitude of the interference pattern produced by a series of 9 thin slits, centered at . Each slit reduces the wavelength by some factor (this factor isn’t necessarily the same for each slit).
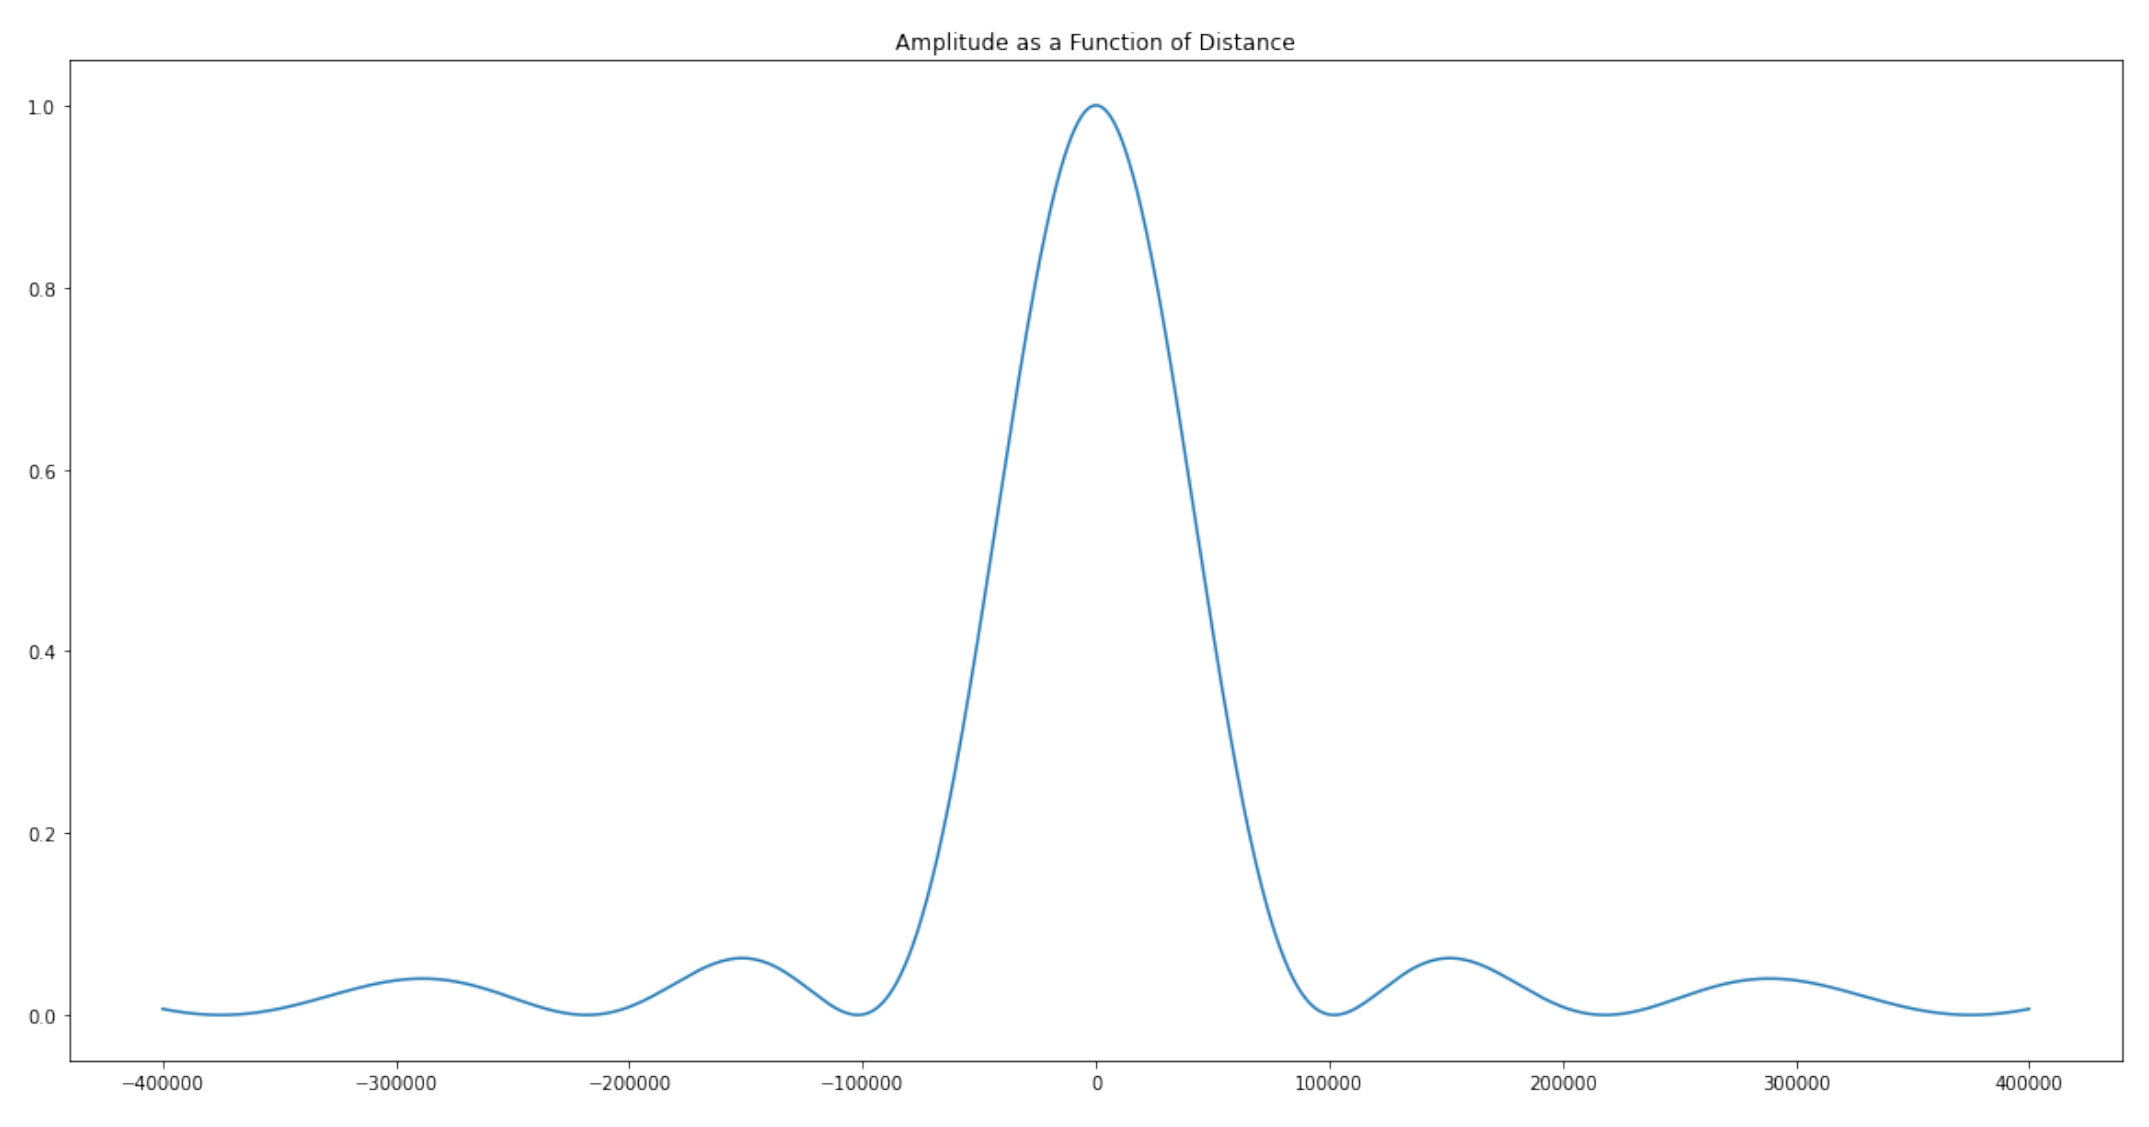
Again, the screen is the same distance away as the previous problem and the same scale is used. Determine how much each slit reduces the amplitude of light that passes through.
Let be the reduction factor of the slit centered at , which has units of . For example, the rightmost slit is located at . Make a plot of for and make note of patterns you see.
Отговори
- 0.0854δ(x ± 4) + 0.2070δ(x ± 3) + 0.2973δ(x ± 2) + 0.4130δ(x ± 1) + 0.5126δ(x); fx against x forms a straight line (r² = 0.998).
Решение
Similar to the previous problem, we “cut” off the interference pattern at a small angle (but big enough such that the distinctive behaviour of the curve is captured). Scaling to be , we can determine the Fourier coefficients to be:
| Parameter | Value | Standard Deviation |
|---|---|---|
| a0 | 2.045300e-01 | 1.285129e-04 |
| a1 | 3.294887e-01 | 1.439479e-04 |
| a2 | 2.371716e-01 | 8.086478e-05 |
| a3 | 1.652102e-01 | 8.350614e-05 |
| a4 | 6.081714e-02 | 2.142034e-04 |
Taking the Fourier Transform analytically, we get
Plotting against forms a straight line ().
Оригинал в Архива: experiment.pdf